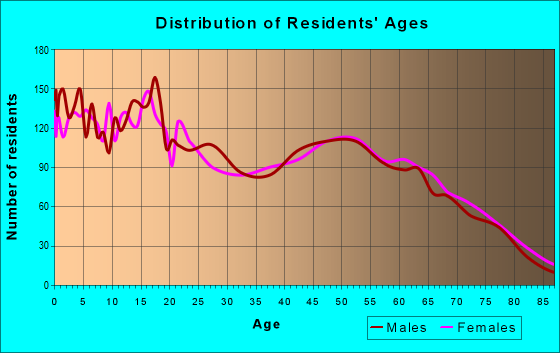
Estimated zip code population in 2022: 15,615 Zip code population in 2010: 16,097 Zip code population in 2000: 13,828
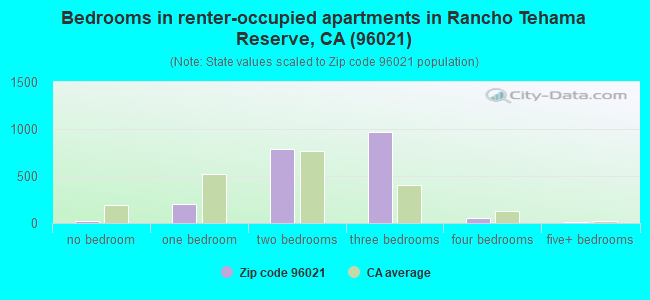
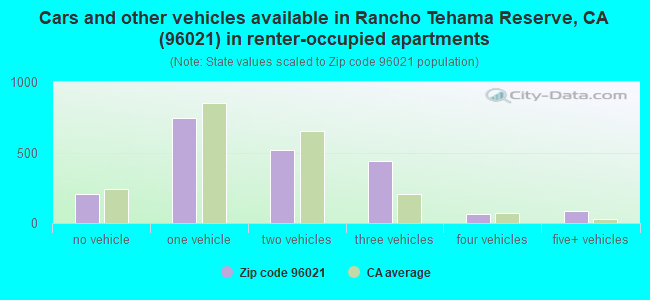
Houses and condos: 6,119 Renter-occupied apartments: 2,050
% of renters here:
37%
State:
44%
March 2022 cost of living index in zip code 96021: 91.2 (less than average, U.S. average is 100)
Land area: 238.6 sq. mi. Water area: 2.7 sq. mi.
Population density: 65 people per square mile
(very low).
OSM Map
General Map
Google Map
MSN Map
OSM Map
General Map
Google Map
MSN Map
OSM Map
General Map
Google Map
MSN Map
OSM Map
General Map
Google Map
MSN Map
Please wait while loading the map...
Real estate property taxes paid for housing units in 2022:
This zip code:
0.5% ($1,594)
California:
0.7% ($4,831)
Median real estate property taxes paid for housing units with mortgages in 2022: $2,078 (0.6%) Median real estate property taxes paid for housing units with no mortgage in 2022: $1,213 (0.5%)
Averages for the 2020 tax year for zip code 96021, filed in 2021:
Average Adjusted Gross Income (AGI) in 2020: $45,104 (Individual Income Tax Returns)
Here:
$45,104
State:
$95,910
Salary/wage: $40,581 (reported on 82.3% of returns)
Here:
$40,581
State:
$77,331
(% of AGI for various income ranges: 1325.1% for AGIs below $25k, 4101.3% for AGIs $25k-50k, 7452.5% for AGIs $50k-75k, 10053.8% for AGIs $75k-100k, 17104.8% for AGIs $100k-200k, 56780.0% for AGIs over 200k)
Taxable interest for individuals: $1,085 (reported on 23.8% of returns)
This zip code:
$1,085
California:
$2,294
(% of AGI for various income ranges: 18.0% for AGIs below $25k, 19.2% for AGIs $25k-50k, 29.9% for AGIs $50k-75k, 100.6% for AGIs $75k-100k, 117.2% for AGIs $100k-200k, 1510.0% for AGIs over 200k)
Ordinary dividends: $3,450 (reported on 6.9% of returns)
Here:
$3,450
State:
$10,949
(% of AGI for various income ranges: 14.4% for AGIs below $25k, 13.1% for AGIs $25k-50k, 32.2% for AGIs $50k-75k, 89.4% for AGIs $75k-100k, 134.1% for AGIs $100k-200k, 1480.0% for AGIs over 200k)
Net capital gain/loss in AGI: +$12,451 (reported on 7.1% of returns)
Here:
+$12,451
State:
+$49,306
(% of AGI for various income ranges: 1.9% for AGIs below $25k, 39.1% for AGIs $25k-50k, 48.1% for AGIs $50k-75k, 200.0% for AGIs $75k-100k, 472.1% for AGIs $100k-200k, 15440.0% for AGIs over 200k)
Profit/loss from business: +$14,019 (reported on 12.1% of returns)
Here:
+$14,019
State:
+$15,671
(% of AGI for various income ranges: 149.8% for AGIs below $25k, 167.4% for AGIs $25k-50k, 306.0% for AGIs $50k-75k, 323.2% for AGIs $75k-100k, 1190.7% for AGIs $100k-200k)
Taxable individual retirement arrangement distribution: $14,435 (reported on 4.5% of returns)
96021:
$14,435
California:
$23,505
(% of AGI for various income ranges: 35.1% for AGIs below $25k, 35.9% for AGIs $25k-50k, 88.5% for AGIs $50k-75k, 190.3% for AGIs $75k-100k, 715.5% for AGIs $100k-200k)
Total itemized deductions: $29,612 (reported on 3.7% of returns)
Here:
$29,612
State:
$39,517
(% of AGI for various income ranges: 26.3% for AGIs below $25k, 76.5% for AGIs $25k-50k, 192.4% for AGIs $50k-75k, 386.8% for AGIs $75k-100k, 805.2% for AGIs $100k-200k, 5580.0% for AGIs over 200k)
Charity contributions: $4,490 (reported on 2.9% of returns)
Here:
$4,490
State:
$12,598
(% of AGI for various income ranges: 13.5% for AGIs $25k-50k, 15.2% for AGIs $50k-75k, 24.1% for AGIs $75k-100k, 173.8% for AGIs $100k-200k)
Taxes paid: $6,404 (reported on 3.9% of returns)
96021:
$6,404
State:
$8,807
(% of AGI for various income ranges: 3.9% for AGIs below $25k, 11.9% for AGIs $25k-50k, 40.7% for AGIs $50k-75k, 81.5% for AGIs $75k-100k, 240.7% for AGIs $100k-200k, 1145.0% for AGIs over 200k)
Earned income credit: $2,417 (reported on 22.5% of returns)
Here:
$2,417
State:
$2,074
(% of AGI for various income ranges: 129.5% for AGIs below $25k, 98.8% for AGIs $25k-50k, 2.1% for AGIs $50k-75k)
Percentage of individuals using paid preparers for their 2020 taxes: 94.8%
Here:
95%
State:
92%
(% for various income ranges: 92.7% for AGIs below $25k, 95.4% for AGIs $25k-50k, 96.0% for AGIs $50k-75k, 96.3% for AGIs $75k-100k, 98.1% for AGIs $100k-200k, 100.0% for AGIs over 200k)
Averages for the 2012 tax year for zip code 96021, filed in 2013:
Average Adjusted Gross Income (AGI) in 2012: $36,445 (Individual Income Tax Returns)
Here:
$36,445
State:
$72,726
Salary/wage: $31,918 (reported on 83.3% of returns)
Here:
$31,918
State:
$59,079
(% of AGI for various income ranges: 76.4% for AGIs below $25k, 79.6% for AGIs $25k-50k, 73.4% for AGIs $50k-75k, 75.5% for AGIs $75k-100k, 66.4% for AGIs $100k-200k, 42.8% for AGIs over 200k)
Taxable interest for individuals: $1,348 (reported on 25.4% of returns)
This zip code:
$1,348
California:
$2,146
(% of AGI for various income ranges: 1.1% for AGIs below $25k, 0.5% for AGIs $25k-50k, 0.6% for AGIs $50k-75k, 0.8% for AGIs $75k-100k, 1.4% for AGIs $100k-200k, 2.2% for AGIs over 200k)
Ordinary dividends: $2,804 (reported on 9.0% of returns)
Here:
$2,804
State:
$9,308
(% of AGI for various income ranges: 0.8% for AGIs below $25k, 0.8% for AGIs $25k-50k, 0.4% for AGIs $50k-75k, 0.9% for AGIs $75k-100k, 0.9% for AGIs $100k-200k)
Net capital gain/loss in AGI: +$5,510 (reported on 8.3% of returns)
Here:
+$5,510
State:
+$30,460
(% of AGI for various income ranges: 0.2% for AGIs $25k-50k, 0.4% for AGIs $50k-75k, 1.4% for AGIs $75k-100k, 2.3% for AGIs $100k-200k, 10.5% for AGIs over 200k)
Profit/loss from business: +$11,308 (reported on 12.1% of returns)
Here:
+$11,308
State:
+$17,064
(% of AGI for various income ranges: 5.7% for AGIs below $25k, 3.1% for AGIs $25k-50k, 2.7% for AGIs $50k-75k, 1.4% for AGIs $75k-100k, 7.1% for AGIs $100k-200k)
Taxable individual retirement arrangement distribution: $10,450 (reported on 6.5% of returns)
96021:
$10,450
California:
$19,557
(% of AGI for various income ranges: 1.8% for AGIs below $25k, 1.4% for AGIs $25k-50k, 1.7% for AGIs $50k-75k, 3.0% for AGIs $75k-100k, 2.6% for AGIs $100k-200k)
Total itemized deductions: $19,736 (26% of AGI, reported on 18.6% of returns)
Here:
$19,736
State:
$34,004
Here:
25.6% of AGI
State:
22.7% of AGI
(% of AGI for various income ranges: 6.2% for AGIs below $25k, 7.5% for AGIs $25k-50k, 9.9% for AGIs $50k-75k, 13.6% for AGIs $75k-100k, 15.5% for AGIs $100k-200k, 10.4% for AGIs over 200k)
Charity contributions: $2,300 (reported on 12.9% of returns)
Here:
$2,300
State:
$4,659
(% of AGI for various income ranges: 0.3% for AGIs below $25k, 0.5% for AGIs $25k-50k, 0.8% for AGIs $50k-75k, 1.3% for AGIs $75k-100k, 1.5% for AGIs $100k-200k, 0.8% for AGIs over 200k)
Taxes paid: $5,494 (reported on 18.6% of returns)
96021:
$5,494
State:
$14,448
(% of AGI for various income ranges: 0.9% for AGIs below $25k, 1.3% for AGIs $25k-50k, 2.3% for AGIs $50k-75k, 3.7% for AGIs $75k-100k, 5.7% for AGIs $100k-200k, 6.4% for AGIs over 200k)
Earned income credit: $2,319 (reported on 27.1% of returns)
Here:
$2,319
State:
$2,286
(% of AGI for various income ranges: 7.4% for AGIs below $25k, 1.6% for AGIs $25k-50k)
Percentage of individuals using paid preparers for their 2012 taxes: 68.7%
Here:
69%
State:
64%
(% for various income ranges: 63.0% for AGIs below $25k, 73.5% for AGIs $25k-50k, 74.6% for AGIs $50k-75k, 71.9% for AGIs $75k-100k, 79.3% for AGIs $100k-200k, 75.0% for AGIs over 200k)
Averages for the 2004 tax year for zip code 96021, filed in 2005:
Average Adjusted Gross Income (AGI) in 2004: $32,408 (Individual Income Tax Returns)
Here:
$32,408
State:
$58,600
Salary/wage: $28,786 (reported on 82.5% of returns)
Here:
$28,786
State:
$49,455
(% of AGI for various income ranges: 172.8% for AGIs below $10k, 75.4% for AGIs $10k-25k, 82.5% for AGIs $25k-50k, 80.1% for AGIs $50k-75k, 70.6% for AGIs $75k-100k, 42.1% for AGIs over 100k)
Taxable interest for individuals: $1,959 (reported on 33.2% of returns)
This zip code:
$1,959
California:
$2,365
(% of AGI for various income ranges: 10.0% for AGIs below $10k, 2.1% for AGIs $10k-25k, 1.1% for AGIs $25k-50k, 1.5% for AGIs $50k-75k, 1.9% for AGIs $75k-100k, 3.3% for AGIs over 100k)
Taxable dividends: $1,604 (reported on 12.8% of returns)
Here:
$1,604
State:
$4,746
(% of AGI for various income ranges: 4.0% for AGIs below $10k, 0.7% for AGIs $10k-25k, 0.5% for AGIs $25k-50k, 0.4% for AGIs $50k-75k, 0.6% for AGIs $75k-100k, 0.7% for AGIs over 100k)
Net capital gain/loss: +$16,830 (reported on 13.0% of returns)
Here:
+$16,830
State:
+$23,418
(% of AGI for various income ranges: 2.8% for AGIs below $10k, 0.4% for AGIs $10k-25k, 0.7% for AGIs $25k-50k, 2.2% for AGIs $50k-75k, 7.5% for AGIs $75k-100k, 27.2% for AGIs over 100k)
Profit/loss from business: +$9,172 (reported on 13.9% of returns)
Here:
+$9,172
State:
+$16,826
(% of AGI for various income ranges: 0.8% for AGIs below $10k, 5.9% for AGIs $10k-25k, 3.7% for AGIs $25k-50k, 2.3% for AGIs $50k-75k, 4.4% for AGIs $75k-100k, 4.3% for AGIs over 100k)
IRA payment deduction: $3,277 (reported on 1.6% of returns)
96021:
$3,277
California:
$3,192
Self-employed pension: $6,700 (reported on 0.2% of returns)
Here:
$6,700
California:
$17,688
Total itemized deductions: $17,366 (26% of AGI, reported on 20.6% of returns)
Here:
$17,366
State:
$28,113
Here:
26.3% of AGI
State:
25.3% of AGI
(% of AGI for various income ranges: 31.8% for AGIs below $10k, 6.6% for AGIs $10k-25k, 9.0% for AGIs $25k-50k, 12.2% for AGIs $50k-75k, 13.4% for AGIs $75k-100k, 13.5% for AGIs over 100k)
Charity contributions deductions: $1,898 (3% of AGI, reported on 15.8% of returns)
Here:
$1,898
State:
$3,923
Here:
2.7% of AGI
State:
3.3% of AGI
(% of AGI for various income ranges: 0.8% for AGIs below $10k, 0.4% for AGIs $10k-25k, 0.7% for AGIs $25k-50k, 1.1% for AGIs $50k-75k, 1.3% for AGIs $75k-100k, 1.3% for AGIs over 100k)
Total tax: $4,092 (reported on 64.6% of returns)
96021:
$4,092
State:
$10,761
(% of AGI for various income ranges: 5.0% for AGIs below $10k, 3.3% for AGIs $10k-25k, 5.4% for AGIs $25k-50k, 7.8% for AGIs $50k-75k, 10.5% for AGIs $75k-100k, 16.1% for AGIs over 100k)
Earned income credit: $1,788 (reported on 24.2% of returns)
Here:
$1,788
State:
$1,763
Percentage of individuals using paid preparers for their 2004 taxes: 72.9%
Here:
73%
State:
66%
(% for various income ranges: 64.8% for AGIs below $10k, 74.4% for AGIs $10k-25k, 74.1% for AGIs $25k-50k, 76.7% for AGIs $50k-75k, 74.9% for AGIs $75k-100k, 86.9% for AGIs over 100k)
Likely homosexual households (counted as self-reported same-sex unmarried-partner households)
Lesbian couples: 0.2% of all households
Gay men: 0.0% of all households
Household received Food Stamps/SNAP in the past 12 months: 850 Household did not receive Food Stamps/SNAP in the past 12 months: 4,660
Women who had a birth in the past 12 months: 312 (167 now married, 146 unmarried) Women who did not have a birth in the past 12 months: 2,955 (1,316 now married, 1,633 unmarried)
Housing units in zip code 96021 with a mortgage: 1,817 (170 second mortgage, 56 both second mortgage and home equity loan) Houses without a mortgage: 3
Median monthly owner costs for units with a mortgage: $1,563 Median monthly owner costs for units without a mortgage: $494
Residents with income below the poverty level in 2022:
This zip code:
15.5%
Whole state:
12.2%
Residents with income below 50% of the poverty level in 2022:
This zip code:
8.0%
Whole state:
6.2%
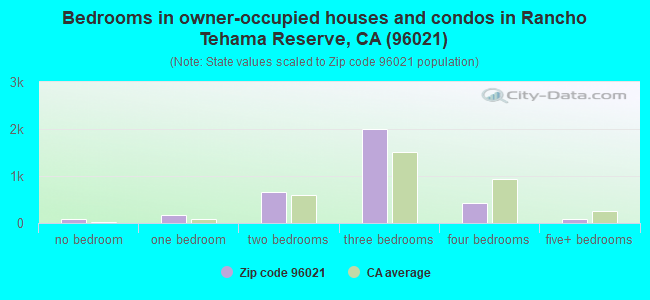
Median number of rooms in houses and condos:
Here:
5.8
State:
6.0
Median number of rooms in apartments:
Here:
5.1
State:
3.9
Notable locations in this zip code not listed on our city pages
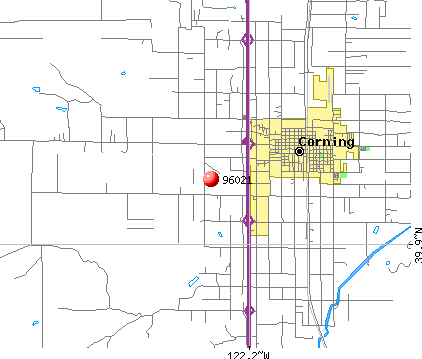
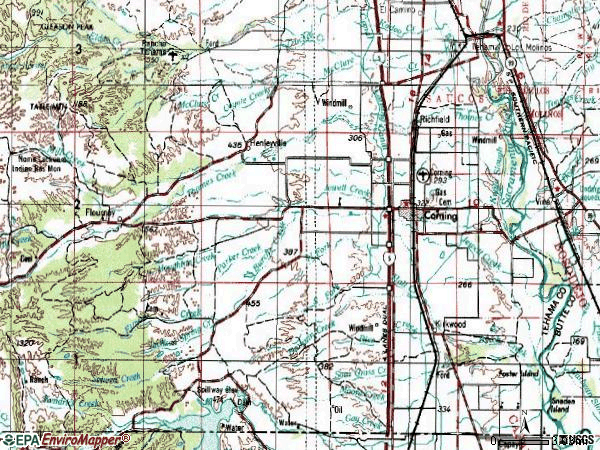
Notable locations in zip code 96021: Corning Sewage Disposal (A), Kopta Slough Boat-In Camp (B), Veterans Memorial Hall (C), Corning City Hall (D), Corning Branch Tehama County Library (E), Tehama County Fire Department Station 12 Corning (F), Tehama County Fire Department Station 11 Richfield (G), Tehama County Fire Department Station 13 Rancho Tehama (H), Corning Volunteer Fire Department (I). Display/hide their locations on the map
Churches in zip code 96021 include: Bethel Pentecostal Holiness Church (A), Church of Christ (B), The Church of Jesus Christ of Latter Day Saints (C), Church of the Nazarene (D), Family Bible Church (E), First Baptist Church (F), First Christian Church (G), First Presbyterian Church (H), First United Methodist Church (I). Display/hide their locations on the map
Streams, rivers, and creeks: Brannin Creek (A), China Slough (B), Coyote Creek (C), Hall Creek (D), Hoag Slough (E), Houghton Creek (F), Jackson Spring Creek (G), Jewett Creek (H), Kopta Slough (I). Display/hide their locations on the map
Parks in zip code 96021 include: Woodson Bridge State Recreation Area (1), Buckhorn Recreation Area (2), Estil C Clark Park (3), Northside Park (4), Woodson Park (5), Yost Park (6), Tehama County River Park (7). Display/hide their locations on the map
In group quarters: 82 (-1 institutionalized population)
Size of family households: 1,747 2-persons, 693 3-persons, 596 4-persons, 316 5-persons, 213 6-persons, 313 7-or-more-persons
Size of nonfamily households: 1,330 1-person, 224 2-persons, 50 3-persons
2,268 married couples with children.
916 single-parent households (59 men, 857 women).
58.5% of residents of 96021 zip code speak English at home.
40.4% of residents speak Spanish at home (66% very well, 11% well, 10% not well, 14% not at all).
0.6% of residents speak other Indo-European language at home (91% very well, 3% not well, 5% not at all).
0.5% of residents speak Asian or Pacific Island language at home (78% very well, 22% not well).
0.1% of residents speak other language at home (100% very well).
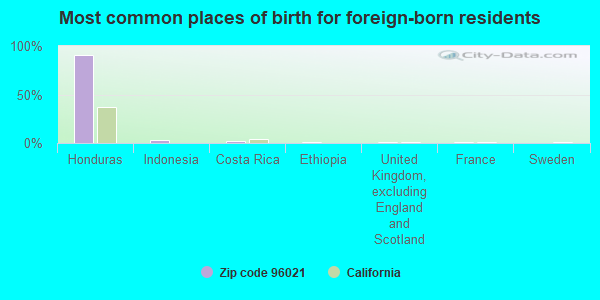
Foreign born population: 3,371 (21.6%) (41.1% of them are naturalized citizens)
This zip code:
21.6%
Whole state:
26.7%
91%Honduras
3%Indonesia
2%Costa Rica
1%Ethiopia
1%United Kingdom, excluding England and Scotland
1%France
1%Sweden
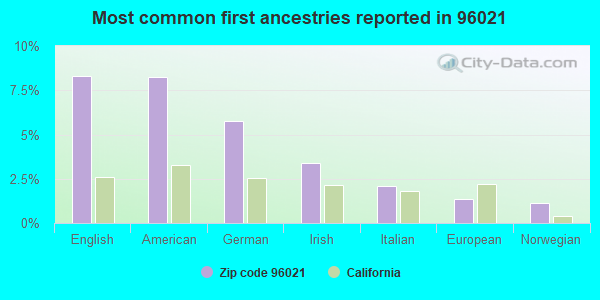
8%English
8%American
6%German
3%Irish
2%Italian
1%European
1%Norwegian
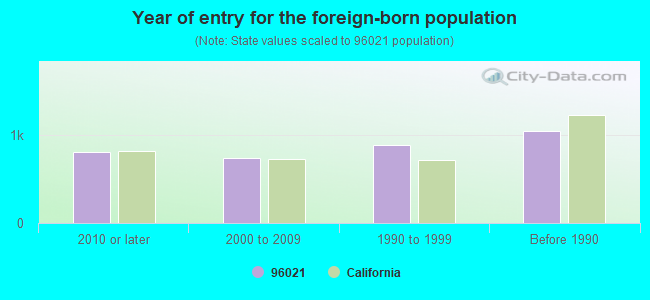
Year of entry for the foreign-born population
8072010 or later
7442000 to 2009
8951990 to 1999
1,055Before 1990
Major facilities with environmental interests located in this zip code:
NORTHLAND CEDAR INC (OLD HWY 99 AND ALAMEDA RD in RICHFIELD, CA)
STATE MASTER (California - Hazardous Waste Tracking) - HAZARDOU WASTE PROGRAM Small Quantity Generators, between 100 kg and 1000 kg of hazardous waste/month (Resource Conservation and Recovery Act (tracking hazardous waste)) - notification
KIRKWOOD ELEMENTARY (2049 KIRKWOOD ROAD in CORNING, CA)
(National Center for Education Statistics) - STATE ID-6053540
MAYWOOD INTERMEDIATE (1666 MARGUERITE in CORNING, CA)
(National Center for Education Statistics) - STATE ID-6093546 Organizations: CORNING UNION ELEMENTARY (SCHOOL DISTRICT)
CENTENNIAL (CONTINUATION) HIGH (250 E. FIG LANE in CORNING, CA)
(National Center for Education Statistics) - STATE ID-5231675 Organizations: CORNING UNION HIGH (SCHOOL DISTRICT)
INDUSTRIAL WWTP NPDES (GARDINER FERRY RD in CORNING, CA)
National Pollutant Discharge Elimination System NON-MAJOR (Tracking pollutant discharge elimination systems) - permit Business SIC classification: PICKLED FRUITS AND VEGETABLES, VEGETABLE SAUCES AND SEASONINGS, AND SALAD DRESSINGS Organizations: BELL CARTER OLIVE COMPANY INC (CONTACT/OWNER)
Alternative names: BELL CARTER OLIVE COMPANY INC
CALIFORNIA NORTHERN RAILROAD (CFNR STATION OF CORNING in CORNING, CA)
(Resource Conservation and Recovery Act (tracking hazardous waste))
CALIFORNIA NORTHERN RAILROAD (CFNR STATION OF RICHFIELD in CORNING, CA)
(Resource Conservation and Recovery Act (tracking hazardous waste))
CALIFORNIA NORTHERN RAILROAD (CFNR STATION OF TEHAMA in CORNING, CA)
(Resource Conservation and Recovery Act (tracking hazardous waste))
7-11 FOOD STORE #20054 (1425 SOLANO STREET in CORNING, CA, CA)
CRITERIA AND HAZARDOUS AIR POLLUTANT INVENTORY (Inventory of air pollution sources) Business SIC classification: GASOLINE SERVICE STATIONS
ECO SHELL (5230 GRANGE ROAD in CORNING, CA, CA)
CRITERIA AND HAZARDOUS AIR POLLUTANT INVENTORY (Inventory of air pollution sources)
ENDICOTT TRUCKING INC. (23052 SONOMA AVE in CORNING, CA, CA)
CRITERIA AND HAZARDOUS AIR POLLUTANT INVENTORY (Inventory of air pollution sources) Business SIC classification: CONSTRUCTION SAND AND GRAVEL
FOX'S SAND AND GRAVEL (24154 MARIA ROAD in CORNING, CA, CA)
CRITERIA AND HAZARDOUS AIR POLLUTANT INVENTORY (Inventory of air pollution sources) Business SIC classification: CONSTRUCTION SAND AND GRAVEL
HEAVY METAL (23114 SONOMA STREET in CORNING, CA, CA)
CRITERIA AND HAZARDOUS AIR POLLUTANT INVENTORY (Inventory of air pollution sources) Business SIC classification: TOP, BODY, AND UPHOLSTERY REPAIR SHOPS AND PAINT SHOPS
Housing units lacking complete plumbing facilities: 3.0% Housing units lacking complete kitchen facilities: 1.6%
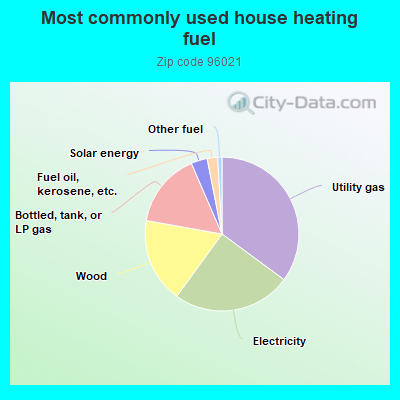
35.1%Utility gas
24.9%Electricity
17.8%Wood
15.7%Bottled, tank, or LP gas
3.4%Solar energy
2.2%Fuel oil, kerosene, etc.
0.9%Other fuel
Population in 1990: 12,436. Population change in the 1990s: +1,392 (+11.2%).
Place of birth for U.S.-born residents:
This state: 9,675
Northeast: 221
Midwest: 699
South: 670
West: 827
53% of the 96021 zip code residents lived in the same house 5 years ago. Out of people who lived in different houses, 52% lived in this county. Out of people who lived in different counties, 50% lived in California.
97% of the 96021 zip code residents lived in the same house 1 year ago. Out of people who lived in different houses, 36% moved from this county. Out of people who lived in different houses, 56% moved from different county within same state. Out of people who lived in different houses, 18% moved from different state. Out of people who lived in different houses, 4% moved from abroad.
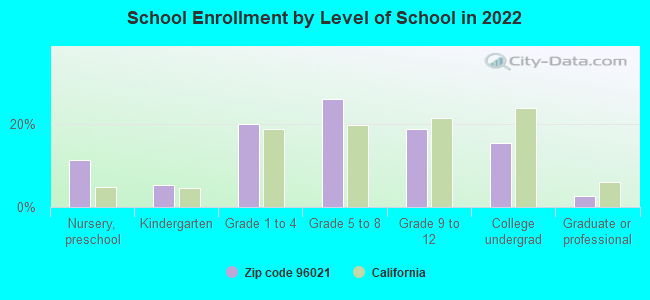
Private vs. public school enrollment:
Students in private schools in grades 1 to 8 (elementary and middle school): 121
Here:
7.8%
California:
10.5%
Students in private schools in grades 9 to 12 (high school): 70
Here:
11.0%
California:
8.5%
Students in private undergraduate colleges: 52
Here:
10.1%
California:
15.9%
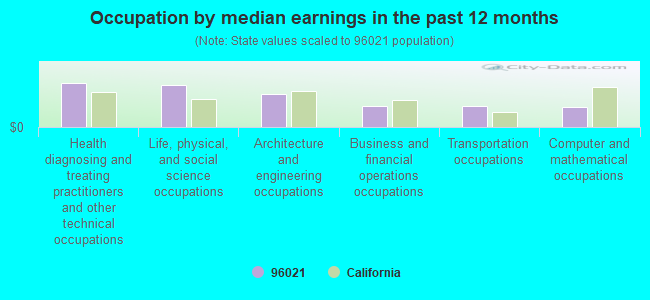
Occupation by median earnings in the past 12 months ($)
118,917Health diagnosing and treating practitioners and other technical occupations
114,287Life, physical, and social science occupations
90,239Architecture and engineering occupations
56,614Business and financial operations occupations
56,283Transportation occupations
53,623Computer and mathematical occupations
Companies with federal contracts located in this zip code (CORNING, CA):
KEN VAUGHN (25345 S AVE; small business) : $462,235 in 29 contractsfrom 2000 to 2006
Contracts for Fire Protection Services, Custodial Janitorial Services, Landscaping/Groundskeeping Services by U.S. Army Corps of Engineers - civil program financing only, Army Signed by year:2000: $131,330; 2001: $0; 2002: $87,432; 2003: $0; 2004: $172,314; 2005: $94,151; 2006: -$22,992.
Biggest contracts:
$65,665 with U.S. Army Corps of Engineers - civil program financing only for Fire Protection Services. Signed on 2000-12-05. Completion date: 2001-09-30.
$65,665 with U.S. Army Corps of Engineers - civil program financing only for Custodial Janitorial Services. Signed on 2000-09-29. Completion date: 2001-09-30.
$48,767, same as above.Signed on 2002-11-08. Completion date: 2003-09-30.
$42,943 with Army for Landscaping/Groundskeeping Services. Signed on 2004-01-28. Completion date: 2003-09-30.
TEPA EC, LLC (2655 BARHAM AVE; small business) : $348,773 in 6 contractsin 2006
Contracts for Maintenance, Repair or Alteration of Real Property -- Pollution Abatement and Control Facilities, Buoys, Maintenance, Repair or Alteration of Real Property -- Miscellaneous Buildings, Maintenance, Repair or Alteration of Real Property -- Other Non-Building Facilities by Air Force, Army Signed by year:2000: $0; 2001: $0; 2002: $0; 2003: $0; 2004: $0; 2005: $0; 2006: $348,773.
Biggest contracts:
$123,582 with Air Force for Maintenance, Repair or Alteration of Real Property -- Pollution Abatement and Control Facilities. Signed on 2006-05-22. Completion date: 2006-10-01.
$103,126 with Army for Buoys. Taking place in GA. Signed on 2006-06-21. Completion date: 2006-09-30.
$78,203 with Air Force for Maintenance, Repair or Alteration of Real Property -- Miscellaneous Buildings. Taking place in GA. Signed on 2006-05-24. Completion date: 2006-07-07.
$18,961, same as above.Signed on 2006-03-21. Completion date: 2006-05-21.
D-KS PRECISION MACHINING & MAN (24818 GARDINER FERRY RD; small business)
$56,103 with Defense Logistics Agency for Aircraft Hydraulic, Vacuum, and De-icing System Components. Signed on 2000-08-14. Completion date: 2001-06-20.
ANDERSON COTTONWOOD DISPOSAL (3281 HWY 99 W; small business) : -$91 in 2 contractsfrom 2002 to 2003
$2,000 with Bureau of Reclamation for Trash/Garbage Collection Services - Including Portable Sanitation Services. Signed on 2002-07-15. Completion date: 2003-06-15.
-$2,091, same as above.Signed on 2003-06-15. Completion date: 2003-06-15.
Top industries in this zip code by the number of employees in 2005:
Other Services (except Public Administration): Car Washes (20-49: 2, 5-9: 1, 1-4: 1)
Health Care and Social Assistance: Home Health Care Services (50-99: 1)
People in group quarters in 2010:
12 people in group homes intended for adults
9 people in workers' group living quarters and job corps centers
6 people in group homes for juveniles (non-correctional)
6 people in other noninstitutional facilities
People in group quarters in 2000:
44 people in other noninstitutional group quarters
40 people in homes or halfway houses for drug/alcohol abuse
25 people in religious group quarters
6 people in other group homes
3 people in homes for the mentally retarded
Fatal accident statistics in 2014:
Fatal accident count: 4
Vehicles involved in fatal accidents: 5
Fatal accidents caused by drunken drivers: 2
Fatalities: 5
Persons involved in fatal accidents: 6
Pedestrians involved in fatal accidents: 0
Fatal accident statistics in 2013:
Fatal accident count: 1
Vehicles involved in fatal accidents: 1
Fatal accidents caused by drunken drivers: 0
Fatalities: 1
Persons involved in fatal accidents: 1
Pedestrians involved in fatal accidents: 1
2005 - 2018 National Fire Incident Reporting System (NFIRS) incidents
According to the data from the years 2005 - 2018 the average number of fire incidents per year is 76. The highest number of reported fires - 106 took place in 2007, and the least - 36 in 2006. The data has an increasing trend.
When looking into fire subcategories, the most reports belonged to: Outside Fires (60.0%), and Structure Fires (19.0%).
Fire incident types reported to NFIRS in Zip Code 96021
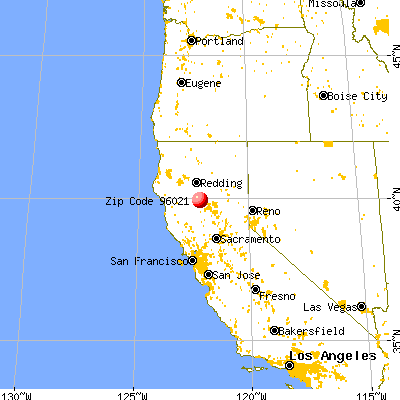


 Nearest zip codes: 96035, 96090, 95963, 96029, 96092, 96055.
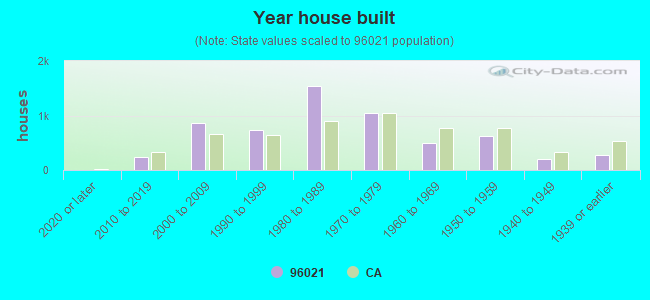


 According to the data from the years 2005 - 2018 the average number of fire incidents per year is 76. The highest number of reported fires - 106 took place in 2007, and the least - 36 in 2006. The data has an increasing trend.
 When looking into fire subcategories, the most reports belonged to: Outside Fires (60.0%), and Structure Fires (19.0%).