Estimated zip code population in 2022: 57,522 Zip code population in 2010: 50,586 Zip code population in 2000: 54,856
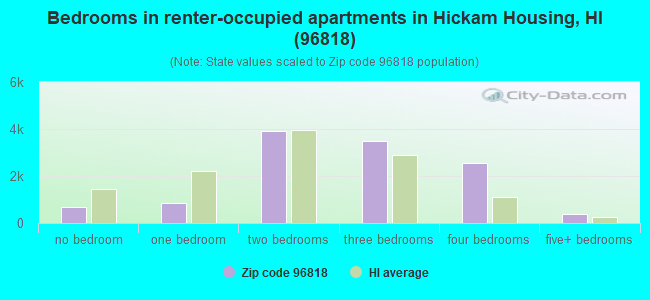
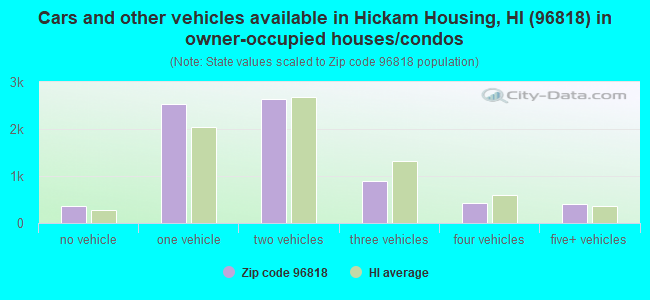
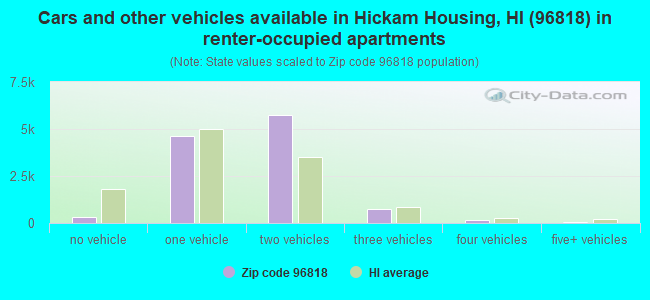
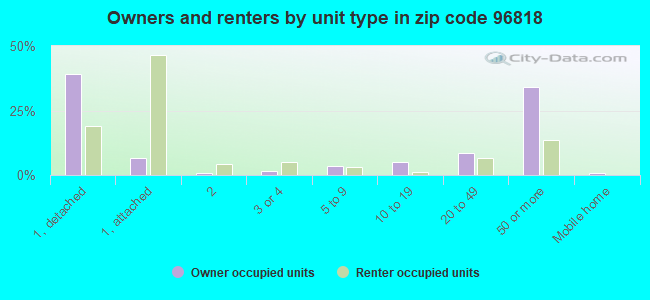
Houses and condos: 20,423 Renter-occupied apartments: 11,882
% of renters here:
62%
State:
37%
March 2022 cost of living index in zip code 96818: 135.6 (high, U.S. average is 100)
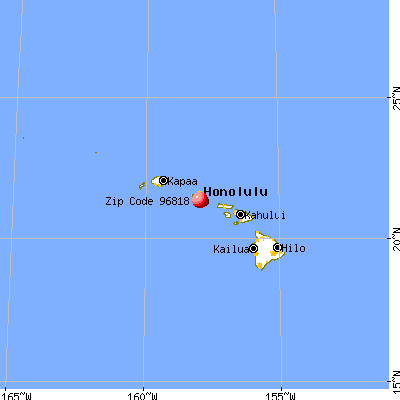
Land area: 11.5 sq. mi. Water area: 3.6 sq. mi.
Population density: 5,001 people per square mile
(average).
OSM Map
General Map
Google Map
MSN Map
OSM Map
General Map
Google Map
MSN Map
OSM Map
General Map
Google Map
MSN Map
OSM Map
General Map
Google Map
MSN Map
Please wait while loading the map...
Real estate property taxes paid for housing units in 2022:
This zip code:
0.3% ($1,933)
Hawaii:
0.3% ($2,092)
Median real estate property taxes paid for housing units with mortgages in 2022: $2,107 (0.3%) Median real estate property taxes paid for housing units with no mortgage in 2022: $1,600 (0.3%)
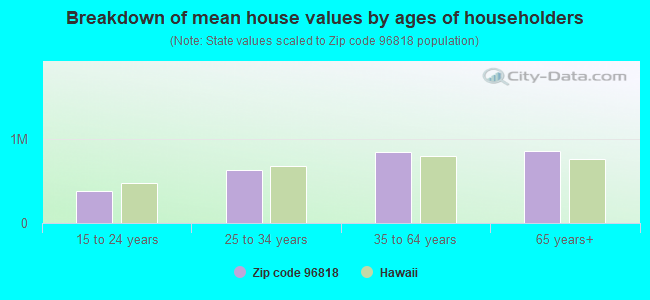
Estimated median house/condo value in 2022: $705,578
96818:
$705,578
Hawaii:
$820,100
According to our research of Hawaii and other state lists, there were 39 registered sex offenders living in 96818 zip code as of April 26, 2024. The ratio of all residents to sex offenders in zip code 96818 is 1,520 to 1. The ratio of registered sex offenders to all residents in this zip code is much lower than the state average.
Median resident age:
This zip code:
33.6 years
Hawaii median age:
40.8 years
Average household size:
This zip code:
3.0 people
Hawaii:
2.8 people
Averages for the 2020 tax year for zip code 96818, filed in 2021:
Average Adjusted Gross Income (AGI) in 2020: $66,651 (Individual Income Tax Returns)
Here:
$66,651
State:
$72,945
Salary/wage: $59,299 (reported on 86.3% of returns)
Here:
$59,299
State:
$57,697
(% of AGI for various income ranges: 1280.8% for AGIs below $25k, 3891.8% for AGIs $25k-50k, 6807.9% for AGIs $50k-75k, 10183.8% for AGIs $75k-100k, 19620.7% for AGIs $100k-200k, 72001.2% for AGIs over 200k)
Taxable interest for individuals: $788 (reported on 35.0% of returns)
This zip code:
$788
Hawaii:
$1,356
(% of AGI for various income ranges: 15.2% for AGIs below $25k, 13.2% for AGIs $25k-50k, 28.1% for AGIs $50k-75k, 58.4% for AGIs $75k-100k, 109.0% for AGIs $100k-200k, 559.4% for AGIs over 200k)
Ordinary dividends: $2,811 (reported on 21.1% of returns)
Here:
$2,811
State:
$6,387
(% of AGI for various income ranges: 17.3% for AGIs below $25k, 16.1% for AGIs $25k-50k, 43.6% for AGIs $50k-75k, 79.4% for AGIs $75k-100k, 286.9% for AGIs $100k-200k, 2090.0% for AGIs over 200k)
Net capital gain/loss in AGI: +$8,943 (reported on 19.8% of returns)
Here:
+$8,943
State:
+$23,240
(% of AGI for various income ranges: 6.3% for AGIs below $25k, 26.8% for AGIs $25k-50k, 54.1% for AGIs $50k-75k, 119.8% for AGIs $75k-100k, 570.0% for AGIs $100k-200k, 13955.6% for AGIs over 200k)
Profit/loss from business: +$9,297 (reported on 11.7% of returns)
Here:
+$9,297
State:
+$15,381
(% of AGI for various income ranges: 67.3% for AGIs below $25k, 50.6% for AGIs $25k-50k, 117.2% for AGIs $50k-75k, 150.9% for AGIs $75k-100k, 258.6% for AGIs $100k-200k, 4811.9% for AGIs over 200k)
Taxable individual retirement arrangement distribution: $16,827 (reported on 7.1% of returns)
96818:
$16,827
Hawaii:
$19,883
(% of AGI for various income ranges: 55.2% for AGIs below $25k, 43.9% for AGIs $25k-50k, 100.2% for AGIs $50k-75k, 179.8% for AGIs $75k-100k, 503.1% for AGIs $100k-200k, 3828.1% for AGIs over 200k)
Self-employed (Keogh) retirement plans: $17,920 (reported on 0.2% of returns)
96818:
$17,920
Hawaii:
$25,010
(% of AGI for various income ranges: 7.1% for AGIs $50k-75k, 420.6% for AGIs over 200k)
Total itemized deductions: $28,753 (reported on 8.2% of returns)
Here:
$28,753
State:
$33,097
(% of AGI for various income ranges: 57.6% for AGIs below $25k, 74.7% for AGIs $25k-50k, 196.2% for AGIs $50k-75k, 465.6% for AGIs $75k-100k, 1137.4% for AGIs $100k-200k, 6044.4% for AGIs over 200k)
Charity contributions: $5,773 (reported on 6.1% of returns)
Here:
$5,773
State:
$7,368
(% of AGI for various income ranges: 2.8% for AGIs below $25k, 6.9% for AGIs $25k-50k, 24.4% for AGIs $50k-75k, 62.9% for AGIs $75k-100k, 171.3% for AGIs $100k-200k, 1298.1% for AGIs over 200k)
Taxes paid: $7,410 (reported on 8.0% of returns)
96818:
$7,410
State:
$7,601
(% of AGI for various income ranges: 5.7% for AGIs below $25k, 10.7% for AGIs $25k-50k, 45.2% for AGIs $50k-75k, 123.5% for AGIs $75k-100k, 327.6% for AGIs $100k-200k, 1512.5% for AGIs over 200k)
Earned income credit: $2,015 (reported on 12.7% of returns)
Here:
$2,015
State:
$2,008
(% of AGI for various income ranges: 72.1% for AGIs below $25k, 69.0% for AGIs $25k-50k, 2.7% for AGIs $50k-75k)
Percentage of individuals using paid preparers for their 2020 taxes: 90.7%
Here:
91%
State:
89%
(% for various income ranges: 88.1% for AGIs below $25k, 92.9% for AGIs $25k-50k, 90.8% for AGIs $50k-75k, 91.4% for AGIs $75k-100k, 89.9% for AGIs $100k-200k, 87.7% for AGIs over 200k)
Averages for the 2012 tax year for zip code 96818, filed in 2013:
Average Adjusted Gross Income (AGI) in 2012: $51,293 (Individual Income Tax Returns)
Here:
$51,293
State:
$57,303
Salary/wage: $47,325 (reported on 88.4% of returns)
Here:
$47,325
State:
$47,500
(% of AGI for various income ranges: 83.6% for AGIs below $25k, 90.7% for AGIs $25k-50k, 86.5% for AGIs $50k-75k, 83.3% for AGIs $75k-100k, 76.9% for AGIs $100k-200k, 46.0% for AGIs over 200k)
Taxable interest for individuals: $652 (reported on 36.2% of returns)
This zip code:
$652
Hawaii:
$1,212
(% of AGI for various income ranges: 0.6% for AGIs below $25k, 0.3% for AGIs $25k-50k, 0.4% for AGIs $50k-75k, 0.4% for AGIs $75k-100k, 0.6% for AGIs $100k-200k, 0.6% for AGIs over 200k)
Ordinary dividends: $2,327 (reported on 18.2% of returns)
Here:
$2,327
State:
$5,430
(% of AGI for various income ranges: 0.8% for AGIs below $25k, 0.4% for AGIs $25k-50k, 0.5% for AGIs $50k-75k, 0.7% for AGIs $75k-100k, 1.1% for AGIs $100k-200k, 2.5% for AGIs over 200k)
Net capital gain/loss in AGI: +$4,259 (reported on 13.0% of returns)
Here:
+$4,259
State:
+$13,910
(% of AGI for various income ranges: 0.1% for AGIs $50k-75k, 0.4% for AGIs $75k-100k, 1.0% for AGIs $100k-200k, 10.3% for AGIs over 200k)
Profit/loss from business: +$12,164 (reported on 10.0% of returns)
Here:
+$12,164
State:
+$15,881
(% of AGI for various income ranges: 5.0% for AGIs below $25k, 1.4% for AGIs $25k-50k, 1.3% for AGIs $50k-75k, 1.4% for AGIs $75k-100k, 2.4% for AGIs $100k-200k, 8.4% for AGIs over 200k)
Taxable individual retirement arrangement distribution: $12,778 (reported on 6.6% of returns)
96818:
$12,778
Hawaii:
$15,720
(% of AGI for various income ranges: 1.9% for AGIs below $25k, 0.9% for AGIs $25k-50k, 1.1% for AGIs $50k-75k, 1.5% for AGIs $75k-100k, 2.3% for AGIs $100k-200k, 3.7% for AGIs over 200k)
Self-employment retirement plans: $19,333 (reported on 0.3% of returns)
96818:
$19,333
Hawaii:
$20,355
Total itemized deductions: $20,706 (24% of AGI, reported on 25.3% of returns)
Here:
$20,706
State:
$25,496
Here:
24.2% of AGI
State:
23.1% of AGI
(% of AGI for various income ranges: 8.1% for AGIs below $25k, 6.6% for AGIs $25k-50k, 9.8% for AGIs $50k-75k, 11.7% for AGIs $75k-100k, 13.2% for AGIs $100k-200k, 12.1% for AGIs over 200k)
Charity contributions: $3,112 (reported on 20.3% of returns)
Here:
$3,112
State:
$3,353
(% of AGI for various income ranges: 0.6% for AGIs below $25k, 0.8% for AGIs $25k-50k, 1.2% for AGIs $50k-75k, 1.5% for AGIs $75k-100k, 1.7% for AGIs $100k-200k, 1.2% for AGIs over 200k)
Taxes paid: $6,016 (reported on 25.2% of returns)
96818:
$6,016
State:
$8,029
(% of AGI for various income ranges: 1.0% for AGIs below $25k, 1.4% for AGIs $25k-50k, 2.4% for AGIs $50k-75k, 3.2% for AGIs $75k-100k, 4.5% for AGIs $100k-200k, 6.1% for AGIs over 200k)
Earned income credit: $2,111 (reported on 19.8% of returns)
Here:
$2,111
State:
$2,113
(% of AGI for various income ranges: 6.1% for AGIs below $25k, 1.6% for AGIs $25k-50k)
Percentage of individuals using paid preparers for their 2012 taxes: 46.2%
Here:
46%
State:
53%
(% for various income ranges: 46.7% for AGIs below $25k, 42.3% for AGIs $25k-50k, 46.7% for AGIs $50k-75k, 47.3% for AGIs $75k-100k, 53.4% for AGIs $100k-200k, 72.0% for AGIs over 200k)
Averages for the 2004 tax year for zip code 96818, filed in 2005:
Average Adjusted Gross Income (AGI) in 2004: $42,631 (Individual Income Tax Returns)
Here:
$42,631
State:
$46,564
Salary/wage: $39,332 (reported on 89.6% of returns)
Here:
$39,332
State:
$39,831
(% of AGI for various income ranges: 121.5% for AGIs below $10k, 87.2% for AGIs $10k-25k, 90.8% for AGIs $25k-50k, 87.2% for AGIs $50k-75k, 80.7% for AGIs $75k-100k, 63.8% for AGIs over 100k)
Taxable interest for individuals: $761 (reported on 50.6% of returns)
This zip code:
$761
Hawaii:
$1,263
(% of AGI for various income ranges: 3.2% for AGIs below $10k, 1.0% for AGIs $10k-25k, 0.6% for AGIs $25k-50k, 0.7% for AGIs $50k-75k, 1.0% for AGIs $75k-100k, 1.3% for AGIs over 100k)
Taxable dividends: $1,391 (reported on 21.4% of returns)
Here:
$1,391
State:
$3,145
(% of AGI for various income ranges: 2.1% for AGIs below $10k, 0.6% for AGIs $10k-25k, 0.3% for AGIs $25k-50k, 0.5% for AGIs $50k-75k, 0.8% for AGIs $75k-100k, 1.3% for AGIs over 100k)
Net capital gain/loss: +$7,735 (reported on 16.2% of returns)
Here:
+$7,735
State:
+$16,059
(% of AGI for various income ranges: -0.6% for AGIs below $10k, 0.1% for AGIs $10k-25k, 0.2% for AGIs $25k-50k, 0.3% for AGIs $50k-75k, 1.2% for AGIs $75k-100k, 12.2% for AGIs over 100k)
Profit/loss from business: +$9,784 (reported on 10.4% of returns)
Here:
+$9,784
State:
+$13,847
(% of AGI for various income ranges: 6.5% for AGIs below $10k, 3.4% for AGIs $10k-25k, 1.6% for AGIs $25k-50k, 1.6% for AGIs $50k-75k, 2.2% for AGIs $75k-100k, 3.8% for AGIs over 100k)
IRA payment deduction: $2,555 (reported on 3.8% of returns)
96818:
$2,555
Hawaii:
$2,867
(% of AGI for various income ranges: 0.5% for AGIs below $10k, 0.3% for AGIs $10k-25k, 0.3% for AGIs $25k-50k, 0.2% for AGIs $50k-75k, 0.1% for AGIs $75k-100k, 0.1% for AGIs over 100k)
Self-employed pension: $10,734 (reported on 0.5% of returns)
Here:
$10,734
Hawaii:
$15,523
(% of AGI for various income ranges: 0.0% for AGIs $25k-50k, 0.0% for AGIs $50k-75k, 0.1% for AGIs $75k-100k, 0.4% for AGIs over 100k)
Total itemized deductions: $17,221 (24% of AGI, reported on 25.1% of returns)
Here:
$17,221
State:
$20,647
Here:
23.6% of AGI
State:
23.5% of AGI
(% of AGI for various income ranges: 9.0% for AGIs below $10k, 6.2% for AGIs $10k-25k, 7.4% for AGIs $25k-50k, 10.9% for AGIs $50k-75k, 13.3% for AGIs $75k-100k, 12.6% for AGIs over 100k)
Charity contributions deductions: $2,821 (4% of AGI, reported on 22.2% of returns)
Here:
$2,821
State:
$2,966
Here:
3.8% of AGI
State:
3.3% of AGI
(% of AGI for various income ranges: 0.5% for AGIs below $10k, 0.8% for AGIs $10k-25k, 1.1% for AGIs $25k-50k, 1.5% for AGIs $50k-75k, 2.0% for AGIs $75k-100k, 1.9% for AGIs over 100k)
Total tax: $5,176 (reported on 72.7% of returns)
96818:
$5,176
State:
$7,224
(% of AGI for various income ranges: 3.1% for AGIs below $10k, 3.7% for AGIs $10k-25k, 5.2% for AGIs $25k-50k, 8.1% for AGIs $50k-75k, 10.1% for AGIs $75k-100k, 16.2% for AGIs over 100k)
Earned income credit: $1,512 (reported on 16.6% of returns)
Here:
$1,512
State:
$1,536
Percentage of individuals using paid preparers for their 2004 taxes: 56.1%
Here:
56%
State:
58%
(% for various income ranges: 50.5% for AGIs below $10k, 58.8% for AGIs $10k-25k, 56.5% for AGIs $25k-50k, 56.8% for AGIs $50k-75k, 55.1% for AGIs $75k-100k, 57.3% for AGIs over 100k)
Likely homosexual households (counted as self-reported same-sex unmarried-partner households)
Lesbian couples: 0.0% of all households
Gay men: 0.1% of all households
Household received Food Stamps/SNAP in the past 12 months: 1,231 Household did not receive Food Stamps/SNAP in the past 12 months: 17,980
Women who had a birth in the past 12 months: 815 (736 now married, 88 unmarried) Women who did not have a birth in the past 12 months: 13,203 (7,782 now married, 5,318 unmarried)
Housing units in zip code 96818 with a mortgage: 4,137 (839 second mortgage, 14 home equity loan, 716 both second mortgage and home equity loan) Houses without a mortgage: 295
Median monthly owner costs for units with a mortgage: $2,739 Median monthly owner costs for units without a mortgage: $797
Residents with income below the poverty level in 2022:
This zip code:
6.9%
Whole state:
10.2%
Residents with income below 50% of the poverty level in 2022:
This zip code:
2.5%
Whole state:
4.7%
Median number of rooms in houses and condos:
Here:
4.8
State:
5.5
Median number of rooms in apartments:
Here:
5.2
State:
3.9
Notable locations in this zip code not listed on our city pages
Notable locations in zip code 96818: Mamala Bay Golf Course (A), Navy-Marine Golf Course (B), USS Arizona Memorial (C), Honolulu International Country Club (D), Dry Dock Number 1 (E), Dry Dock Number 2 (F), Dry Dock Number 3 (G), Dry Dock Number 4 (H), Hickman Field Wharf (I), Merry Point Landing (J), Cincpac Headquarters (K), Airport Industrial Park (L), Salt Lake-Moanalua Public Library (M), Hickam Fire Department (N), Honolulu Fire Department Station 30 Moanalua (O), Honolulu Fire Department Station 8 Mokulele (P). Display/hide their locations on the map
Churches in zip code 96818 include: Aloha Jewish Chapel (A), Pearl Harbor Memorial Chapel (B), Submarine Memorial Chapel (C), Holy Family Church (D). Display/hide their locations on the map
Parks in zip code 96818 include: Hoaloha Park (1), USS Utah (2), Salt Lake District Park (3), USS Bowfin (4), Makalapa Park (5), Aliamanu Playground (6). Display/hide their locations on the map
Tourist attractions (not listed on the city page) : USS Bowfin Submarine Museum & Park (11 Arizona Memorial Drive), Poets Ambitions (Cultural Attractions- Events- & Facilities; 1432 I Pohina Street), A Hawaiian Fantasy (Recreational Trips & Guides; 268 4745 Boungainville Drive).
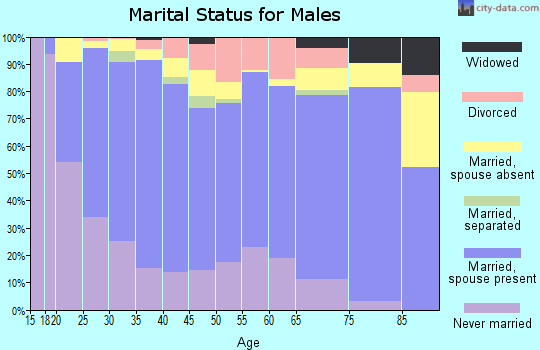
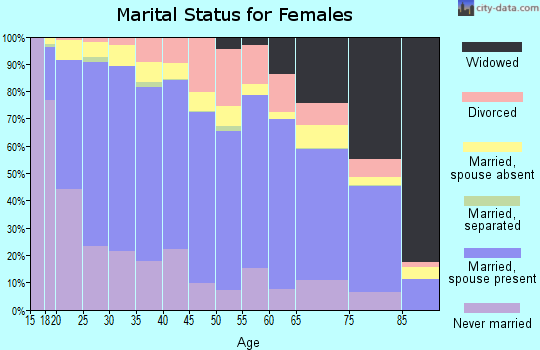
11,897 married couples with children.
2,054 single-parent households (336 men, 1,718 women).
74.1% of residents of 96818 zip code speak English at home.
2.8% of residents speak Spanish at home (90% very well, 8% well, 2% not well).
1.5% of residents speak other Indo-European language at home (82% very well, 13% well, 6% not well).
20.2% of residents speak Asian or Pacific Island language at home (48% very well, 35% well, 15% not well, 3% not at all).
0.6% of residents speak other language at home (84% very well, 13% well, 3% not well).
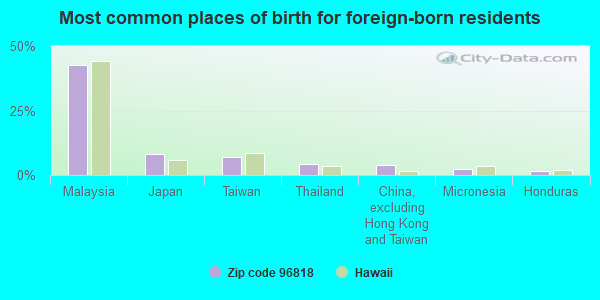
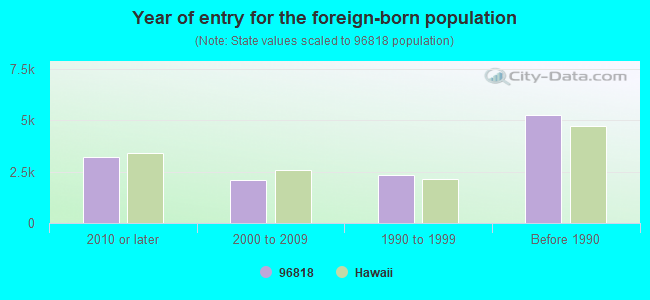
Foreign born population: 10,048 (17.5%) (75.2% of them are naturalized citizens)
Major facilities with environmental interests located in this zip code:
ADMIRAL ARTHUR RADFORD HIGH SCHOOL (4361 SALT LAKE BOULEVARD in HONOLULU, HI)
(Geographic Names Information System) COMPLIANCE ACTIVITY (Tracking inspections of insecticide, fungicide, and rodenticide, and toxic substances) (National Center for Education Statistics) - STATE ID-2-224 Organizations: HAWAII DEPT OF EDUCATION (SCHOOL DISTRICT)
ALIAMANU ELEMENTARY SCHOOL (3265 SALT LAKE BOULEVARD in HONOLULU, HI)
STATE MASTER (HEER-FRS) COMPLIANCE ACTIVITY (Tracking inspections of insecticide, fungicide, and rodenticide, and toxic substances) (National Center for Education Statistics) - STATE ID-2-203 Organizations: HAWAII DEPT OF EDUCATION (SCHOOL DISTRICT)
NIMITZ ELEMENTARY SCHOOL (520 MAIN ST in HONOLULU, HI)
(Geographic Names Information System) COMPLIANCE ACTIVITY (Tracking inspections of insecticide, fungicide, and rodenticide, and toxic substances) (National Center for Education Statistics) - STATE ID-2-221 Organizations: HAWAII DEPT OF EDUCATION (SCHOOL DISTRICT)
MAKALAPA ELEMENTARY SCHOOL, WEATHERED OIL MATERIAL (4435 SALT LAKE BOULEVARD in HONOLULU, HI)
(Geographic Names Information System) STATE MASTER (HEER-FRS) (National Center for Education Statistics) - STATE ID-2-215 Organizations: HAWAII DEPT OF EDUCATION (SCHOOL DISTRICT)
PEARL HARBOR KAI ELEMENTARY SCHOOL (1 C AVENUE in HONOLULU, HI)
(Geographic Names Information System) STATE MASTER (HEER-FRS) (National Center for Education Statistics) - STATE ID-2-223 Organizations: HAWAII DEPT OF EDUCATION (SCHOOL DISTRICT)
ALIAMANU INTERMEDIATE SCHOOL (3271 SALT LAKE BOULEVARD in HONOLULU, HI)
STATE MASTER (HEER-FRS) (National Center for Education Statistics) - STATE ID-2-204 Organizations: HAWAII DEPT OF EDUCATION (SCHOOL DISTRICT)
MOKULELE ELEMENTARY SCHOOL (250 AUPAKA STREET in HONOLULU, HI)
(Geographic Names Information System) (National Center for Education Statistics) - STATE ID-2-220 Organizations: HAWAII DEPT OF EDUCATION (SCHOOL DISTRICT)
MOANALUA HIGH SCHOOL (2825 ALA ILIMA STREET in HONOLULU, HI)
(Geographic Names Information System) (National Center for Education Statistics) - STATE ID-2-218 Organizations: HAWAII DEPT OF EDUCATION (SCHOOL DISTRICT)
HICKAM ELEMENTARY SCHOOL (825 MANZELMAN CIRCLE in HONOLULU, HI)
(Geographic Names Information System) (National Center for Education Statistics) - STATE ID-2-209 Organizations: HAWAII DEPT OF EDUCATION (SCHOOL DISTRICT)
PEARL HARBOR ELEMENTARY SCHOOL (1 MOANALUA RIDGE in HONOLULU, HI)
(Geographic Names Information System) (National Center for Education Statistics) - STATE ID-2-222 Organizations: HAWAII DEPT OF EDUCATION (SCHOOL DISTRICT)
SALT LAKE ELEMENTARY SCHOOL (1131 ALA LILIKOI STREET in HONOLULU, HI)
(Geographic Names Information System) (National Center for Education Statistics) - STATE ID-2-239 Organizations: HAWAII DEPT OF EDUCATION (SCHOOL DISTRICT)
COSTCO CENTER HOLDER (4380 LAWEHANA ST in HONOLULU, HI)
STATE MASTER (HEER-FRS) STATE MASTER (Hawaii environmental compliance and hazardous materials tracking) COMPLIANCE ACTIVITY (Tracking inspections of insecticide, fungicide, and rodenticide, and toxic substances) HAZARDOUS WASTE BIENNIAL REPORTER (Resource Conservation and Recovery Act (tracking hazardous waste)) (Resource Conservation and Recovery Act (tracking hazardous waste)) Organizations: COSTCO WHOLESALE CORP (CONTACT/OWNER)
Alternative names: COSTCO WHOLESALE NO 11, THE KENNEL SHOP
CHEVRON JET A FUEL PIPELINE (CHEVRON HONOLULU HARBOR TERMINAL in HONOLULU, HI)
(Integrated Compliance Information System) - ICIS-09-2001-0126, FORMAL ENFORCEMENT ACTION Business SIC classification: REFINED PETROLEUM PIPELINES Alternative names: CHEVRON HONOLULU HARBOR JET A FUEL PIPELINE
Housing units lacking complete plumbing facilities: 0.7% Housing units lacking complete kitchen facilities: 1.1%
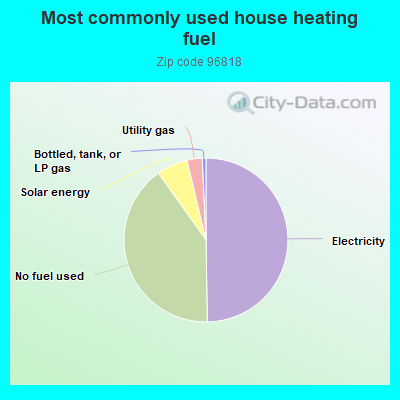
49.6%Electricity
40.3%No fuel used
6.1%Solar energy
3.0%Utility gas
0.7%Bottled, tank, or LP gas
Population in 1990: 62,915.
Place of birth for U.S.-born residents:
This state: 19,907
Northeast: 2,970
Midwest: 3,869
South: 10,410
West: 7,582
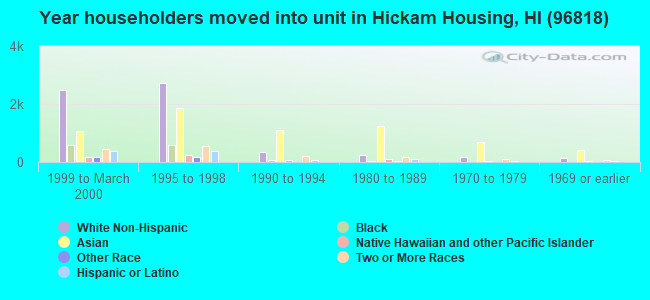
39% of the 96818 zip code residents lived in the same house 5 years ago. Out of people who lived in different houses, 40% lived in this county. Out of people who lived in different counties, 50% lived in Hawaii.
79% of the 96818 zip code residents lived in the same house 1 year ago. Out of people who lived in different houses, 36% moved from this county. Out of people who lived in different houses, 4% moved from different county within same state. Out of people who lived in different houses, 48% moved from different state. Out of people who lived in different houses, 9% moved from abroad.
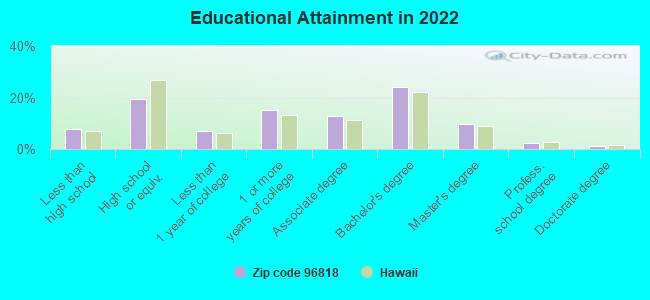
Private vs. public school enrollment:
Students in private schools in grades 1 to 8 (elementary and middle school): 1,980
Here:
26.5%
Hawaii:
21.6%
Students in private schools in grades 9 to 12 (high school): 250
Here:
9.8%
Hawaii:
21.5%
Students in private undergraduate colleges: 729
Here:
22.2%
Hawaii:
23.3%
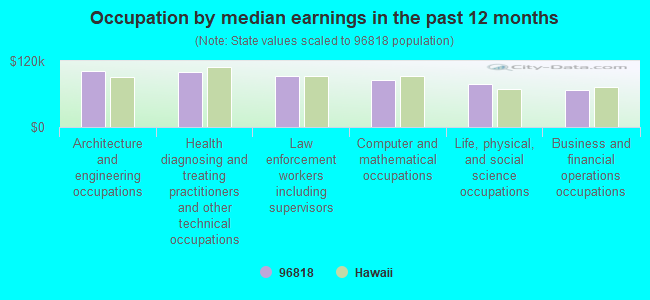
Occupation by median earnings in the past 12 months ($)
102,135Architecture and engineering occupations
100,683Health diagnosing and treating practitioners and other technical occupations
92,167Law enforcement workers including supervisors
86,033Computer and mathematical occupations
78,864Life, physical, and social science occupations
67,636Business and financial operations occupations
Companies with biggest federal contracts located in this zip code (HONOLULU, HI):
REFERENTIA SYSTEMS INCORPORATE (4429 MALAAI STREET, #104; small business) : $8,848,698 in 32 contractsfrom 2000 to 2006
Contracts for Other Defense -- Applied Research and Exploratory Development (R&D), Other Management Support Services, ADP Facility Operation and Maintenance Services, Other Research and Development -- Basic Research (R&D), and moreby Navy, Air Force, U.S. Army Corps of Engineers - civil program financing only, Army, and others Signed by year:2000: $69,856; 2001: $73,924; 2002: $691,157; 2003: $2,272,137; 2004: $2,241,679; 2005: $2,510,455; 2006: $989,490.
Biggest contracts:
$1,964,166 with Navy for Other Defense -- Applied Research and Exploratory Development (R&D). Signed on 2004-08-30. Completion date: 2006-08-29.
$1,949,952 with Navy for Other Management Support Services. Signed on 2003-09-27. Completion date: 2004-09-10.
$871,594 with Navy for ADP Facility Operation and Maintenance Services. Signed on 2005-08-03. Completion date: 2006-08-14.
$599,579 with Navy for Other Research and Development -- Basic Research (R&D). Signed on 2006-04-07. Completion date: 2006-06-07.
SHINCO MANAGEMENT, INC (1 CRATER RIM ROAD, BLDG #2; small business) : $1,777,166 in 48 contractsfrom 2000 to 2005
Contracts for Custodial Janitorial Services, Maintenance, Repair or Alteration of Real Property -- Miscellaneous Buildings, Maintenance, Repair or Alteration of Real Property -- Other Industrial Buildings, Maintenance, Repair or Alteration of Real Property -- Office Buildings, and moreby U.S. Coast Guard, Air Force Signed by year:2000: $17,940; 2001: $490,463; 2002: $152,583; 2003: $610,291; 2004: $216,460; 2005: $289,429; 2006: $0.
Biggest contracts:
$347,334 with U.S. Coast Guard for Custodial Janitorial Services. Signed on 2003-10-20. Completion date: 2004-09-30.
$211,598 with Air Force for Maintenance, Repair or Alteration of Real Property -- Miscellaneous Buildings. Signed on 2001-09-29. Completion date: 2001-09-28.
$180,907, same as above.Signed on 2001-09-29. Completion date: 2001-09-28.
$113,028 with Air Force for Maintenance, Repair or Alteration of Real Property -- Other Industrial Buildings. Signed on 2003-04-29. Completion date: 2003-06-30.
PAMELA BROOKS (5010 KAMEHAMEHA LOOP; small business) : $204,618 in 11 contractsfrom 2002 to 2006
Contracts for Dependent Medicare Services, Dentistry Services by Navy Signed by year:2000: $0; 2001: $0; 2002: $74,488; 2003: $103,980; 2004: $0; 2005: $56,230; 2006: -$30,080.
Biggest contracts:
$65,560 with Navy for Dependent Medicare Services. Signed on 2005-10-01. Completion date: 2006-09-30.
$56,676 with Navy for Dentistry Services. Taking place in VA. Signed on 2003-10-01. Completion date: 2004-09-30.
$54,288, same as above.Signed on 2002-10-01. Completion date: 2002-09-30.
$47,304 with Navy for Dentistry Services. Signed on 2003-12-01. Completion date: 2004-09-30.
ODALIS F PETERS (3158 ENGER STREET; small business) : $137,787 in 4 contractsfrom 2001 to 2004
$49,861 with Navy for Dentistry Services. Signed on 2002-10-01. Completion date: 2003-09-30.
$48,400, same as above.Signed on 2001-10-01. Completion date: 2006-01-21.
$32,400, same as above.Signed on 2001-01-10. Completion date: 2006-01-21.
$7,126, same as above.Signed on 2004-03-11. Completion date: 2004-09-30.
JOY M MATTHIES (3075 ALA POHA PLACE #2109; small business) : $130,770 in 3 contractsfrom 2001 to 2002
$46,452 with Army for Other Medical Services. Signed on 2002-11-25. Completion date: 2003-09-27.
$45,540, same as above.Signed on 2001-08-21. Completion date: 2003-09-27.
$38,778, same as above.Signed on 2001-03-14. Completion date: 2003-09-27.
CAROLYN WILLIAMS-SHELTON (719A HAWTHORNE PL; small business) : $125,464 in 3 contractsfrom 2000 to 2001
$48,024 with Navy for Dentistry Services. Signed on 2001-10-01. Completion date: 2001-09-30.
$45,760, same as above.Signed on 2000-11-15. Completion date: 2001-09-30.
$31,680, same as above.Signed on 2000-01-06. Completion date: 2005-01-21.
DIAMOND HEAD OFFICIALS ASSOCIT (7509 NANU ST APT D; small business)
$86,889 with Navy for Other Education and Training Services. Signed on 2004-10-01. Completion date: 2005-09-30.
GARCIA, EMILIA (3147 ENGAR ST; small business) : $63,804 in 3 contractsfrom 2004 to 2005
$27,144 with Navy for Dentistry Services. Signed on 2005-10-18. Completion date: 2004-09-30.
$26,100, same as above.Signed on 2004-11-19. Completion date: 2004-09-30.
$10,560, same as above.Signed on 2004-04-12. Completion date: 2004-09-30.
MELTON, JO (103B 20TH ST; small business)
$54,241 with Navy for Recreational Services. Signed on 1999-10-01. Completion date: 2000-09-30.
ED & DON''S OF HAWAII, INC (4462 MALAAI ST; small business) : $43,928 in 4 contractsfrom 2004 to 2005
$18,243 with Defense Commissary Agency for Food Items For Resale. Signed on 2004-10-01. Completion date: 2005-02-28.
$17,425, same as above.Signed on 2005-04-01. Completion date: 2005-08-31.
$7,015, same as above.Signed on 2005-01-01. Completion date: 2005-03-31.
$1,245, same as above.Signed on 2005-09-01. Completion date: 2005-09-30.
Top industries in this zip code by the number of employees in 2005:
2003 - 2018 National Fire Incident Reporting System (NFIRS) incidents
Based on the data from the years 2003 - 2018 the average number of fire incidents per year is 49. The highest number of fire incidents - 65 took place in 2007, and the least - 5 in 2003. The data has a rising trend.
When looking into fire subcategories, the most reports belonged to: Structure Fires (39.9%), and Outside Fires (37.9%).
Fire incident types reported to NFIRS in Zip Code 96818


 Nearest zip codes: 96853, 96860, 96859, 96819, 96782, 96706.


 Based on the data from the years 2003 - 2018 the average number of fire incidents per year is 49. The highest number of fire incidents - 65 took place in 2007, and the least - 5 in 2003. The data has a rising trend.
 When looking into fire subcategories, the most reports belonged to: Structure Fires (39.9%), and Outside Fires (37.9%).