Estimated zip code population in 2022: 30,413 Zip code population in 2010: 28,305 Zip code population in 2000: 24,894
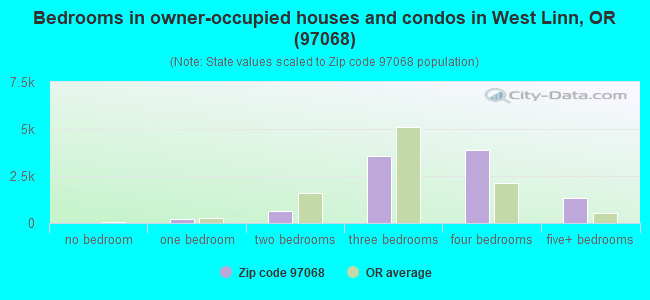
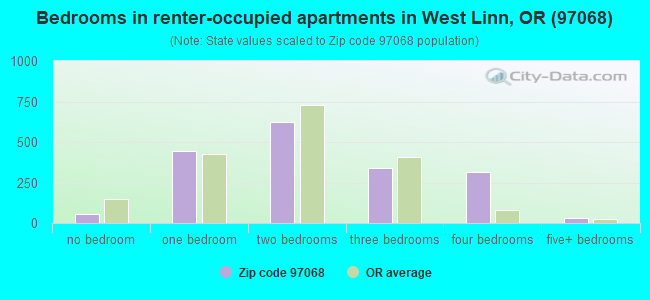
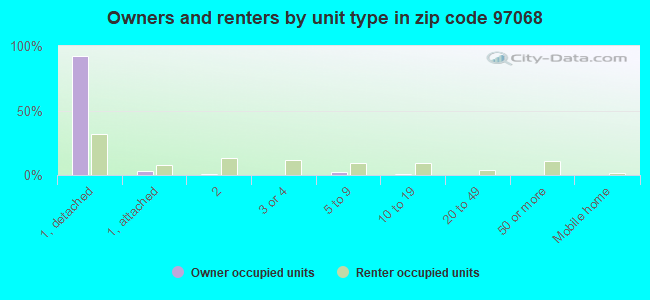
Houses and condos: 12,052 Renter-occupied apartments: 1,824
% of renters here:
16%
State:
37%
March 2022 cost of living index in zip code 97068: 104.4 (near average, U.S. average is 100)
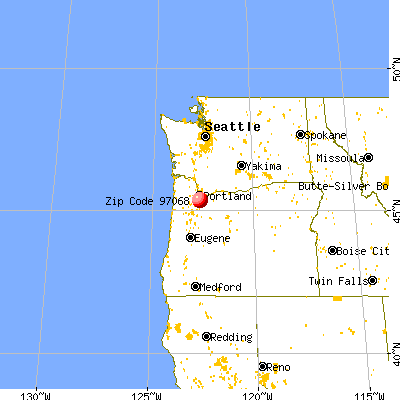
Land area: 22.5 sq. mi. Water area: 1.3 sq. mi.
Population density: 1,354 people per square mile
(low).
OSM Map
General Map
Google Map
MSN Map
OSM Map
General Map
Google Map
MSN Map
OSM Map
General Map
Google Map
MSN Map
OSM Map
General Map
Google Map
MSN Map
Please wait while loading the map...
Real estate property taxes paid for housing units in 2022:
This zip code:
0.9% ($7,429)
Oregon:
0.8% ($3,646)
Median real estate property taxes paid for housing units with mortgages in 2022: $7,586 (0.9%) Median real estate property taxes paid for housing units with no mortgage in 2022: $7,004 (1.0%)
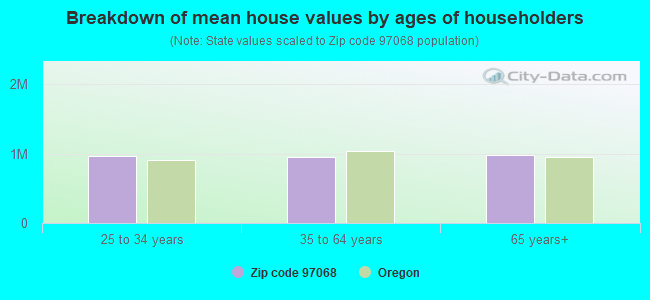
Estimated median house/condo value in 2022: $788,320
97068:
$788,320
Oregon:
$475,600
According to our research of Oregon and other state lists, there was 1 registered sex offender living in 97068 zip code as of April 26, 2024. The ratio of all residents to sex offenders in zip code 97068 is 29,903 to 1. The ratio of registered sex offenders to all residents in this zip code is much lower than the state average.
Median resident age:
This zip code:
45.6 years
Oregon median age:
40.5 years
Average household size:
This zip code:
2.6 people
Oregon:
2.4 people
Averages for the 2020 tax year for zip code 97068, filed in 2021:
Average Adjusted Gross Income (AGI) in 2020: $144,493 (Individual Income Tax Returns)
Here:
$144,493
State:
$76,001
Salary/wage: $111,207 (reported on 77.8% of returns)
Here:
$111,207
State:
$61,959
(% of AGI for various income ranges: 1211.8% for AGIs below $25k, 3399.4% for AGIs $25k-50k, 6365.5% for AGIs $50k-75k, 9149.6% for AGIs $75k-100k, 19390.5% for AGIs $100k-200k, 96447.6% for AGIs over 200k)
Taxable interest for individuals: $2,294 (reported on 52.5% of returns)
This zip code:
$2,294
Oregon:
$1,628
(% of AGI for various income ranges: 29.9% for AGIs below $25k, 58.6% for AGIs $25k-50k, 77.9% for AGIs $50k-75k, 117.2% for AGIs $75k-100k, 237.1% for AGIs $100k-200k, 1387.1% for AGIs over 200k)
Ordinary dividends: $10,017 (reported on 37.8% of returns)
Here:
$10,017
State:
$7,165
(% of AGI for various income ranges: 69.7% for AGIs below $25k, 130.8% for AGIs $25k-50k, 220.1% for AGIs $50k-75k, 303.3% for AGIs $75k-100k, 669.5% for AGIs $100k-200k, 4810.7% for AGIs over 200k)
Net capital gain/loss in AGI: +$41,310 (reported on 35.8% of returns)
Here:
+$41,310
State:
+$23,403
(% of AGI for various income ranges: 30.6% for AGIs below $25k, 103.1% for AGIs $25k-50k, 203.2% for AGIs $50k-75k, 345.4% for AGIs $75k-100k, 1117.0% for AGIs $100k-200k, 25546.0% for AGIs over 200k)
Profit/loss from business: +$26,255 (reported on 19.1% of returns)
Here:
+$26,255
State:
+$16,511
(% of AGI for various income ranges: 121.7% for AGIs below $25k, 293.2% for AGIs $25k-50k, 457.8% for AGIs $50k-75k, 429.6% for AGIs $75k-100k, 1076.7% for AGIs $100k-200k, 5380.6% for AGIs over 200k)
Taxable individual retirement arrangement distribution: $30,791 (reported on 13.9% of returns)
97068:
$30,791
Oregon:
$20,730
(% of AGI for various income ranges: 93.6% for AGIs below $25k, 226.8% for AGIs $25k-50k, 444.3% for AGIs $50k-75k, 711.8% for AGIs $75k-100k, 1297.6% for AGIs $100k-200k, 3324.7% for AGIs over 200k)
Self-employed (Keogh) retirement plans: $24,783 (reported on 2.1% of returns)
97068:
$24,783
Oregon:
$22,884
(% of AGI for various income ranges: 43.1% for AGIs $50k-75k, 87.4% for AGIs $100k-200k, 769.3% for AGIs over 200k)
Total itemized deductions: $34,540 (reported on 27.6% of returns)
Here:
$34,540
State:
$31,050
(% of AGI for various income ranges: 190.3% for AGIs below $25k, 405.1% for AGIs $25k-50k, 895.6% for AGIs $50k-75k, 1272.8% for AGIs $75k-100k, 2334.8% for AGIs $100k-200k, 9406.0% for AGIs over 200k)
Charity contributions: $8,788 (reported on 23.0% of returns)
Here:
$8,788
State:
$8,791
(% of AGI for various income ranges: 9.4% for AGIs below $25k, 35.2% for AGIs $25k-50k, 96.6% for AGIs $50k-75k, 127.9% for AGIs $75k-100k, 364.4% for AGIs $100k-200k, 2763.3% for AGIs over 200k)
Taxes paid: $9,389 (reported on 27.3% of returns)
97068:
$9,389
State:
$8,487
(% of AGI for various income ranges: 41.2% for AGIs below $25k, 100.0% for AGIs $25k-50k, 275.3% for AGIs $50k-75k, 460.9% for AGIs $75k-100k, 729.3% for AGIs $100k-200k, 2162.6% for AGIs over 200k)
Earned income credit: $1,599 (reported on 5.2% of returns)
Here:
$1,599
State:
$1,977
(% of AGI for various income ranges: 36.5% for AGIs below $25k, 35.3% for AGIs $25k-50k)
Percentage of individuals using paid preparers for their 2020 taxes: 93.0%
Here:
93%
State:
93%
(% for various income ranges: 90.7% for AGIs below $25k, 93.6% for AGIs $25k-50k, 91.9% for AGIs $50k-75k, 93.0% for AGIs $75k-100k, 93.5% for AGIs $100k-200k, 95.2% for AGIs over 200k)
Averages for the 2012 tax year for zip code 97068, filed in 2013:
Average Adjusted Gross Income (AGI) in 2012: $109,075 (Individual Income Tax Returns)
Here:
$109,075
State:
$57,845
Salary/wage: $88,989 (reported on 81.2% of returns)
Here:
$88,989
State:
$47,723
(% of AGI for various income ranges: 69.5% for AGIs below $25k, 72.2% for AGIs $25k-50k, 69.2% for AGIs $50k-75k, 66.6% for AGIs $75k-100k, 72.9% for AGIs $100k-200k, 61.0% for AGIs over 200k)
Taxable interest for individuals: $2,888 (reported on 47.6% of returns)
This zip code:
$2,888
Oregon:
$1,848
(% of AGI for various income ranges: 2.3% for AGIs below $25k, 1.1% for AGIs $25k-50k, 0.9% for AGIs $50k-75k, 0.9% for AGIs $75k-100k, 0.7% for AGIs $100k-200k, 1.7% for AGIs over 200k)
Ordinary dividends: $6,722 (reported on 35.4% of returns)
Here:
$6,722
State:
$5,987
(% of AGI for various income ranges: 4.3% for AGIs below $25k, 2.0% for AGIs $25k-50k, 2.0% for AGIs $50k-75k, 2.0% for AGIs $75k-100k, 1.5% for AGIs $100k-200k, 2.5% for AGIs over 200k)
Net capital gain/loss in AGI: +$16,186 (reported on 32.6% of returns)
Here:
+$16,186
State:
+$13,095
(% of AGI for various income ranges: 0.6% for AGIs $25k-50k, 0.9% for AGIs $50k-75k, 0.7% for AGIs $75k-100k, 1.5% for AGIs $100k-200k, 8.9% for AGIs over 200k)
Profit/loss from business: +$24,281 (reported on 19.5% of returns)
Here:
+$24,281
State:
+$13,871
(% of AGI for various income ranges: 9.1% for AGIs below $25k, 4.5% for AGIs $25k-50k, 5.1% for AGIs $50k-75k, 4.0% for AGIs $75k-100k, 4.5% for AGIs $100k-200k, 3.9% for AGIs over 200k)
Taxable individual retirement arrangement distribution: $23,337 (reported on 14.7% of returns)
97068:
$23,337
Oregon:
$16,036
(% of AGI for various income ranges: 5.4% for AGIs below $25k, 4.4% for AGIs $25k-50k, 3.8% for AGIs $50k-75k, 5.3% for AGIs $75k-100k, 3.6% for AGIs $100k-200k, 2.2% for AGIs over 200k)
Self-employment retirement plans: $22,639 (reported on 2.1% of returns)
97068:
$22,639
Oregon:
$19,462
(% of AGI for various income ranges: 0.6% for AGIs $50k-75k, 0.4% for AGIs $100k-200k, 0.6% for AGIs over 200k)
Total itemized deductions: $35,611 (22% of AGI, reported on 59.3% of returns)
Here:
$35,611
State:
$24,430
Here:
21.8% of AGI
State:
23.2% of AGI
(% of AGI for various income ranges: 22.3% for AGIs below $25k, 18.1% for AGIs $25k-50k, 21.6% for AGIs $50k-75k, 23.0% for AGIs $75k-100k, 21.2% for AGIs $100k-200k, 17.3% for AGIs over 200k)
Charity contributions: $4,538 (reported on 52.2% of returns)
Here:
$4,538
State:
$3,648
(% of AGI for various income ranges: 1.5% for AGIs below $25k, 1.4% for AGIs $25k-50k, 1.9% for AGIs $50k-75k, 2.3% for AGIs $75k-100k, 2.1% for AGIs $100k-200k, 2.3% for AGIs over 200k)
Taxes paid: $17,497 (reported on 58.6% of returns)
97068:
$17,497
State:
$10,269
(% of AGI for various income ranges: 5.2% for AGIs below $25k, 5.2% for AGIs $25k-50k, 7.6% for AGIs $50k-75k, 9.0% for AGIs $75k-100k, 10.1% for AGIs $100k-200k, 10.1% for AGIs over 200k)
Earned income credit: $1,775 (reported on 7.3% of returns)
Here:
$1,775
State:
$2,021
(% of AGI for various income ranges: 3.3% for AGIs below $25k, 0.7% for AGIs $25k-50k)
Percentage of individuals using paid preparers for their 2012 taxes: 51.9%
Here:
52%
State:
47%
(% for various income ranges: 39.8% for AGIs below $25k, 44.8% for AGIs $25k-50k, 54.8% for AGIs $50k-75k, 56.8% for AGIs $75k-100k, 56.8% for AGIs $100k-200k, 71.5% for AGIs over 200k)
Averages for the 2004 tax year for zip code 97068, filed in 2005:
Average Adjusted Gross Income (AGI) in 2004: $92,799 (Individual Income Tax Returns)
Here:
$92,799
State:
$46,788
Salary/wage: $75,005 (reported on 81.9% of returns)
Here:
$75,005
State:
$39,788
(% of AGI for various income ranges: 2284.2% for AGIs below $10k, 63.9% for AGIs $10k-25k, 74.2% for AGIs $25k-50k, 73.9% for AGIs $50k-75k, 78.3% for AGIs $75k-100k, 61.7% for AGIs over 100k)
Taxable interest for individuals: $3,006 (reported on 58.9% of returns)
This zip code:
$3,006
Oregon:
$2,126
(% of AGI for various income ranges: 316.1% for AGIs below $10k, 4.0% for AGIs $10k-25k, 2.2% for AGIs $25k-50k, 1.5% for AGIs $50k-75k, 1.0% for AGIs $75k-100k, 1.8% for AGIs over 100k)
Taxable dividends: $3,707 (reported on 41.7% of returns)
Here:
$3,707
State:
$3,427
(% of AGI for various income ranges: 249.5% for AGIs below $10k, 3.7% for AGIs $10k-25k, 1.9% for AGIs $25k-50k, 1.5% for AGIs $50k-75k, 1.2% for AGIs $75k-100k, 1.5% for AGIs over 100k)
Net capital gain/loss: +$26,470 (reported on 38.0% of returns)
Here:
+$26,470
State:
+$12,447
(% of AGI for various income ranges: 571.1% for AGIs below $10k, 0.7% for AGIs $10k-25k, 1.2% for AGIs $25k-50k, 1.4% for AGIs $50k-75k, 1.5% for AGIs $75k-100k, 14.4% for AGIs over 100k)
Profit/loss from business: +$21,853 (reported on 18.7% of returns)
Here:
+$21,853
State:
+$11,682
(% of AGI for various income ranges: -2.9% for AGIs below $10k, 9.2% for AGIs $10k-25k, 5.1% for AGIs $25k-50k, 4.3% for AGIs $50k-75k, 3.9% for AGIs $75k-100k, 4.3% for AGIs over 100k)
IRA payment deduction: $3,390 (reported on 4.0% of returns)
97068:
$3,390
Oregon:
$3,035
(% of AGI for various income ranges: 14.5% for AGIs below $10k, 0.3% for AGIs $10k-25k, 0.4% for AGIs $25k-50k, 0.3% for AGIs $50k-75k, 0.2% for AGIs $75k-100k, 0.1% for AGIs over 100k)
Self-employed pension: $16,024 (reported on 2.7% of returns)
Here:
$16,024
Oregon:
$14,224
(% of AGI for various income ranges: 0.2% for AGIs $25k-50k, 0.3% for AGIs $50k-75k, 0.3% for AGIs $75k-100k, 0.6% for AGIs over 100k)
Total itemized deductions: $30,236 (22% of AGI, reported on 61.2% of returns)
Here:
$30,236
State:
$20,209
Here:
21.6% of AGI
State:
24.7% of AGI
(% of AGI for various income ranges: 600.0% for AGIs below $10k, 25.0% for AGIs $10k-25k, 23.6% for AGIs $25k-50k, 25.7% for AGIs $50k-75k, 25.4% for AGIs $75k-100k, 17.6% for AGIs over 100k)
Charity contributions deductions: $4,676 (3% of AGI, reported on 55.5% of returns)
Here:
$4,676
State:
$3,145
Here:
3.2% of AGI
State:
3.6% of AGI
(% of AGI for various income ranges: 38.4% for AGIs below $10k, 2.2% for AGIs $10k-25k, 2.4% for AGIs $25k-50k, 2.5% for AGIs $50k-75k, 2.5% for AGIs $75k-100k, 2.9% for AGIs over 100k)
Total tax: $18,333 (reported on 81.1% of returns)
97068:
$18,333
State:
$7,148
(% of AGI for various income ranges: 77.4% for AGIs below $10k, 5.0% for AGIs $10k-25k, 7.3% for AGIs $25k-50k, 8.4% for AGIs $50k-75k, 9.3% for AGIs $75k-100k, 19.1% for AGIs over 100k)
Earned income credit: $1,383 (reported on 5.7% of returns)
Here:
$1,383
State:
$1,605
Percentage of individuals using paid preparers for their 2004 taxes: 55.0%
Here:
55%
State:
53%
(% for various income ranges: 44.1% for AGIs below $10k, 47.8% for AGIs $10k-25k, 53.0% for AGIs $25k-50k, 56.3% for AGIs $50k-75k, 55.8% for AGIs $75k-100k, 67.1% for AGIs over 100k)
Likely homosexual households (counted as self-reported same-sex unmarried-partner households)
Lesbian couples: 0.1% of all households
Gay men: 0.0% of all households
Household received Food Stamps/SNAP in the past 12 months: 357 Household did not receive Food Stamps/SNAP in the past 12 months: 10,984
Women who had a birth in the past 12 months: 282 (283 now married, 0 unmarried) Women who did not have a birth in the past 12 months: 5,808 (3,260 now married, 2,489 unmarried)
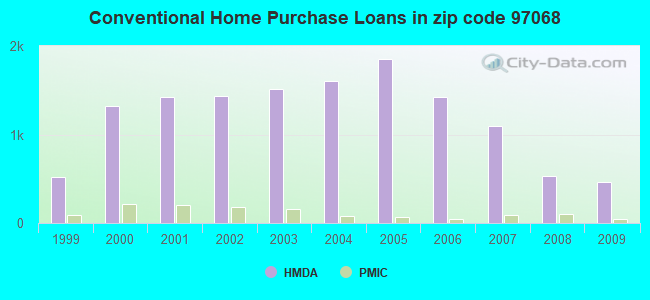
Housing units in zip code 97068 with a mortgage: 6,707 (899 second mortgage, 31 home equity loan, 829 both second mortgage and home equity loan) Houses without a mortgage: 161
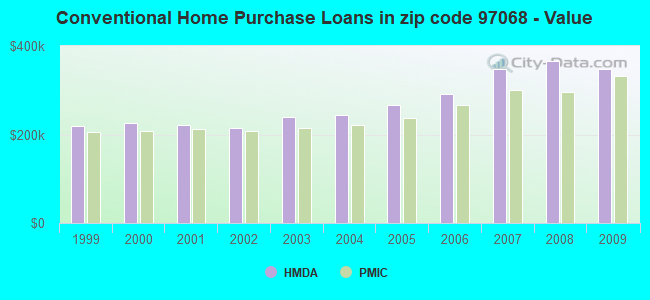
Median monthly owner costs for units with a mortgage: $2,995 Median monthly owner costs for units without a mortgage: $964
Residents with income below the poverty level in 2022:
This zip code:
5.7%
Whole state:
12.1%
Residents with income below 50% of the poverty level in 2022:
This zip code:
2.1%
Whole state:
6.2%
Median number of rooms in houses and condos:
Here:
8.0
State:
6.2
Median number of rooms in apartments:
Here:
4.3
State:
4.0
Notable locations in this zip code not listed on our city pages
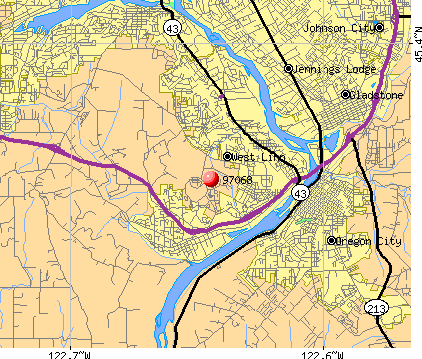
Notable locations in zip code 97068: Hebb Park Boat Ramp (A), Emmanuel United Presbyterian Church Park and Ride (B), Wankers Corner (C), Lake Oswego Water Treatment Plant (D), Bingham Landing (E), Cedaroak Boat Ramp (F), Bernert Landing Boat Ramp (G), Hazelia (H), Willamette Falls Viewpoint (I), McLean House (J), Tualatin Valley Fire and Rescue Station 359 Sunset (K), West Linn City Hall (L), West Linn Municipal Court (M), West Linn Public Library (N), West Linn Public Works (O), Willamette Falls Locks and Museum (P), Tualatin Valley Fire and Rescue Station 23 Robinhood (Q), Tualatin Valley Fire and Rescue Station 358 Rosemont (R), Tualatin Valley Fire and Rescue Station 59 Willamette (S), Tualatin Valley Fire and Rescue Station 58 West Linn Bolton (T). Display/hide their locations on the map
Churches in zip code 97068 include: Truth in Love Ministries (A), West Linn Lutheran Church (B), Willamette Christian Church (C), Emmanuel Presbyterian Church (D), Holy Spirit Association for the Unification of the World (E), New Life Church (F), Cambodian Buddhist Society of Oregon (G), Beit Haverim (H), Willamette United Methodist Church (I). Display/hide their locations on the map
Rivers and creeks: Tualatin River (A), Clackamas River (B), Fields Creek (C), Pecan Creek (D), Petes Mountain Creek (E), Shipley Creek (F), Wilson Creek (G), Tanner Creek (H). Display/hide their locations on the map
Parks in zip code 97068 include: West Bridge Park (1), Bottom School Park (2), Burns Island Park (3), West Bridge Park (4), Hammerle Park (5), Wilderness Park (6), Sunset Park (7), Camassia Conservancy (8), Hebb County Park (9). Display/hide their locations on the map
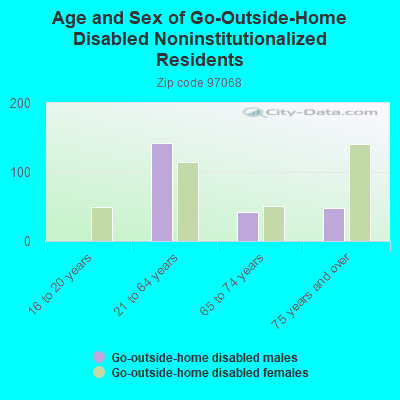
In group quarters: 252 (-1 institutionalized population)
Size of family households: 3,668 2-persons, 1,671 3-persons, 2,113 4-persons, 723 5-persons, 149 6-persons, 83 7-or-more-persons
Size of nonfamily households: 2,401 1-person, 499 2-persons, 39 3-persons
6,265 married couples with children.
791 single-parent households (48 men, 743 women).
89.3% of residents of 97068 zip code speak English at home.
1.7% of residents speak Spanish at home (82% very well, 16% well, 2% not well, 1% not at all).
4.2% of residents speak other Indo-European language at home (81% very well, 15% well, 2% not well, 1% not at all).
3.9% of residents speak Asian or Pacific Island language at home (40% very well, 36% well, 17% not well, 7% not at all).
0.5% of residents speak other language at home (83% very well, 2% well, 15% not well).
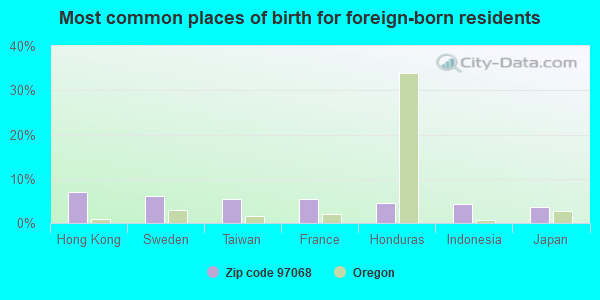
Foreign born population: 2,793 (9.2%) (65.4% of them are naturalized citizens)
This zip code:
9.2%
Whole state:
9.9%
7%Hong Kong
6%Sweden
5%Taiwan
5%France
4%Honduras
4%Indonesia
4%Japan
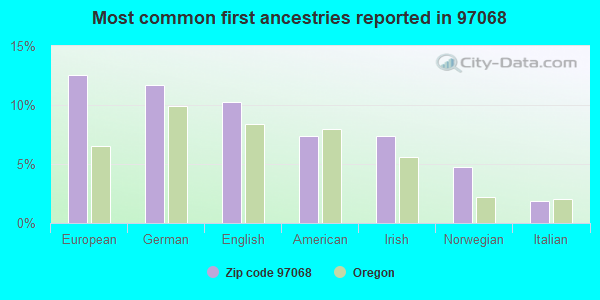
13%European
12%German
10%English
7%American
7%Irish
5%Norwegian
2%Italian
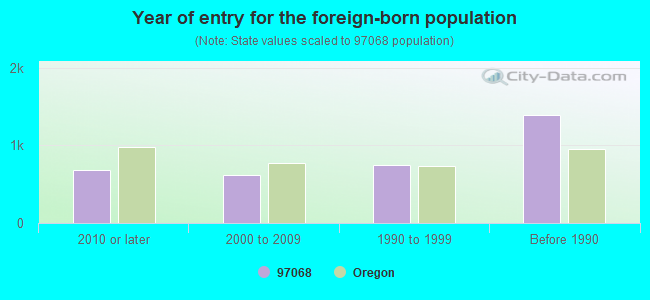
Year of entry for the foreign-born population
6882010 or later
6162000 to 2009
7441990 to 1999
1,391Before 1990
Facilities with environmental interests located in this zip code:
CIRCLE K STORE 30073 (22805 WILLAMETTE DRIVE in W LINN, OR)
STATE MASTER (Oregon inspections and permits database) - OR-LUST-03-89-0132, LEAKING STORAGE TANK, OR-UST-AHCEC, OR-UST-AHCED, OR-UST-AHCEE, OR-UST-AHCEF, OR-HWMS-4090, CESQG Conditionally Exempt Small Quantity Generators, less than 100 kg/month of hazardous waste (Resource Conservation and Recovery Act (tracking hazardous waste)) - notification Business SIC classification: GASOLINE SERVICE STATIONS Organizations: TOSCO MARKETING CO (CONTACT/ HAZARDOUS WASTE)
, TOSCO MARKETING COMPANY (CONTACT/ HAZARDOUS WASTE)
, CONOCOPHILLIPS CO (CONTACT/ HAZARDOUS WASTE)
, B P SERVICE STATION #11037 (CONTACT/ HAZARDOUS WASTE)
, BP OIL SITE 11005 WILLAMETTE DR (CONTACT/ HAZARDOUS WASTE)
, CIRCLE K INC. (CONTACT/GENERAL)
, TOSCO MARKETING, CIRCLE K, DC-36 (CONTACT/GENERAL)
, BP OIL COMPANY (CONTACT/GENERAL)
, MOBIL OIL CORP (CONTACT/GENERAL)
, CONOCOPHILLIPS COMPANY (CONTACT/OPERATOR)
, CONOCOPHILLIPSCOMPANY (CONTACT/OWNER)
, TOSCO MARKETING COMPANY (HAZARDOUS WASTE LAND OWNER)
, OREGON DEPARTMENT OF TRANSPORTATION ENVI (HAZARDOUS WASTE LAND OWNER)
, CONOCOPHILLIPS COMPANY (HAZARDOUS WASTE LEGAL OWNER)
, TOSCO MARKETING COMPANY (HAZARDOUS WASTE LEGAL OWNER)
, BP OIL SITE 11005 WILLAMETTE DR (HAZARDOUS WASTE LEGAL OWNER)
, THE CIRCLE K COMPANY A DIVISION OF TOSCO (HAZARDOUS WASTE OPERATOR)
, CIRCLE K STORE 30073 DBA BP OIL (HAZARDOUS WASTE OPERATOR)
, CONOCOPHILLIPS COMPANY (HAZARDOUS WASTE OPERATOR)
, TOSCO MARKETING CO (HAZARDOUS WASTE SITE CONTACT)
, CIRCLE K STORE 30073 DBA BP OIL (HAZARDOUS WASTE SITE CONTACT)
Alternative names: BP OIL SITE 11005 WILLAMETTE DR, CONOCOPHILLIPS COMPANY - 2611005
BEAVERTON DANCE CENTER (2631 MARYLHURST DR in WEST LINN, OR)
STATE MASTER (Oregon inspections and permits database) - HWMS-4583-, CESQG (Resource Conservation and Recovery Act (tracking hazardous waste)) Business SIC classification: DANCE STUDIOS, SCHOOLS, AND HALLS Organizations: CATHERINE PARKER (CONTACT/OPERATOR)
ADVANCED DISPOSAL TECHNOLOGIES INC (1974 WILLAMETTE FALLS DR in W LINN, OR)
STATE MASTER (Oregon inspections and permits database) - OR-HWMS-3471, CESQG (Resource Conservation and Recovery Act (tracking hazardous waste)) Business SIC classification: SPECIAL TRADE CONTRACTORS Organizations: ADT (CONTACT/OWNER)
, HANDRIS REALTY (HAZARDOUS WASTE LAND OWNER)
CEDAR OAK PARK ELEM. SCHOOL (4515 S CEDAROAK DR in WEST LINN, OR)
COMPLIANCE ACTIVITY (Tracking inspections of insecticide, fungicide, and rodenticide, and toxic substances) (National Center for Education Statistics) - STATE ID-45 Organizations: WEST LINN - WILSONVILLE SCH DIST 03J (SCHOOL DISTRICT)
Alternative names: WEST LINN WILSONVILLE CEDAROAK PARK PRIM
ATHEY CREEK MIDDLE SCHOOL (2900 SW BORLAND RD in WEST LINN, OR)
(National Center for Education Statistics) - STATE ID-1287 Organizations: WEST LINN - WILSONVILLE SCH DIST 03J (SCHOOL DISTRICT)
BOLTON PRIMARY SCHOOL (5933 HOLMES ST in WEST LINN, OR)
(National Center for Education Statistics) - STATE ID-3455 Organizations: WEST LINN - WILSONVILLE SCH DIST 03J (SCHOOL DISTRICT)
CROWN ZELLERBACH CORP (400 MILL ST in W LINN, OR)
COMPLIANCE ACTIVITY (Tracking inspections of insecticide, fungicide, and rodenticide, and toxic substances)
FERGUSON RANCH INC (YORK RD 6 MI N OF CY in W LINN, OR)
COMPLIANCE ACTIVITY (Tracking inspections of insecticide, fungicide, and rodenticide, and toxic substances)
HAPPY HANGERS CLEANERS (19383 WILLAMETTE DR in WEST LINN, OR)
CRITERIA AND HAZARDOUS AIR POLLUTANT INVENTORY (Inventory of air pollution sources) Business SIC classification: POWER LAUNDRIES, FAMILY AND COMMERCIAL Business NAICS classification: DRYCLEANING AND LAUNDRY SERVICES (EXCEPT COIN-OPERATED).
Housing units lacking complete kitchen facilities: 0.4%
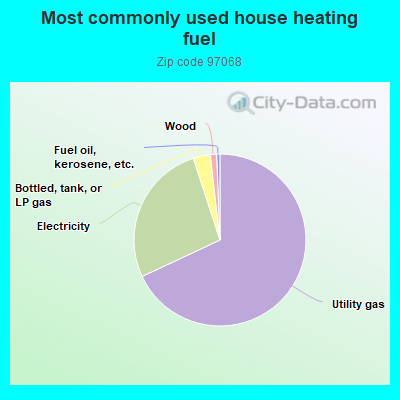
67.9%Utility gas
26.9%Electricity
3.2%Bottled, tank, or LP gas
1.2%Wood
0.6%Fuel oil, kerosene, etc.
Population in 1990: 19,962. Population change in the 1990s: +4,932 (+24.7%).
Place of birth for U.S.-born residents:
This state: 12,282
Northeast: 1,615
Midwest: 3,313
South: 1,766
West: 7,907
52% of the 97068 zip code residents lived in the same house 5 years ago. Out of people who lived in different houses, 43% lived in this county. Out of people who lived in different counties, 50% lived in Oregon.
90% of the 97068 zip code residents lived in the same house 1 year ago. Out of people who lived in different houses, 29% moved from this county. Out of people who lived in different houses, 39% moved from different county within same state. Out of people who lived in different houses, 29% moved from different state. Out of people who lived in different houses, 7% moved from abroad.
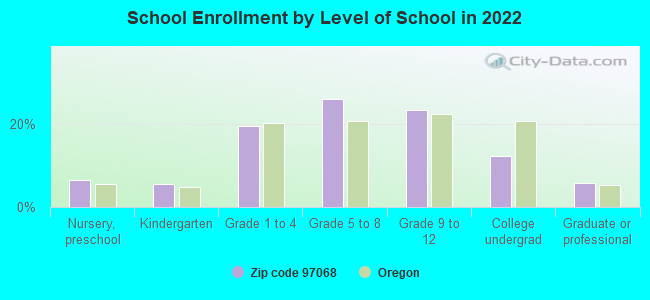
Private vs. public school enrollment:
Students in private schools in grades 1 to 8 (elementary and middle school): 316
Here:
8.7%
Oregon:
13.7%
Students in private schools in grades 9 to 12 (high school): 65
Here:
3.5%
Oregon:
8.8%
Students in private undergraduate colleges: 281
Here:
28.5%
Oregon:
17.7%
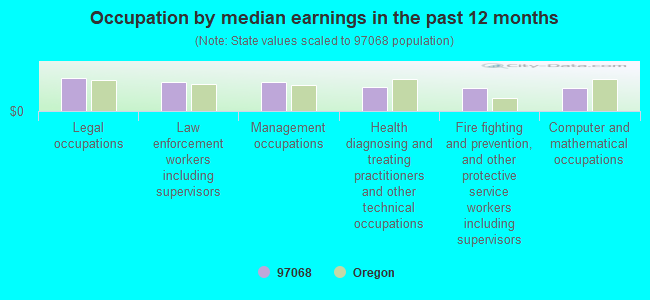
Occupation by median earnings in the past 12 months ($)
155,461Legal occupations
136,660Law enforcement workers including supervisors
133,274Management occupations
111,880Health diagnosing and treating practitioners and other technical occupations
107,754Fire fighting and prevention, and other protective service workers including supervisors
105,809Computer and mathematical occupations
Companies with federal contracts located in this zip code:
LRK ASSOCIATES INCORPORATED (6655 PALOMINO CIR in WEST LINN, OR; small business) : $915,156 in 5 contractsfrom 2005 to 2006
Contracts for Defense Missile and Space Systems -- Operational Systems Development (R&D), Weapons -- Management and Support (R&D), Weapons -- Basic Research (R&D) by Air Force Signed by year:2000: $0; 2001: $0; 2002: $0; 2003: $0; 2004: $0; 2005: $196,874; 2006: $718,282.
Biggest contracts:
$450,000 with Air Force for Defense Missile and Space Systems -- Operational Systems Development (R&D). Signed on 2006-05-17. Completion date: 2008-06-16.
$212,135 with Air Force for Weapons -- Management and Support (R&D). Signed on 2006-05-10. Completion date: 2007-05-12.
$99,732, same as above.Signed on 2005-05-26. Completion date: 2006-02-27.
$97,142 with Air Force for Weapons -- Basic Research (R&D). Signed on 2005-04-08. Completion date: 2006-04-15.
DODDS ENVIROTECH CORPORATION (19423 WILDERNESS DR in WEST LINN, OR; small business)
$40,213 with U.S. Army Corps of Engineers - civil program financing only for Construction of Structures and Facilities -- Other Industrial Buildings. Taking place in ID. Signed on 2000-07-10. Completion date: 2001-09-28.
Top industries in this zip code by the number of employees in 2005:
2002 - 2018 National Fire Incident Reporting System (NFIRS) incidents
According to the data from the years 2002 - 2018 the average number of fires per year is 60. The highest number of reported fire incidents - 117 took place in 2003, and the least - 9 in 2017. The data has a dropping trend.
When looking into fire subcategories, the most reports belonged to: Structure Fires (43.5%), and Outside Fires (39.8%).
Fire incident types reported to NFIRS in Zip Code 97068


 Nearest zip codes: 97034, 97267, 97027, 97035, 97062, 97222.


 According to the data from the years 2002 - 2018 the average number of fires per year is 60. The highest number of reported fire incidents - 117 took place in 2003, and the least - 9 in 2017. The data has a dropping trend.
 When looking into fire subcategories, the most reports belonged to: Structure Fires (43.5%), and Outside Fires (39.8%).