Estimated zip code population in 2022: 27,973 Zip code population in 2010: 24,126 Zip code population in 2000: 23,187
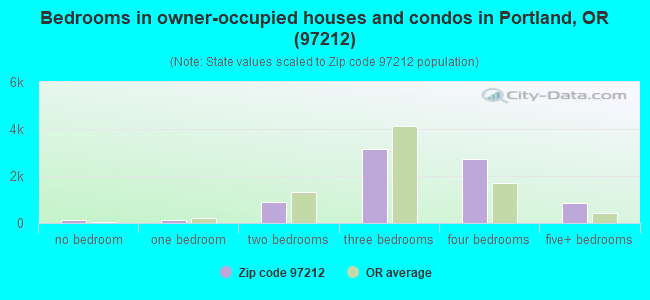
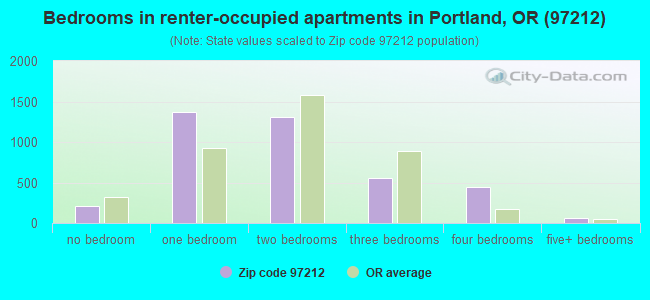
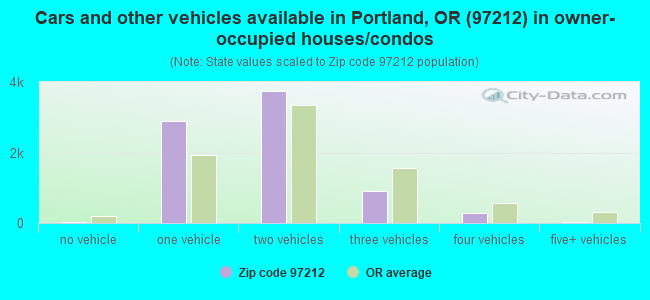
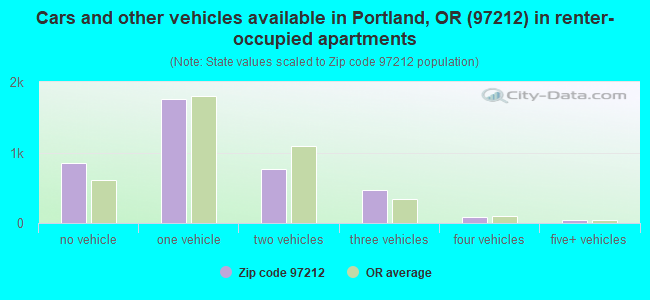
Houses and condos: 12,338 Renter-occupied apartments: 3,945
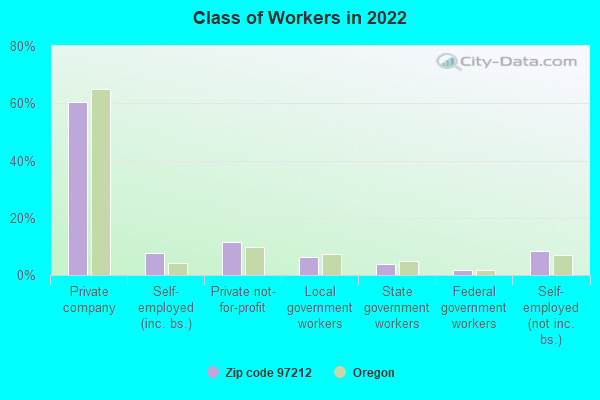
% of renters here:
33%
State:
37%
March 2022 cost of living index in zip code 97212: 105.5 (more than average, U.S. average is 100)
Land area: 2.7 sq. mi. Water area: 0.0 sq. mi.
Population density: 10,249 people per square mile
(high).
OSM Map
General Map
Google Map
MSN Map
OSM Map
General Map
Google Map
MSN Map
OSM Map
General Map
Google Map
MSN Map
OSM Map
General Map
Google Map
MSN Map
Please wait while loading the map...
Real estate property taxes paid for housing units in 2022:
This zip code:
0.9% ($7,736)
Oregon:
0.8% ($3,646)
Median real estate property taxes paid for housing units with mortgages in 2022: $7,759 (0.9%) Median real estate property taxes paid for housing units with no mortgage in 2022: $7,650 (0.8%)
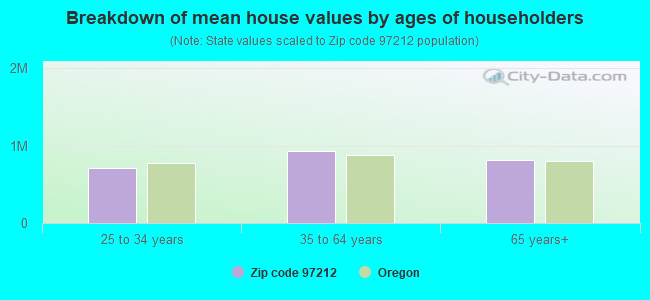
Estimated median house/condo value in 2022: $890,724
97212:
$890,724
Oregon:
$475,600
According to our research of Oregon and other state lists, there were 6 registered sex offenders living in 97212 zip code as of April 27, 2024. The ratio of all residents to sex offenders in zip code 97212 is 4,439 to 1. The ratio of registered sex offenders to all residents in this zip code is lower than the state average.
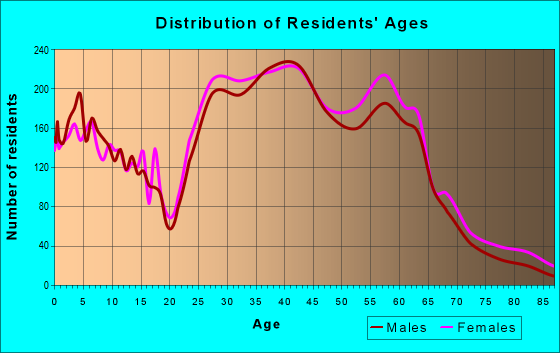
Median resident age:
This zip code:
41.7 years
Oregon median age:
40.5 years
Average household size:
This zip code:
2.4 people
Oregon:
2.4 people
Averages for the 2020 tax year for zip code 97212, filed in 2021:
Average Adjusted Gross Income (AGI) in 2020: $132,834 (Individual Income Tax Returns)
Here:
$132,834
State:
$76,001
Salary/wage: $109,102 (reported on 78.2% of returns)
Here:
$109,102
State:
$61,959
(% of AGI for various income ranges: 1152.6% for AGIs below $25k, 3585.4% for AGIs $25k-50k, 6417.0% for AGIs $50k-75k, 9605.0% for AGIs $75k-100k, 20021.4% for AGIs $100k-200k, 94359.0% for AGIs over 200k)
Taxable interest for individuals: $1,786 (reported on 51.3% of returns)
This zip code:
$1,786
Oregon:
$1,628
(% of AGI for various income ranges: 23.4% for AGIs below $25k, 35.6% for AGIs $25k-50k, 100.8% for AGIs $50k-75k, 109.1% for AGIs $75k-100k, 247.3% for AGIs $100k-200k, 885.9% for AGIs over 200k)
Ordinary dividends: $9,249 (reported on 40.1% of returns)
Here:
$9,249
State:
$7,165
(% of AGI for various income ranges: 83.2% for AGIs below $25k, 93.5% for AGIs $25k-50k, 246.1% for AGIs $50k-75k, 472.3% for AGIs $75k-100k, 909.6% for AGIs $100k-200k, 4088.1% for AGIs over 200k)
Net capital gain/loss in AGI: +$32,401 (reported on 36.4% of returns)
Here:
+$32,401
State:
+$23,403
(% of AGI for various income ranges: 56.0% for AGIs below $25k, 92.4% for AGIs $25k-50k, 214.8% for AGIs $50k-75k, 428.0% for AGIs $75k-100k, 1291.5% for AGIs $100k-200k, 18511.2% for AGIs over 200k)
Profit/loss from business: +$25,240 (reported on 22.1% of returns)
Here:
+$25,240
State:
+$16,511
(% of AGI for various income ranges: 186.4% for AGIs below $25k, 316.9% for AGIs $25k-50k, 630.8% for AGIs $50k-75k, 828.5% for AGIs $75k-100k, 1571.4% for AGIs $100k-200k, 4755.9% for AGIs over 200k)
Taxable individual retirement arrangement distribution: $26,524 (reported on 11.0% of returns)
97212:
$26,524
Oregon:
$20,730
(% of AGI for various income ranges: 51.2% for AGIs below $25k, 151.1% for AGIs $25k-50k, 309.5% for AGIs $50k-75k, 565.5% for AGIs $75k-100k, 1221.6% for AGIs $100k-200k, 1872.3% for AGIs over 200k)
Self-employed (Keogh) retirement plans: $24,712 (reported on 3.2% of returns)
97212:
$24,712
Oregon:
$22,884
(% of AGI for various income ranges: 9.9% for AGIs $25k-50k, 27.8% for AGIs $50k-75k, 51.1% for AGIs $75k-100k, 184.8% for AGIs $100k-200k, 1035.3% for AGIs over 200k)
Total itemized deductions: $32,756 (reported on 24.6% of returns)
Here:
$32,756
State:
$31,050
(% of AGI for various income ranges: 173.9% for AGIs below $25k, 240.7% for AGIs $25k-50k, 765.2% for AGIs $50k-75k, 1280.5% for AGIs $75k-100k, 2326.6% for AGIs $100k-200k, 7657.0% for AGIs over 200k)
Charity contributions: $7,550 (reported on 20.8% of returns)
Here:
$7,550
State:
$8,791
(% of AGI for various income ranges: 10.8% for AGIs below $25k, 23.4% for AGIs $25k-50k, 79.3% for AGIs $50k-75k, 128.6% for AGIs $75k-100k, 365.8% for AGIs $100k-200k, 1967.1% for AGIs over 200k)
Taxes paid: $9,344 (reported on 24.3% of returns)
97212:
$9,344
State:
$8,487
(% of AGI for various income ranges: 34.6% for AGIs below $25k, 67.6% for AGIs $25k-50k, 232.2% for AGIs $50k-75k, 438.5% for AGIs $75k-100k, 763.3% for AGIs $100k-200k, 1923.2% for AGIs over 200k)
Earned income credit: $1,353 (reported on 6.7% of returns)
Here:
$1,353
State:
$1,977
(% of AGI for various income ranges: 43.9% for AGIs below $25k, 19.6% for AGIs $25k-50k)
Percentage of individuals using paid preparers for their 2020 taxes: 93.7%
Here:
94%
State:
93%
(% for various income ranges: 91.4% for AGIs below $25k, 93.3% for AGIs $25k-50k, 94.3% for AGIs $50k-75k, 93.8% for AGIs $75k-100k, 94.0% for AGIs $100k-200k, 96.3% for AGIs over 200k)
Averages for the 2012 tax year for zip code 97212, filed in 2013:
Average Adjusted Gross Income (AGI) in 2012: $93,016 (Individual Income Tax Returns)
Here:
$93,016
State:
$57,845
Salary/wage: $74,294 (reported on 82.9% of returns)
Here:
$74,294
State:
$47,723
(% of AGI for various income ranges: 76.5% for AGIs below $25k, 77.2% for AGIs $25k-50k, 71.1% for AGIs $50k-75k, 71.3% for AGIs $75k-100k, 72.7% for AGIs $100k-200k, 57.6% for AGIs over 200k)
Taxable interest for individuals: $2,069 (reported on 45.5% of returns)
This zip code:
$2,069
Oregon:
$1,848
(% of AGI for various income ranges: 1.2% for AGIs below $25k, 0.7% for AGIs $25k-50k, 1.1% for AGIs $50k-75k, 1.0% for AGIs $75k-100k, 0.7% for AGIs $100k-200k, 1.2% for AGIs over 200k)
Ordinary dividends: $7,618 (reported on 35.8% of returns)
Here:
$7,618
State:
$5,987
(% of AGI for various income ranges: 3.2% for AGIs below $25k, 1.9% for AGIs $25k-50k, 2.7% for AGIs $50k-75k, 2.6% for AGIs $75k-100k, 2.1% for AGIs $100k-200k, 3.7% for AGIs over 200k)
Net capital gain/loss in AGI: +$19,274 (reported on 29.6% of returns)
Here:
+$19,274
State:
+$13,095
(% of AGI for various income ranges: 0.3% for AGIs below $25k, 0.8% for AGIs $25k-50k, 1.0% for AGIs $50k-75k, 1.5% for AGIs $75k-100k, 2.0% for AGIs $100k-200k, 11.9% for AGIs over 200k)
Profit/loss from business: +$24,444 (reported on 20.3% of returns)
Here:
+$24,444
State:
+$13,871
(% of AGI for various income ranges: 9.4% for AGIs below $25k, 7.5% for AGIs $25k-50k, 5.1% for AGIs $50k-75k, 5.4% for AGIs $75k-100k, 6.2% for AGIs $100k-200k, 4.1% for AGIs over 200k)
Taxable individual retirement arrangement distribution: $19,823 (reported on 10.4% of returns)
97212:
$19,823
Oregon:
$16,036
(% of AGI for various income ranges: 2.5% for AGIs below $25k, 2.8% for AGIs $25k-50k, 2.8% for AGIs $50k-75k, 2.3% for AGIs $75k-100k, 2.9% for AGIs $100k-200k, 1.5% for AGIs over 200k)
Self-employment retirement plans: $24,771 (reported on 2.9% of returns)
97212:
$24,771
Oregon:
$19,462
(% of AGI for various income ranges: 0.4% for AGIs below $25k, 0.3% for AGIs $50k-75k, 0.4% for AGIs $75k-100k, 0.9% for AGIs $100k-200k, 1.0% for AGIs over 200k)
Total itemized deductions: $32,043 (20% of AGI, reported on 50.2% of returns)
Here:
$32,043
State:
$24,430
Here:
20.4% of AGI
State:
23.2% of AGI
(% of AGI for various income ranges: 13.3% for AGIs below $25k, 12.8% for AGIs $25k-50k, 18.0% for AGIs $50k-75k, 20.3% for AGIs $75k-100k, 20.0% for AGIs $100k-200k, 16.0% for AGIs over 200k)
Charity contributions: $4,045 (reported on 43.9% of returns)
Here:
$4,045
State:
$3,648
(% of AGI for various income ranges: 0.9% for AGIs below $25k, 1.1% for AGIs $25k-50k, 1.6% for AGIs $50k-75k, 1.8% for AGIs $75k-100k, 1.9% for AGIs $100k-200k, 2.2% for AGIs over 200k)
Taxes paid: $16,440 (reported on 49.8% of returns)
97212:
$16,440
State:
$10,269
(% of AGI for various income ranges: 3.1% for AGIs below $25k, 4.2% for AGIs $25k-50k, 7.2% for AGIs $50k-75k, 9.1% for AGIs $75k-100k, 10.0% for AGIs $100k-200k, 9.6% for AGIs over 200k)
Earned income credit: $1,209 (reported on 9.9% of returns)
Here:
$1,209
State:
$2,021
(% of AGI for various income ranges: 2.6% for AGIs below $25k, 0.3% for AGIs $25k-50k)
Percentage of individuals using paid preparers for their 2012 taxes: 44.2%
Here:
44%
State:
47%
(% for various income ranges: 30.5% for AGIs below $25k, 34.7% for AGIs $25k-50k, 47.2% for AGIs $50k-75k, 50.4% for AGIs $75k-100k, 56.1% for AGIs $100k-200k, 73.8% for AGIs over 200k)
Averages for the 2004 tax year for zip code 97212, filed in 2005:
Average Adjusted Gross Income (AGI) in 2004: $66,745 (Individual Income Tax Returns)
Here:
$66,745
State:
$46,788
Salary/wage: $55,779 (reported on 83.7% of returns)
Here:
$55,779
State:
$39,788
(% of AGI for various income ranges: 110.4% for AGIs below $10k, 75.9% for AGIs $10k-25k, 79.5% for AGIs $25k-50k, 74.8% for AGIs $50k-75k, 79.6% for AGIs $75k-100k, 63.8% for AGIs over 100k)
Taxable interest for individuals: $1,666 (reported on 54.0% of returns)
This zip code:
$1,666
Oregon:
$2,126
(% of AGI for various income ranges: 5.9% for AGIs below $10k, 2.4% for AGIs $10k-25k, 1.5% for AGIs $25k-50k, 1.5% for AGIs $50k-75k, 1.0% for AGIs $75k-100k, 1.2% for AGIs over 100k)
Taxable dividends: $3,089 (reported on 39.2% of returns)
Here:
$3,089
State:
$3,427
(% of AGI for various income ranges: 7.7% for AGIs below $10k, 2.3% for AGIs $10k-25k, 1.8% for AGIs $25k-50k, 2.1% for AGIs $50k-75k, 1.7% for AGIs $75k-100k, 1.6% for AGIs over 100k)
Net capital gain/loss: +$11,361 (reported on 32.4% of returns)
Here:
+$11,361
State:
+$12,447
(% of AGI for various income ranges: -0.4% for AGIs below $10k, 1.2% for AGIs $10k-25k, 1.1% for AGIs $25k-50k, 1.4% for AGIs $50k-75k, 2.1% for AGIs $75k-100k, 8.4% for AGIs over 100k)
Profit/loss from business: +$18,510 (reported on 19.4% of returns)
Here:
+$18,510
State:
+$11,682
(% of AGI for various income ranges: 10.6% for AGIs below $10k, 7.0% for AGIs $10k-25k, 6.0% for AGIs $25k-50k, 6.1% for AGIs $50k-75k, 4.7% for AGIs $75k-100k, 5.0% for AGIs over 100k)
IRA payment deduction: $2,993 (reported on 3.7% of returns)
97212:
$2,993
Oregon:
$3,035
(% of AGI for various income ranges: 0.3% for AGIs below $10k, 0.4% for AGIs $10k-25k, 0.4% for AGIs $25k-50k, 0.2% for AGIs $50k-75k, 0.2% for AGIs $75k-100k, 0.1% for AGIs over 100k)
Self-employed pension: $16,131 (reported on 3.6% of returns)
Here:
$16,131
Oregon:
$14,224
(% of AGI for various income ranges: 0.2% for AGIs $10k-25k, 0.4% for AGIs $25k-50k, 0.6% for AGIs $50k-75k, 0.4% for AGIs $75k-100k, 1.2% for AGIs over 100k)
Total itemized deductions: $24,448 (23% of AGI, reported on 52.4% of returns)
Here:
$24,448
State:
$20,209
Here:
22.6% of AGI
State:
24.7% of AGI
(% of AGI for various income ranges: 26.4% for AGIs below $10k, 15.8% for AGIs $10k-25k, 18.2% for AGIs $25k-50k, 24.1% for AGIs $50k-75k, 24.1% for AGIs $75k-100k, 17.5% for AGIs over 100k)
Charity contributions deductions: $3,262 (3% of AGI, reported on 47.3% of returns)
Here:
$3,262
State:
$3,145
Here:
2.9% of AGI
State:
3.6% of AGI
(% of AGI for various income ranges: 1.3% for AGIs below $10k, 1.4% for AGIs $10k-25k, 1.8% for AGIs $25k-50k, 2.2% for AGIs $50k-75k, 2.3% for AGIs $75k-100k, 2.5% for AGIs over 100k)
Total tax: $12,450 (reported on 81.2% of returns)
97212:
$12,450
State:
$7,148
(% of AGI for various income ranges: 4.4% for AGIs below $10k, 5.2% for AGIs $10k-25k, 8.4% for AGIs $25k-50k, 10.2% for AGIs $50k-75k, 10.4% for AGIs $75k-100k, 19.5% for AGIs over 100k)
Earned income credit: $1,145 (reported on 9.1% of returns)
Here:
$1,145
State:
$1,605
Percentage of individuals using paid preparers for their 2004 taxes: 48.4%
Here:
48%
State:
53%
(% for various income ranges: 41.0% for AGIs below $10k, 40.3% for AGIs $10k-25k, 43.8% for AGIs $25k-50k, 52.4% for AGIs $50k-75k, 52.2% for AGIs $75k-100k, 64.4% for AGIs over 100k)
Likely homosexual households (counted as self-reported same-sex unmarried-partner households)
Lesbian couples: 0.6% of all households
Gay men: 0.6% of all households
Household received Food Stamps/SNAP in the past 12 months: 1,479 Household did not receive Food Stamps/SNAP in the past 12 months: 10,269
Women who had a birth in the past 12 months: 229 (182 now married, 47 unmarried) Women who did not have a birth in the past 12 months: 6,582 (2,572 now married, 4,018 unmarried)
Housing units in zip code 97212 with a mortgage: 5,338 (887 second mortgage, 29 home equity loan, 898 both second mortgage and home equity loan) Houses without a mortgage: 184
Median monthly owner costs for units with a mortgage: $3,019 Median monthly owner costs for units without a mortgage: $1,000
Residents with income below the poverty level in 2022:
This zip code:
6.5%
Whole state:
12.1%
Residents with income below 50% of the poverty level in 2022:
This zip code:
2.3%
Whole state:
6.2%
Median number of rooms in houses and condos:
Here:
7.6
State:
6.2
Median number of rooms in apartments:
Here:
3.9
State:
4.0
Notable locations in this zip code not listed on our city pages
Notable locations in zip code 97212: Russell Street Theatre (A), Albina Library (B), Child Service Center (C), Hollywood Library (D), Dishman Community Center (E). Display/hide their locations on the map
Churches in zip code 97212 include: The Morning Star Baptist Church (A), The Well Church (B), Victory Temple Church of God in Christ (C), Westminster Presbyterian Church (D), Christ Community Church (E), Youth for Christ (F), Church of Christ of Albina (G), Mount Zion Baptist Church (H), Mount Sinai Church of God in Christ (I). Display/hide their locations on the map
Parks in zip code 97212 include: Grant City Park (1), Wilshire City Park (2), Irving City Park (3), Klickitat Mall (4), Two Plum City Park (5). Display/hide their locations on the map
Tourist attractions (not listed on the city page) : Sams Hollywood Billiards (Amusement & Theme Parks; 1845 Northeast 41st Avenue), Bridge Pedal (Tours & Charters; 1631 Northeast Klickitat Street).
4,148 married couples with children.
1,108 single-parent households (91 men, 1,017 women).
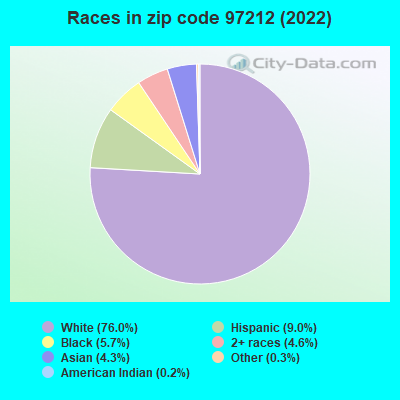
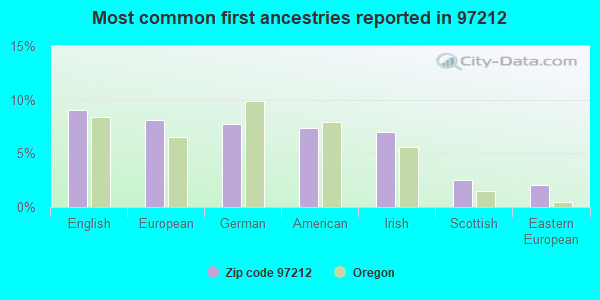
87.7% of residents of 97212 zip code speak English at home.
5.1% of residents speak Spanish at home (70% very well, 28% well, 2% not well).
4.8% of residents speak other Indo-European language at home (87% very well, 10% well, 3% not well).
1.8% of residents speak Asian or Pacific Island language at home (74% very well, 20% well, 6% not well).
0.3% of residents speak other language at home (79% very well, 21% well).
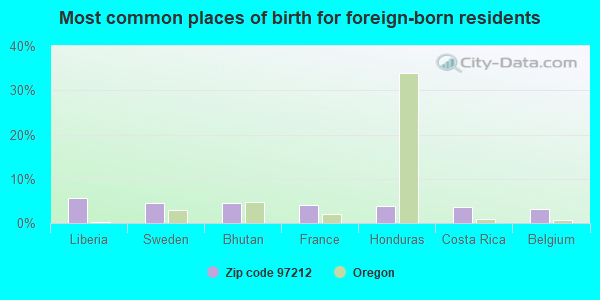
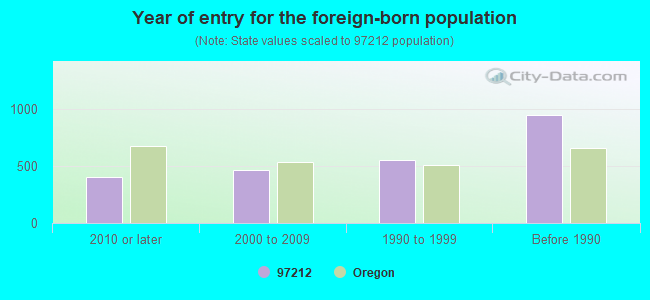
Foreign born population: 2,048 (7.3%) (76.6% of them are naturalized citizens)
Major facilities with environmental interests located in this zip code:
GRANT HIGH SCHOOL (2245 NORTHEAST 36TH AVENUE in PORTLAND, OR)
(Geographic Names Information System) (Integrated Compliance Information System) - ICIS-10-2001-0122, FORMAL ENFORCEMENT ACTION (National Center for Education Statistics) - STATE ID-912 STATE MASTER (Oregon inspections and permits database) - OR-HWMS-111, CESQG Conditionally Exempt Small Quantity Generators, less than 100 kg/month of hazardous waste (Resource Conservation and Recovery Act (tracking hazardous waste)) - notification Business SIC classification: ELEMENTARY AND SECONDARY SCHOOLS; VOCATIONAL SCHOOLS Business NAICS classification: FLIGHT TRAINING.; APPRENTICESHIP TRAINING.; OTHER TECHNICAL AND TRADE SCHOOLS.; OTHER TECHNICAL AND TRADE SCHOOLS. Organizations: MULTNOMAH COUNTY SCHOOL DISTRICT NO 1 (CONTACT/ HAZARDOUS WASTE)
, MULTNOMAH COUNTY SD 1 (CONTACT/OWNER)
, MULTNOMAH COUNTY SD #1 (HAZARDOUS WASTE OPERATOR)
, MULTNOMAH COUNTY SCHOOL DISTRICT NO 1 (HAZARDOUS WASTE OPERATOR)
, PORTLAND SCH DIST 1J (SCHOOL DISTRICT)
Alternative names: MULTNOMAH CO SD 1 GRANT HIGH SCHOOL, MULTNOMAH COUNTY SCHOOL DISTRICT NO 1, MULTNOMAH CO SD 1 GRANT HIGH SCHOOL, PTLD NIGHT HIGH SCHOOL AT GRANT
ALBINA COMM HOUSING LLC STANDARD DAIRY (2808 NORTHEAST MARTIN LUTHER KING JR BOULEVARD in PORTLAND, OR)
STATE MASTER (Oregon inspections and permits database) - OR-HWMS-192, CESQG STATE MASTER (Oregon inspections and permits database) - OR-LUST-26-98-0418, LEAKING STORAGE TANK STATE MASTER (Oregon inspections and permits database) - OR-ECSI-2055, SUPERFUND (Resource Conservation and Recovery Act (tracking hazardous waste)) Business SIC classification: GENERAL CONTRACTORS-INDUSTRIAL BUILDINGS AND WAREHOUSES Organizations: ALBINA COMMUNITY HOUSING LLC (CONTACT/ HAZARDOUS WASTE)
, WCR COMPANY (CONTACT/ HAZARDOUS WASTE)
, R& R ENERGY (CONTACT/GENERAL)
, ALBINA COMMUNITY HOUSING LLC (CONTACT/OWNER)
Alternative names: STANDARD DAIRY BLDG
ALAMEDA ELEMENTRY SCHOOL (2732 NORTH EAST FREMONT STREET in PORTLAND, OR)
(National Center for Education Statistics) - STATE ID-824 STATE MASTER (Oregon inspections and permits database) - OR-ACSIS-262623, AIR PROGRAM, OR-HWMS-4210, CESQG, ACSIS-262623-, AIR PROGRAM Conditionally Exempt Small Quantity Generators, less than 100 kg/month of hazardous waste (Resource Conservation and Recovery Act (tracking hazardous waste)) - notification Business SIC classification: STEAM AND AIR-CONDITIONING SUPPLY; ELEMENTARY AND SECONDARY SCHOOLS Organizations: MULTNOMAH COUNTY SCHOOL DISTRICT NO 1 (CONTACT/ HAZARDOUS WASTE)
, MULTNOMAH CO. SCHOOL DIST. NO. 1 (CONTACT/GENERAL)
, MULTNOMAH COUNTY SD 1 (CONTACT/OPERATOR)
, MULTNOMAH COUNTY SD #1 (HAZARDOUS WASTE SITE CONTACT)
, MULTNOMAH COUNTY SCHOOL DISTRICT NO 1 (HAZARDOUS WASTE SITE CONTACT)
, PORTLAND SCH DIST 1J (SCHOOL DISTRICT)
Alternative names: ALAMEDA ELEMENTARY SCHOOL, MULTNOMAH CO SD 1 ALAMEDA SCHOOL, MULTNOMAH CO SD 1 ALAMEDA SCHOOL
COVERALL UNIFORM SUPPLY (2522 NE M L KING BLVD in PORTLAND, OR)
STATE MASTER (Oregon inspections and permits database) - ECSI-1775-, SUPERFUND, LUST-26-92-0213-, LEAKING STORAGE TANK STATE MASTER (Oregon inspections and permits database) - OR-ECSI-1775, SUPERFUND, OR-LUST-26-92-0213, LEAKING STORAGE TANK (Resource Conservation and Recovery Act (tracking hazardous waste)) Business SIC and NAICS classification: LINEN SUPPLY Organizations: DENNIS WALKER (CONTACT/OPERATOR)
Alternative names: CINTAS CORP OF OHIO, WALKER DENNIS COVERALL UNIFORM SUPPLY
FRED MEYER PDX HOLLYWOOD WEST (3030 NORTHEAST WEIDLER STREET in PORTLAND, OR)
STATE MASTER (Oregon inspections and permits database) - OR-HWMS-3902, CESQG (Resource Conservation and Recovery Act (tracking hazardous waste)) Business SIC classification: DEPARTMENT STORES; GROCERY STORES Organizations: FRED MEYER STORES INC (CONTACT/ HAZARDOUS WASTE)
, RONALD BENDERSON 1995 TRUST (HAZARDOUS WASTE LAND OWNER)
, BENESON CAPITOL COMPANY (HAZARDOUS WASTE LAND OWNER)
, FRED MEYER STORES INC (HAZARDOUS WASTE LEGAL OWNER)
Alternative names: FRED MEYER INC
AUGUST WEST & CO (3974 NE GRAND AVE in PORTLAND, OR)
STATE MASTER (Oregon inspections and permits database) - HWMS-5218-, CESQG Conditionally Exempt Small Quantity Generators, less than 100 kg/month of hazardous waste (Resource Conservation and Recovery Act (tracking hazardous waste)) - notification Business SIC classification: PAINTING AND PAPER HANGING
GRAFFITI REMOVAL A JANUS YOUTH PROGRAM (1704 NE 26TH AVE in PORTLAND, OR)
STATE MASTER (Oregon inspections and permits database) - HWMS-6280-, CESQG (Resource Conservation and Recovery Act (tracking hazardous waste)) Business SIC classification: JOB TRAINING AND VOCATIONAL REHABILITATION SERVICES Organizations: YOUTH EMPLOYMENT INSTITUTE GRAFITTI REMO (CONTACT/ HAZARDOUS WASTE)
, JANUS YOUTH PROGRAMS INC / ARRAS (CONTACT/ HAZARDOUS WASTE)
, JANUS YOUTH PROGRAMS (CONTACT/OWNER)
, THE REAL ESTATE FIRM (HAZARDOUS WASTE LAND OWNER)
HOLLYROOD ELEMENTARY SCHOOL, HOT (3560 NE HOLLYROOD COURT in PORTLAND, OR)
(National Center for Education Statistics) - STATE ID-857 STATE MASTER (Oregon inspections and permits database) - OR-LUST-26-96-0517, LEAKING STORAGE TANK Organizations: PORTLAND PUBLIC SCHOOLS (CONTACT/GENERAL)
, PORTLAND SCH DIST 1J (SCHOOL DISTRICT)
ADT SECURITY SERVICES INC (703 NE HANCOCK in PORTLAND, OR)
STATE MASTER (Oregon inspections and permits database) - OR-HWMS-5722, CESQG (Resource Conservation and Recovery Act (tracking hazardous waste)) Business SIC and NAICS classification: SECURITY SYSTEMS SERVICES Organizations: ADT SECURITY SERVICES, INC. (CONTACT/ HAZARDOUS WASTE)
, A AND A CIGARETTE VENDOR (HAZARDOUS WASTE LAND OWNER)
FIRST FLOOR INC (2722 NE RODNEY AVE in PORTLAND, OR)
STATE MASTER (Oregon inspections and permits database) - OR-HWMS-5333, CESQG (Resource Conservation and Recovery Act (tracking hazardous waste)) Business SIC classification: FLOOR LAYING AND OTHER FLOOR WORK
HARDER MECHANICAL CONTRACTORS INC (2148 NE UNION AVE in PORTLAND, OR)
STATE MASTER (Oregon inspections and permits database) - OR-HWMS-5976, CESQG Conditionally Exempt Small Quantity Generators, less than 100 kg/month of hazardous waste (Resource Conservation and Recovery Act (tracking hazardous waste)) - notification Business SIC classification: OPERATIVE BUILDERS Organizations: STEVE HARDER (CONTACT/OWNER)
, UNICOL (HAZARDOUS WASTE LAND OWNER)
BEAUMONT MIDDLE SCHOOL (4043 NE FREMONT ST in PORTLAND, OR)
(National Center for Education Statistics) - STATE ID-831 Organizations: PORTLAND SCH DIST 1J (SCHOOL DISTRICT)
FERNWOOD MIDDLE SCHOOL (1915 NE 33RD in PORTLAND, OR)
(National Center for Education Statistics) - STATE ID-848 Organizations: PORTLAND SCH DIST 1J (SCHOOL DISTRICT)
Housing units lacking complete plumbing facilities: 0.1% Housing units lacking complete kitchen facilities: 0.1%
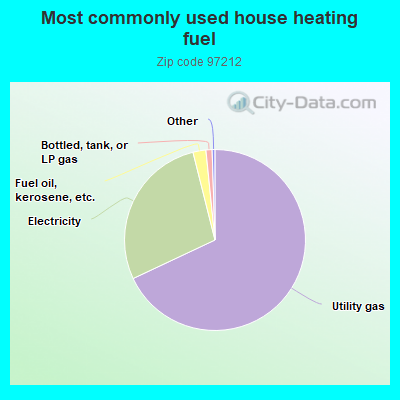
68.0%Utility gas
28.1%Electricity
2.3%Fuel oil, kerosene, etc.
1.1%Bottled, tank, or LP gas
Population in 1990: 23,898.
Place of birth for U.S.-born residents:
This state: 10,389
Northeast: 2,547
Midwest: 3,041
South: 2,545
West: 6,975
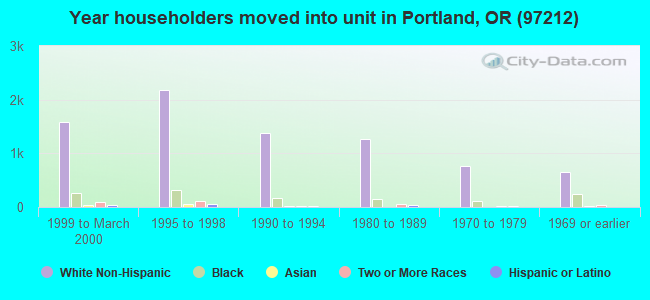
53% of the 97212 zip code residents lived in the same house 5 years ago. Out of people who lived in different houses, 57% lived in this county. Out of people who lived in different counties, 50% lived in Oregon.
85% of the 97212 zip code residents lived in the same house 1 year ago. Out of people who lived in different houses, 60% moved from this county. Out of people who lived in different houses, 9% moved from different county within same state. Out of people who lived in different houses, 27% moved from different state. Out of people who lived in different houses, 1% moved from abroad.
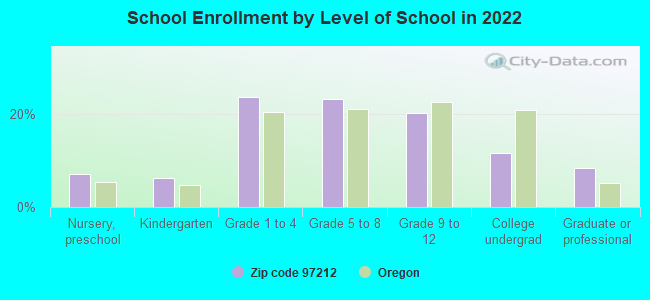
Private vs. public school enrollment:
Students in private schools in grades 1 to 8 (elementary and middle school): 680
Here:
24.8%
Oregon:
13.7%
Students in private schools in grades 9 to 12 (high school): 217
Here:
18.6%
Oregon:
8.8%
Students in private undergraduate colleges: 53
Here:
8.0%
Oregon:
17.7%
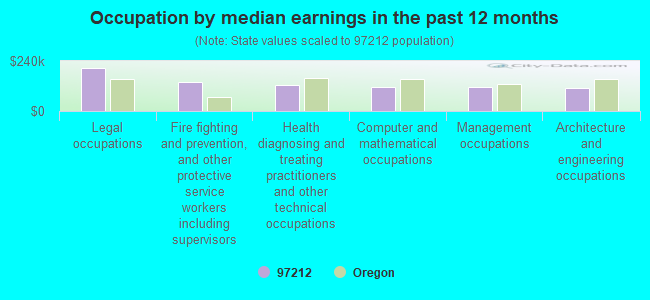
Occupation by median earnings in the past 12 months ($)
208,711Legal occupations
139,456Fire fighting and prevention, and other protective service workers including supervisors
123,287Health diagnosing and treating practitioners and other technical occupations
116,499Computer and mathematical occupations
114,284Management occupations
110,174Architecture and engineering occupations
Top industries in this zip code by the number of employees in 2005:
2002 - 2018 National Fire Incident Reporting System (NFIRS) incidents
According to the data from the years 2002 - 2018 the average number of fire incidents per year is 48. The highest number of fires - 115 took place in 2003, and the least - 7 in 2017. The data has a dropping trend.
When looking into fire subcategories, the most incidents belonged to: Outside Fires (46.7%), and Structure Fires (34.5%).
Fire incident types reported to NFIRS in Zip Code 97212


 Nearest zip codes: 97232, 97214, 97227, 97211, 97208, 97204.


 According to the data from the years 2002 - 2018 the average number of fire incidents per year is 48. The highest number of fires - 115 took place in 2003, and the least - 7 in 2017. The data has a dropping trend.
 When looking into fire subcategories, the most incidents belonged to: Outside Fires (46.7%), and Structure Fires (34.5%).