Estimated zip code population in 2022: 15,732 Zip code population in 2010: 14,459 Zip code population in 2000: 10,698
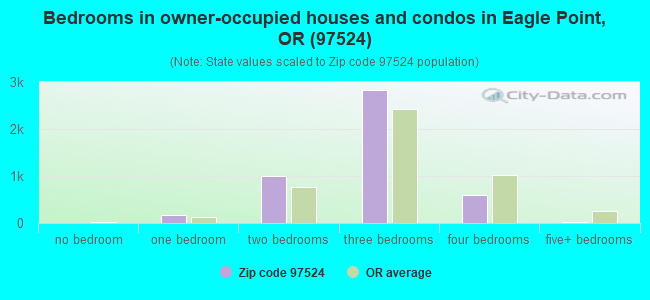
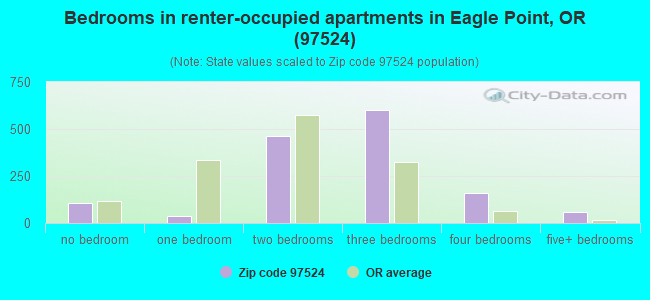
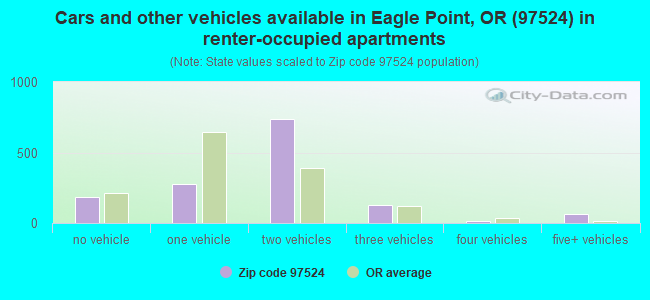
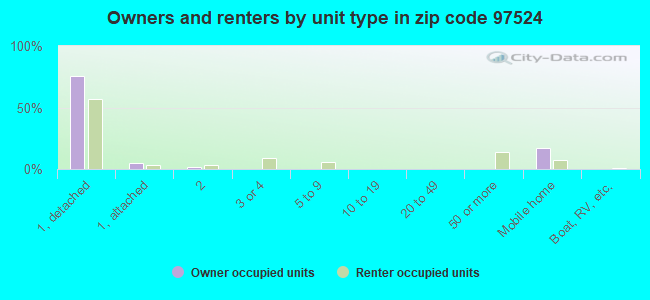
Houses and condos: 6,398 Renter-occupied apartments: 1,446
% of renters here:
24%
State:
37%
March 2022 cost of living index in zip code 97524: 98.1 (near average, U.S. average is 100)
Land area: 309.7 sq. mi. Water area: 1.6 sq. mi.
Population density: 51 people per square mile
(very low).
OSM Map
General Map
Google Map
MSN Map
OSM Map
General Map
Google Map
MSN Map
OSM Map
General Map
Google Map
MSN Map
OSM Map
General Map
Google Map
MSN Map
Please wait while loading the map...
Real estate property taxes paid for housing units in 2022:
This zip code:
0.7% ($2,801)
Oregon:
0.8% ($3,646)
Median real estate property taxes paid for housing units with mortgages in 2022: $2,850 (0.6%) Median real estate property taxes paid for housing units with no mortgage in 2022: $2,698 (0.7%)
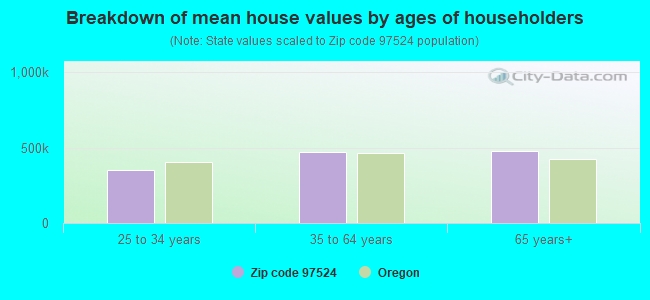
Estimated median house/condo value in 2022: $427,264
97524:
$427,264
Oregon:
$475,600
According to our research of Oregon and other state lists, there were 3 registered sex offenders living in 97524 zip code as of April 27, 2024. The ratio of all residents to sex offenders in zip code 97524 is 4,664 to 1. The ratio of registered sex offenders to all residents in this zip code is lower than the state average.
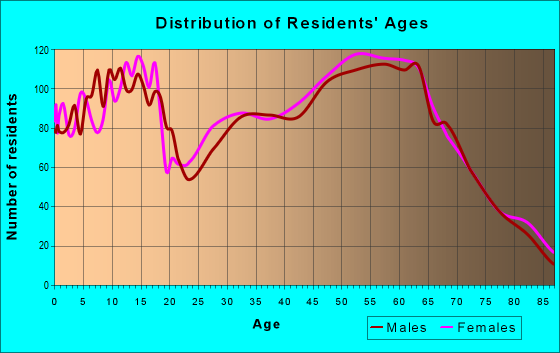
Median resident age:
This zip code:
42.7 years
Oregon median age:
40.5 years
Average household size:
This zip code:
2.6 people
Oregon:
2.4 people
Averages for the 2020 tax year for zip code 97524, filed in 2021:
Average Adjusted Gross Income (AGI) in 2020: $64,203 (Individual Income Tax Returns)
Here:
$64,203
State:
$76,001
Salary/wage: $52,339 (reported on 77.0% of returns)
Here:
$52,339
State:
$61,959
(% of AGI for various income ranges: 1147.8% for AGIs below $25k, 3564.3% for AGIs $25k-50k, 6631.6% for AGIs $50k-75k, 9755.9% for AGIs $75k-100k, 17625.6% for AGIs $100k-200k, 59668.3% for AGIs over 200k)
Taxable interest for individuals: $1,289 (reported on 41.4% of returns)
This zip code:
$1,289
Oregon:
$1,628
(% of AGI for various income ranges: 22.8% for AGIs below $25k, 28.1% for AGIs $25k-50k, 70.8% for AGIs $50k-75k, 78.2% for AGIs $75k-100k, 164.3% for AGIs $100k-200k, 2286.7% for AGIs over 200k)
Ordinary dividends: $6,420 (reported on 15.4% of returns)
Here:
$6,420
State:
$7,165
(% of AGI for various income ranges: 32.4% for AGIs below $25k, 40.9% for AGIs $25k-50k, 74.9% for AGIs $50k-75k, 112.9% for AGIs $75k-100k, 295.6% for AGIs $100k-200k, 5775.0% for AGIs over 200k)
Net capital gain/loss in AGI: +$20,178 (reported on 16.3% of returns)
Here:
+$20,178
State:
+$23,403
(% of AGI for various income ranges: 15.1% for AGIs below $25k, 29.1% for AGIs $25k-50k, 69.2% for AGIs $50k-75k, 210.4% for AGIs $75k-100k, 1014.8% for AGIs $100k-200k, 27531.7% for AGIs over 200k)
Profit/loss from business: +$13,370 (reported on 15.2% of returns)
Here:
+$13,370
State:
+$16,511
(% of AGI for various income ranges: 145.1% for AGIs below $25k, 171.2% for AGIs $25k-50k, 312.7% for AGIs $50k-75k, 299.0% for AGIs $75k-100k, 851.3% for AGIs $100k-200k, 3236.7% for AGIs over 200k)
Taxable individual retirement arrangement distribution: $16,743 (reported on 10.7% of returns)
97524:
$16,743
Oregon:
$20,730
(% of AGI for various income ranges: 84.4% for AGIs below $25k, 124.3% for AGIs $25k-50k, 257.7% for AGIs $50k-75k, 442.2% for AGIs $75k-100k, 812.4% for AGIs $100k-200k, 2786.7% for AGIs over 200k)
Total itemized deductions: $31,209 (reported on 11.7% of returns)
Here:
$31,209
State:
$31,050
(% of AGI for various income ranges: 142.4% for AGIs below $25k, 174.9% for AGIs $25k-50k, 484.5% for AGIs $50k-75k, 991.2% for AGIs $75k-100k, 1532.2% for AGIs $100k-200k, 8896.7% for AGIs over 200k)
Charity contributions: $8,997 (reported on 8.0% of returns)
Here:
$8,997
State:
$8,791
(% of AGI for various income ranges: 7.6% for AGIs below $25k, 19.6% for AGIs $25k-50k, 52.5% for AGIs $50k-75k, 96.5% for AGIs $75k-100k, 304.4% for AGIs $100k-200k, 4000.0% for AGIs over 200k)
Taxes paid: $7,721 (reported on 11.6% of returns)
97524:
$7,721
State:
$8,487
(% of AGI for various income ranges: 16.0% for AGIs below $25k, 36.7% for AGIs $25k-50k, 134.4% for AGIs $50k-75k, 249.2% for AGIs $75k-100k, 436.9% for AGIs $100k-200k, 1993.3% for AGIs over 200k)
Earned income credit: $2,152 (reported on 14.3% of returns)
Here:
$2,152
State:
$1,977
(% of AGI for various income ranges: 82.5% for AGIs below $25k, 69.4% for AGIs $25k-50k, 2.1% for AGIs $50k-75k)
Percentage of individuals using paid preparers for their 2020 taxes: 94.6%
Here:
95%
State:
93%
(% for various income ranges: 93.2% for AGIs below $25k, 95.7% for AGIs $25k-50k, 94.7% for AGIs $50k-75k, 95.1% for AGIs $75k-100k, 95.5% for AGIs $100k-200k, 92.0% for AGIs over 200k)
Averages for the 2012 tax year for zip code 97524, filed in 2013:
Average Adjusted Gross Income (AGI) in 2012: $51,412 (Individual Income Tax Returns)
Here:
$51,412
State:
$57,845
Salary/wage: $41,508 (reported on 78.6% of returns)
Here:
$41,508
State:
$47,723
(% of AGI for various income ranges: 67.9% for AGIs below $25k, 72.5% for AGIs $25k-50k, 71.3% for AGIs $50k-75k, 72.1% for AGIs $75k-100k, 65.0% for AGIs $100k-200k, 28.7% for AGIs over 200k)
Taxable interest for individuals: $2,298 (reported on 29.4% of returns)
This zip code:
$2,298
Oregon:
$1,848
(% of AGI for various income ranges: 1.7% for AGIs below $25k, 0.9% for AGIs $25k-50k, 0.9% for AGIs $50k-75k, 0.7% for AGIs $75k-100k, 1.0% for AGIs $100k-200k, 3.2% for AGIs over 200k)
Ordinary dividends: $6,517 (reported on 16.3% of returns)
Here:
$6,517
State:
$5,987
(% of AGI for various income ranges: 2.1% for AGIs below $25k, 1.0% for AGIs $25k-50k, 1.1% for AGIs $50k-75k, 0.8% for AGIs $75k-100k, 2.1% for AGIs $100k-200k, 5.7% for AGIs over 200k)
Net capital gain/loss in AGI: +$7,024 (reported on 15.3% of returns)
Here:
+$7,024
State:
+$13,095
(% of AGI for various income ranges: 0.5% for AGIs $25k-50k, 0.5% for AGIs $50k-75k, 0.5% for AGIs $75k-100k, 1.6% for AGIs $100k-200k, 9.6% for AGIs over 200k)
Profit/loss from business: +$10,389 (reported on 15.8% of returns)
Here:
+$10,389
State:
+$13,871
(% of AGI for various income ranges: 7.3% for AGIs below $25k, 4.1% for AGIs $25k-50k, 2.7% for AGIs $50k-75k, 2.6% for AGIs $75k-100k, 3.2% for AGIs $100k-200k, 0.8% for AGIs over 200k)
Taxable individual retirement arrangement distribution: $14,276 (reported on 12.2% of returns)
97524:
$14,276
Oregon:
$16,036
(% of AGI for various income ranges: 4.3% for AGIs below $25k, 2.8% for AGIs $25k-50k, 3.1% for AGIs $50k-75k, 3.1% for AGIs $75k-100k, 6.3% for AGIs $100k-200k)
Self-employment retirement plans: $15,950 (reported on 0.3% of returns)
97524:
$15,950
Oregon:
$19,462
Total itemized deductions: $22,502 (26% of AGI, reported on 39.5% of returns)
Here:
$22,502
State:
$24,430
Here:
26.2% of AGI
State:
23.2% of AGI
(% of AGI for various income ranges: 16.3% for AGIs below $25k, 15.0% for AGIs $25k-50k, 18.2% for AGIs $50k-75k, 19.1% for AGIs $75k-100k, 19.2% for AGIs $100k-200k, 14.8% for AGIs over 200k)
Charity contributions: $3,255 (reported on 29.9% of returns)
Here:
$3,255
State:
$3,648
(% of AGI for various income ranges: 1.2% for AGIs below $25k, 1.4% for AGIs $25k-50k, 1.7% for AGIs $50k-75k, 1.8% for AGIs $75k-100k, 1.9% for AGIs $100k-200k, 3.2% for AGIs over 200k)
Taxes paid: $7,668 (reported on 39.0% of returns)
97524:
$7,668
State:
$10,269
(% of AGI for various income ranges: 2.8% for AGIs below $25k, 3.4% for AGIs $25k-50k, 5.2% for AGIs $50k-75k, 6.6% for AGIs $75k-100k, 7.8% for AGIs $100k-200k, 7.6% for AGIs over 200k)
Earned income credit: $2,190 (reported on 19.2% of returns)
Here:
$2,190
State:
$2,021
(% of AGI for various income ranges: 6.3% for AGIs below $25k, 1.3% for AGIs $25k-50k)
Percentage of individuals using paid preparers for their 2012 taxes: 55.3%
Here:
55%
State:
47%
(% for various income ranges: 49.6% for AGIs below $25k, 55.2% for AGIs $25k-50k, 56.1% for AGIs $50k-75k, 60.0% for AGIs $75k-100k, 67.3% for AGIs $100k-200k, 90.0% for AGIs over 200k)
Averages for the 2004 tax year for zip code 97524, filed in 2005:
Average Adjusted Gross Income (AGI) in 2004: $44,720 (Individual Income Tax Returns)
Here:
$44,720
State:
$46,788
Salary/wage: $35,857 (reported on 83.7% of returns)
Here:
$35,857
State:
$39,788
(% of AGI for various income ranges: 99.0% for AGIs below $10k, 74.6% for AGIs $10k-25k, 79.6% for AGIs $25k-50k, 80.3% for AGIs $50k-75k, 73.3% for AGIs $75k-100k, 40.4% for AGIs over 100k)
Taxable interest for individuals: $2,094 (reported on 40.3% of returns)
This zip code:
$2,094
Oregon:
$2,126
(% of AGI for various income ranges: 6.7% for AGIs below $10k, 3.1% for AGIs $10k-25k, 1.3% for AGIs $25k-50k, 1.6% for AGIs $50k-75k, 1.4% for AGIs $75k-100k, 2.1% for AGIs over 100k)
Taxable dividends: $4,027 (reported on 18.4% of returns)
Here:
$4,027
State:
$3,427
(% of AGI for various income ranges: 4.6% for AGIs below $10k, 1.4% for AGIs $10k-25k, 0.7% for AGIs $25k-50k, 0.6% for AGIs $50k-75k, 0.7% for AGIs $75k-100k, 3.6% for AGIs over 100k)
Net capital gain/loss: +$22,397 (reported on 18.0% of returns)
Here:
+$22,397
State:
+$12,447
(% of AGI for various income ranges: -0.1% for AGIs below $10k, 0.4% for AGIs $10k-25k, 1.0% for AGIs $25k-50k, 2.0% for AGIs $50k-75k, 3.5% for AGIs $75k-100k, 26.2% for AGIs over 100k)
Profit/loss from business: +$10,679 (reported on 17.9% of returns)
Here:
+$10,679
State:
+$11,682
(% of AGI for various income ranges: 5.2% for AGIs below $10k, 7.4% for AGIs $10k-25k, 4.5% for AGIs $25k-50k, 2.9% for AGIs $50k-75k, 3.9% for AGIs $75k-100k, 4.4% for AGIs over 100k)
IRA payment deduction: $3,252 (reported on 3.7% of returns)
97524:
$3,252
Oregon:
$3,035
(% of AGI for various income ranges: 0.4% for AGIs below $10k, 0.3% for AGIs $10k-25k, 0.4% for AGIs $25k-50k, 0.3% for AGIs $50k-75k, 0.2% for AGIs $75k-100k, 0.1% for AGIs over 100k)
Self-employed pension: $10,732 (reported on 0.7% of returns)
Here:
$10,732
Oregon:
$14,224
Total itemized deductions: $19,175 (27% of AGI, reported on 43.7% of returns)
Here:
$19,175
State:
$20,209
Here:
27.0% of AGI
State:
24.7% of AGI
(% of AGI for various income ranges: 29.1% for AGIs below $10k, 16.1% for AGIs $10k-25k, 17.8% for AGIs $25k-50k, 21.4% for AGIs $50k-75k, 21.3% for AGIs $75k-100k, 16.4% for AGIs over 100k)
Charity contributions deductions: $2,840 (4% of AGI, reported on 35.6% of returns)
Here:
$2,840
State:
$3,145
Here:
3.8% of AGI
State:
3.6% of AGI
(% of AGI for various income ranges: 1.4% for AGIs below $10k, 1.4% for AGIs $10k-25k, 1.4% for AGIs $25k-50k, 2.0% for AGIs $50k-75k, 2.2% for AGIs $75k-100k, 3.4% for AGIs over 100k)
Total tax: $5,955 (reported on 74.6% of returns)
97524:
$5,955
State:
$7,148
(% of AGI for various income ranges: 3.5% for AGIs below $10k, 4.4% for AGIs $10k-25k, 5.9% for AGIs $25k-50k, 7.6% for AGIs $50k-75k, 9.8% for AGIs $75k-100k, 16.9% for AGIs over 100k)
Earned income credit: $1,652 (reported on 16.0% of returns)
Here:
$1,652
State:
$1,605
Percentage of individuals using paid preparers for their 2004 taxes: 58.7%
Here:
59%
State:
53%
(% for various income ranges: 49.8% for AGIs below $10k, 56.9% for AGIs $10k-25k, 60.2% for AGIs $25k-50k, 60.8% for AGIs $50k-75k, 62.2% for AGIs $75k-100k, 75.4% for AGIs over 100k)
Household received Food Stamps/SNAP in the past 12 months: 767 Household did not receive Food Stamps/SNAP in the past 12 months: 5,294
Women who had a birth in the past 12 months: 79 (63 now married, 16 unmarried) Women who did not have a birth in the past 12 months: 2,639 (1,115 now married, 1,521 unmarried)
Housing units in zip code 97524 with a mortgage: 2,327 (263 second mortgage, 251 both second mortgage and home equity loan) Houses without a mortgage: 40
Median monthly owner costs for units with a mortgage: $1,849 Median monthly owner costs for units without a mortgage: $557
Residents with income below the poverty level in 2022:
This zip code:
11.0%
Whole state:
12.1%
Residents with income below 50% of the poverty level in 2022:
This zip code:
4.8%
Whole state:
6.2%
Median number of rooms in houses and condos:
Here:
5.6
State:
6.2
Median number of rooms in apartments:
Here:
5.7
State:
4.0
Notable locations in this zip code not listed on our city pages
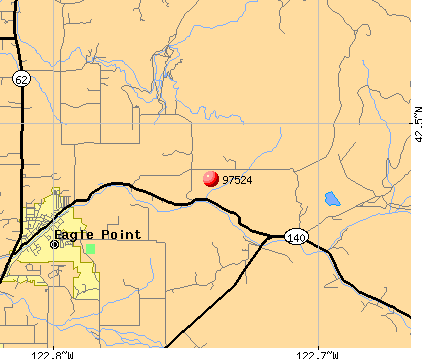
Notable locations in zip code 97524: Elder Ranch (A), Southern Oregon Speedway Dragway and Outdoor Kart Track (B), Fredenburg Ranch (C), Derby Station (D), Derby School (E), Cobleigh Ranch (F), Takelma Jackson County Park Boat Ramp (G), Dry Creek Landfill (H), Dodge Bridge Jackson County Park Boat Ramp (I), Agate Lake Jackson County Boat Ramp (J), Shady Cove Sewage Treatment Plant (K), Shady Cove Public Works Department Office (L), Jackson County Fire District 3 Eagle Point Station (M), Jackson County Fire District 3 Agate Lake Station (N), Jackson County Fire District 3 Dodge Bridge Station (O), Lake Creek Historical Society Pioneer Hall Museum (P), Eagle Point Historical Society Museum (Q), Eagle Point City Hall (R), Eagle Point Library (S), Eagle Point Municipal Court (T). Display/hide their locations on the map
Cemeteries: Antelope Cemetery (1), Brownsboro Cemetery (2), Miller Cemetery (3), Reese Creek Cemetery (4), Lake Creek Cemetery (5), Eagle Point National Cemetery (6), Veterans Cemetery (7). Display/hide their locations on the map
Lakes and reservoirs: Lost Lake (A), Yankee Creek Reservoir (B), Mayes Reservoir (C), Indian Lake Reservoir (D), Nygren Reservoir (E), Woolfolk Reservoir (F), Lake Creek Reservoir (G), F-P Reservoir (H). Display/hide their locations on the map
Streams, rivers, and creeks: Lake Creek (A), Randle Creek (B), Mud Creek (C), Yew Creek (D), Maple Creek (E), Swamp Creek (F), Osborne Creek (G), Grizzly Creek (H), Gray Creek (I). Display/hide their locations on the map
Parks in zip code 97524 include: Takelma County Park (1), Jackson County Sports Park (2), Agate Lake County Park (3), Dodge Bridge County Park (4). Display/hide their locations on the map
2,351 married couples with children.
821 single-parent households (369 men, 452 women).
93.7% of residents of 97524 zip code speak English at home.
5.9% of residents speak Spanish at home (84% very well, 10% well, 6% not well).
0.6% of residents speak other Indo-European language at home (100% very well).
0.1% of residents speak Asian or Pacific Island language at home (100% well).
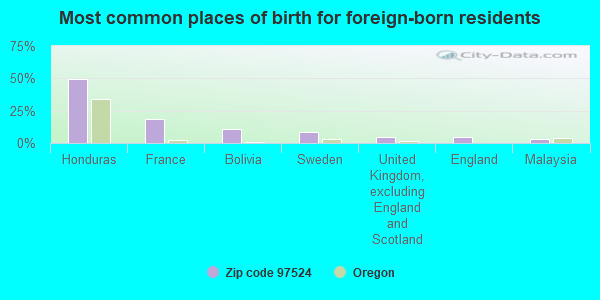
Foreign born population: 648 (4.1%) (38.4% of them are naturalized citizens)
This zip code:
4.1%
Whole state:
9.9%
49%Honduras
19%France
11%Bolivia
8%Sweden
4%United Kingdom, excluding England and Scotland
4%England
3%Malaysia
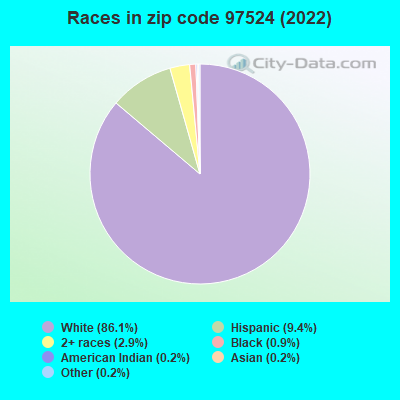
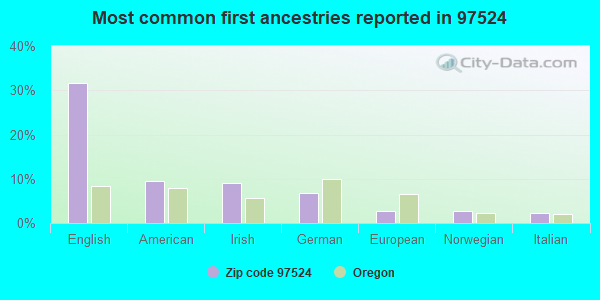
32%English
9%American
9%Irish
7%German
3%European
3%Norwegian
2%Italian
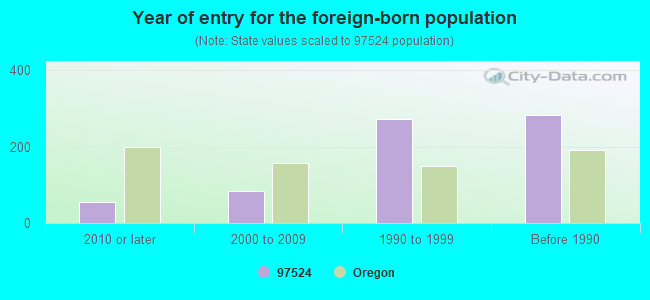
Year of entry for the foreign-born population
552010 or later
832000 to 2009
2731990 to 1999
283Before 1990
Facilities with environmental interests located in this zip code:
EAGLE POINT HIGH SCHOOL (203 N PLATT in EAGLE POINT, OR)
(National Center for Education Statistics) - STATE ID-397 STATE MASTER (Oregon inspections and permits database) - OR-LUST-15-91-0020, LEAKING STORAGE TANK STATE MASTER (Oregon inspections and permits database) - SIS-112973-18401, NPDES STORMWATER PERMIT Business SIC classification: HEAVY CONSTRUCTION Organizations: EAGLE POINT SCHOOL DIST. (CONTACT/GENERAL)
, JACKSON COUNTY SCHOOL DIST #9 (CONTACT/OWNER)
, EAGLE POINT SCH DIST 009 (SCHOOL DISTRICT)
Alternative names: SOFTBALL FIELD PROJECT
ALUMAWELD BOATS INC (2000 ROGUE RIVER DR in EAGLE POINT, OR) . Tribal Land
STATE MASTER (Oregon inspections and permits database) - OR-HWMS-1600, CESQG Small Quantity Generators, between 100 kg and 1000 kg of hazardous waste/month (Resource Conservation and Recovery Act (tracking hazardous waste)) Business SIC classification: BOAT BUILDING AND REPAIRING Business NAICS classification: BOAT BUILDING.; BOAT BUILDING. Organizations: ALUMAWELD BOATS, INC. (CONTACT/ HAZARDOUS WASTE)
, ALUMAWELD BOATS, INC (CONTACT/OPERATOR)
, STEVENS MARINE INC (CONTACT/OWNER)
GLEN D HALE PRIMARY (215 E MAIN ST in EAGLE POINT, OR)
(National Center for Education Statistics) - STATE ID-391 Organizations: EAGLE POINT SCH DIST 009 (SCHOOL DISTRICT)
EAGLE POINT SD 9 (11 N ROYAL AVE in EAGLE POINT, OR)
COMPLIANCE ACTIVITY (Tracking inspections of insecticide, fungicide, and rodenticide, and toxic substances)
Housing units lacking complete plumbing facilities: 1.6% Housing units lacking complete kitchen facilities: 3.1%
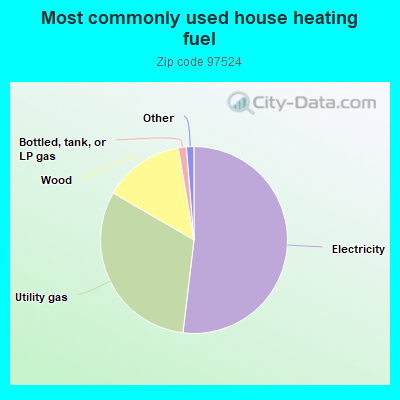
51.9%Electricity
31.5%Utility gas
13.9%Wood
1.4%Bottled, tank, or LP gas
0.7%Fuel oil, kerosene, etc.
0.7%Other fuel
Population in 1990: 7,468. Population change in the 1990s: +3,230 (+43.3%).
Place of birth for U.S.-born residents:
This state: 7,990
Northeast: 416
Midwest: 982
South: 655
West: 4,950
52% of the 97524 zip code residents lived in the same house 5 years ago. Out of people who lived in different houses, 66% lived in this county. Out of people who lived in different counties, 50% lived in Oregon.
82% of the 97524 zip code residents lived in the same house 1 year ago. Out of people who lived in different houses, 69% moved from this county. Out of people who lived in different houses, 5% moved from different county within same state. Out of people who lived in different houses, 22% moved from different state.
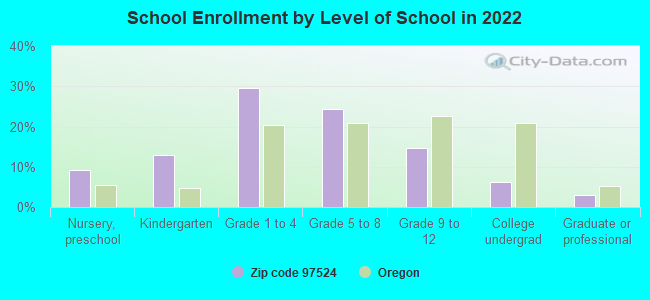
Private vs. public school enrollment:
Students in private schools in grades 1 to 8 (elementary and middle school): 392
Here:
22.3%
Oregon:
13.7%
Students in private schools in grades 9 to 12 (high school): 164
Here:
35.1%
Oregon:
8.8%
Students in private undergraduate colleges: 92
Here:
45.7%
Oregon:
17.7%
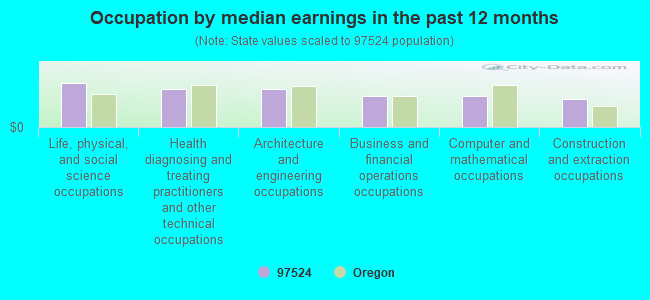
Occupation by median earnings in the past 12 months ($)
107,561Life, physical, and social science occupations
93,996Health diagnosing and treating practitioners and other technical occupations
91,954Architecture and engineering occupations
76,958Business and financial operations occupations
74,573Computer and mathematical occupations
69,566Construction and extraction occupations
Top industries in this zip code by the number of employees in 2005:
Other Services (except Public Administration): Religious Organizations (20-49 employees: 2 establishments, 10-19 employees: 1 establishment, 1-4 employees: 3 establishments)
Construction: New Single-Family Housing Construction (except Operative Builders) (10-19: 1, 5-9: 4, 1-4: 21)
Arts, Entertainment, and Recreation: Golf Courses and Country Clubs (20-49: 2)
Construction: Poured Concrete Foundation and Structure Contractors (20-49: 1, 10-19: 1, 5-9: 1, 1-4: 4)
Mining: Other Crushed and Broken Stone Mining and Quarrying (20-49: 1, 10-19: 1)
Construction: Site Preparation Contractors (10-19: 1, 5-9: 2, 1-4: 6)
Construction: Commercial and Institutional Building Construction (20-49: 1, 1-4: 2)
People in group quarters in 2010:
4 people in group homes intended for adults
3 people in residential treatment centers for adults
Fatal accident statistics in 2014:
Fatal accident count: 2
Vehicles involved in fatal accidents: 2
Fatal accidents caused by drunken drivers: 2
Fatalities: 2
Persons involved in fatal accidents: 2
Pedestrians involved in fatal accidents: 0
Fatal accident statistics in 2013:
Fatal accident count: 2
Vehicles involved in fatal accidents: 3
Fatal accidents caused by drunken drivers: 1
Fatalities: 3
Persons involved in fatal accidents: 8
Pedestrians involved in fatal accidents: 0
Home Mortgage Disclosure Act Aggregated Statistics For Year 2009 (Based on 2 full and 10 partial tracts)
A) FHA, FSA/RHS & VA Home Purchase Loans
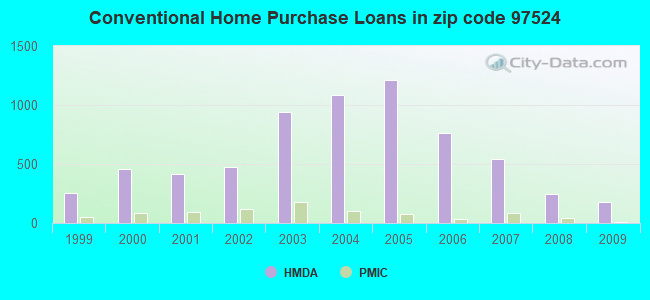
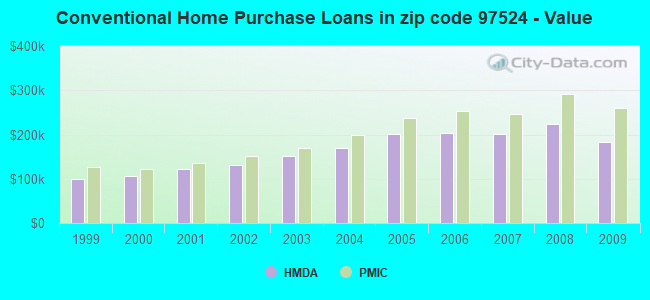
B) Conventional Home Purchase Loans
C) Refinancings
D) Home Improvement Loans
E) Loans on Dwellings For 5+ Families
F) Non-occupant Loans on < 5 Family Dwellings (A B C & D)
G) Loans On Manufactured Home Dwelling (A B C & D)
Number
Average Value
Number
Average Value
Number
Average Value
Number
Average Value
Number
Average Value
Number
Average Value
Number
Average Value
LOANS ORIGINATED
265
$187,687
182
$183,388
847
$223,232
26
$133,025
1
$55,100
86
$176,503
80
$151,879
APPLICATIONS APPROVED, NOT ACCEPTED
11
$181,265
26
$249,254
105
$204,534
0
$0
0
$0
11
$173,301
13
$122,576
APPLICATIONS DENIED
24
$170,722
50
$183,506
343
$235,848
24
$108,620
0
$0
36
$138,284
51
$149,883
APPLICATIONS WITHDRAWN
29
$186,280
32
$162,019
172
$239,368
4
$148,718
0
$0
20
$208,980
17
$159,435
FILES CLOSED FOR INCOMPLETENESS
2
$136,170
7
$215,394
38
$215,217
5
$69,646
0
$0
1
$82,060
7
$135,193
Aggregated Statistics For Year 2008 (Based on 2 full and 10 partial tracts)
A) FHA, FSA/RHS & VA Home Purchase Loans
B) Conventional Home Purchase Loans
C) Refinancings
D) Home Improvement Loans
E) Loans on Dwellings For 5+ Families
F) Non-occupant Loans on < 5 Family Dwellings (A B C & D)
G) Loans On Manufactured Home Dwelling (A B C & D)
Number
Average Value
Number
Average Value
Number
Average Value
Number
Average Value
Number
Average Value
Number
Average Value
Number
Average Value
LOANS ORIGINATED
178
$208,691
242
$223,235
492
$221,293
56
$88,124
1
$150,670
112
$200,802
79
$143,521
APPLICATIONS APPROVED, NOT ACCEPTED
8
$222,426
44
$172,902
104
$215,181
22
$63,831
0
$0
23
$165,317
17
$130,525
APPLICATIONS DENIED
21
$193,188
68
$146,629
392
$214,220
62
$127,514
0
$0
38
$161,613
115
$114,295
APPLICATIONS WITHDRAWN
19
$201,705
40
$214,615
154
$246,038
9
$98,937
0
$0
12
$222,289
23
$143,564
FILES CLOSED FOR INCOMPLETENESS
2
$256,370
11
$189,344
44
$253,181
3
$92,307
0
$0
4
$175,542
1
$186,650
Aggregated Statistics For Year 2007 (Based on 2 full and 10 partial tracts)
A) FHA, FSA/RHS & VA Home Purchase Loans
B) Conventional Home Purchase Loans
C) Refinancings
D) Home Improvement Loans
E) Loans on Dwellings For 5+ Families
F) Non-occupant Loans on < 5 Family Dwellings (A B C & D)
G) Loans On Manufactured Home Dwelling (A B C & D)
Number
Average Value
Number
Average Value
Number
Average Value
Number
Average Value
Number
Average Value
Number
Average Value
Number
Average Value
LOANS ORIGINATED
54
$199,690
544
$202,137
813
$222,523
94
$120,777
2
$595,140
139
$220,748
155
$136,972
APPLICATIONS APPROVED, NOT ACCEPTED
6
$251,058
101
$187,323
196
$247,266
13
$137,551
0
$0
30
$231,733
34
$146,627
APPLICATIONS DENIED
8
$184,544
148
$192,752
559
$242,093
115
$140,965
0
$0
67
$280,876
140
$128,547
APPLICATIONS WITHDRAWN
8
$199,399
65
$250,880
264
$260,072
36
$117,476
0
$0
29
$209,730
31
$161,292
FILES CLOSED FOR INCOMPLETENESS
0
$0
46
$216,470
80
$242,375
11
$93,128
0
$0
30
$186,560
7
$159,157
Aggregated Statistics For Year 2006 (Based on 2 full and 10 partial tracts)
A) FHA, FSA/RHS & VA Home Purchase Loans
B) Conventional Home Purchase Loans
C) Refinancings
D) Home Improvement Loans
E) Loans on Dwellings For 5+ Families
F) Non-occupant Loans on < 5 Family Dwellings (A B C & D)
G) Loans On Manufactured Home Dwelling (A B C & D)
Number
Average Value
Number
Average Value
Number
Average Value
Number
Average Value
Number
Average Value
Number
Average Value
Number
Average Value
LOANS ORIGINATED
25
$201,401
762
$203,851
1,082
$213,717
133
$109,857
1
$418,210
283
$221,731
143
$141,402
APPLICATIONS APPROVED, NOT ACCEPTED
2
$172,920
88
$207,139
233
$236,732
18
$98,673
0
$0
33
$241,698
29
$129,051
APPLICATIONS DENIED
7
$151,187
188
$165,297
570
$226,904
101
$89,931
1
$123,680
85
$224,280
151
$109,496
APPLICATIONS WITHDRAWN
5
$97,446
106
$201,835
389
$229,779
47
$164,054
0
$0
40
$218,094
37
$151,074
FILES CLOSED FOR INCOMPLETENESS
0
$0
32
$139,312
103
$240,322
6
$153,522
0
$0
5
$118,418
6
$188,782
Aggregated Statistics For Year 2005 (Based on 2 full and 10 partial tracts)
A) FHA, FSA/RHS & VA Home Purchase Loans
B) Conventional Home Purchase Loans
C) Refinancings
D) Home Improvement Loans
E) Loans on Dwellings For 5+ Families
F) Non-occupant Loans on < 5 Family Dwellings (A B C & D)
G) Loans On Manufactured Home Dwelling (A B C & D)
Number
Average Value
Number
Average Value
Number
Average Value
Number
Average Value
Number
Average Value
Number
Average Value
Number
Average Value
LOANS ORIGINATED
29
$187,378
1,213
$200,824
1,202
$195,018
142
$122,300
4
$13,470,002
331
$192,426
197
$141,849
APPLICATIONS APPROVED, NOT ACCEPTED
3
$151,757
150
$176,948
190
$194,280
26
$127,635
0
$0
34
$207,191
34
$107,048
APPLICATIONS DENIED
7
$165,540
281
$194,751
581
$187,493
133
$89,692
0
$0
77
$213,279
169
$118,102
APPLICATIONS WITHDRAWN
4
$216,105
173
$200,451
392
$190,288
64
$144,288
0
$0
53
$216,569
47
$139,617
FILES CLOSED FOR INCOMPLETENESS
0
$0
18
$275,026
100
$193,253
6
$60,233
0
$0
7
$170,671
12
$138,965
Aggregated Statistics For Year 2004 (Based on 2 full and 10 partial tracts)
A) FHA, FSA/RHS & VA Home Purchase Loans
B) Conventional Home Purchase Loans
C) Refinancings
D) Home Improvement Loans
E) Loans on Dwellings For 5+ Families
F) Non-occupant Loans on < 5 Family Dwellings (A B C & D)
G) Loans On Manufactured Home Dwelling (A B C & D)
Number
Average Value
Number
Average Value
Number
Average Value
Number
Average Value
Number
Average Value
Number
Average Value
Number
Average Value
LOANS ORIGINATED
60
$145,508
1,084
$170,377
1,085
$159,921
96
$72,520
0
$0
258
$155,844
174
$116,626
APPLICATIONS APPROVED, NOT ACCEPTED
4
$149,378
138
$163,649
186
$168,732
13
$62,555
0
$0
28
$151,698
43
$98,690
APPLICATIONS DENIED
14
$179,819
192
$141,402
501
$155,655
127
$80,146
2
$128,945
43
$158,020
137
$99,469
APPLICATIONS WITHDRAWN
5
$163,146
133
$160,327
386
$157,514
29
$99,857
0
$0
27
$152,052
32
$130,983
FILES CLOSED FOR INCOMPLETENESS
1
$214,240
22
$159,600
58
$165,760
11
$36,610
1
$2,594,550
4
$150,072
5
$147,884
Aggregated Statistics For Year 2003 (Based on 2 full and 10 partial tracts)
A) FHA, FSA/RHS & VA Home Purchase Loans
B) Conventional Home Purchase Loans
C) Refinancings
D) Home Improvement Loans
F) Non-occupant Loans on < 5 Family Dwellings (A B C & D)
Number
Average Value
Number
Average Value
Number
Average Value
Number
Average Value
Number
Average Value
LOANS ORIGINATED
126
$138,216
942
$151,144
1,734
$145,866
47
$33,607
280
$127,700
APPLICATIONS APPROVED, NOT ACCEPTED
3
$121,057
107
$137,463
256
$141,343
10
$72,776
30
$157,935
APPLICATIONS DENIED
15
$122,331
172
$106,704
515
$128,431
44
$34,449
57
$139,667
APPLICATIONS WITHDRAWN
18
$128,548
111
$140,595
349
$140,409
4
$37,165
36
$134,002
FILES CLOSED FOR INCOMPLETENESS
0
$0
22
$168,312
62
$133,798
2
$35,625
6
$112,962
Aggregated Statistics For Year 2002 (Based on 2 full and 6 partial tracts)
A) FHA, FSA/RHS & VA Home Purchase Loans
B) Conventional Home Purchase Loans
C) Refinancings
D) Home Improvement Loans
E) Loans on Dwellings For 5+ Families
F) Non-occupant Loans on < 5 Family Dwellings (A B C & D)
Number
Average Value
Number
Average Value
Number
Average Value
Number
Average Value
Number
Average Value
Number
Average Value
LOANS ORIGINATED
62
$134,968
478
$131,133
972
$134,822
25
$29,584
2
$4,463,550
128
$132,527
APPLICATIONS APPROVED, NOT ACCEPTED
5
$106,650
101
$133,259
144
$118,326
3
$24,420
0
$0
25
$146,232
APPLICATIONS DENIED
12
$133,768
125
$111,867
291
$121,137
19
$35,202
0
$0
29
$133,067
APPLICATIONS WITHDRAWN
9
$116,556
46
$144,884
188
$132,553
3
$19,233
0
$0
21
$129,825
FILES CLOSED FOR INCOMPLETENESS
1
$68,590
21
$132,714
50
$135,830
0
$0
0
$0
7
$157,771
Aggregated Statistics For Year 2001 (Based on 2 full and 6 partial tracts)
A) FHA, FSA/RHS & VA Home Purchase Loans
B) Conventional Home Purchase Loans
C) Refinancings
D) Home Improvement Loans
F) Non-occupant Loans on < 5 Family Dwellings (A B C & D)
Number
Average Value
Number
Average Value
Number
Average Value
Number
Average Value
Number
Average Value
LOANS ORIGINATED
81
$115,373
419
$121,775
772
$123,197
33
$37,754
112
$121,061
APPLICATIONS APPROVED, NOT ACCEPTED
3
$98,423
68
$80,912
113
$110,480
5
$74,198
10
$84,531
APPLICATIONS DENIED
12
$123,963
151
$72,275
280
$106,995
34
$36,427
17
$84,428
APPLICATIONS WITHDRAWN
6
$93,918
47
$129,975
199
$209,438
8
$63,220
15
$130,097
FILES CLOSED FOR INCOMPLETENESS
0
$0
12
$116,305
51
$146,394
2
$128,945
8
$146,578
Aggregated Statistics For Year 2000 (Based on 2 full and 6 partial tracts)
A) FHA, FSA/RHS & VA Home Purchase Loans
B) Conventional Home Purchase Loans
C) Refinancings
D) Home Improvement Loans
F) Non-occupant Loans on < 5 Family Dwellings (A B C & D)
Number
Average Value
Number
Average Value
Number
Average Value
Number
Average Value
Number
Average Value
LOANS ORIGINATED
89
$108,718
458
$107,147
264
$106,650
69
$22,363
95
$103,746
APPLICATIONS APPROVED, NOT ACCEPTED
14
$119,021
118
$81,561
95
$109,393
10
$30,298
24
$88,089
APPLICATIONS DENIED
8
$118,484
255
$64,443
196
$84,708
32
$21,810
36
$84,945
APPLICATIONS WITHDRAWN
13
$104,010
42
$106,123
82
$107,088
8
$71,562
13
$83,736
FILES CLOSED FOR INCOMPLETENESS
0
$0
7
$95,291
27
$106,406
3
$15,540
0
$0
Aggregated Statistics For Year 1999 (Based on 1 full and 4 partial tracts)
A) FHA, FSA/RHS & VA Home Purchase Loans
B) Conventional Home Purchase Loans
C) Refinancings
D) Home Improvement Loans
E) Loans on Dwellings For 5+ Families
F) Non-occupant Loans on < 5 Family Dwellings (A B C & D)
2002 - 2018 National Fire Incident Reporting System (NFIRS) incidents
Based on the data from the years 2002 - 2018 the average number of fire incidents per year is 47. The highest number of fires - 77 took place in 2005, and the least - 6 in 2017. The data has a dropping trend.
When looking into fire subcategories, the most reports belonged to: Outside Fires (54.3%), and Structure Fires (29.9%).
Fire incident types reported to NFIRS in Zip Code 97524
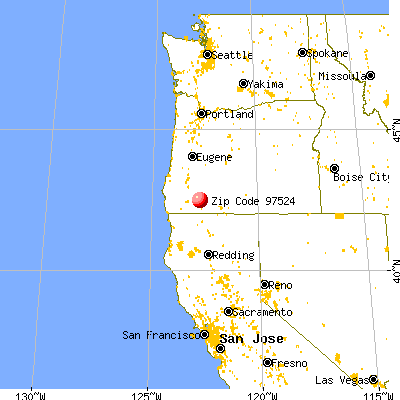


 Nearest zip codes: 97522, 97539, 97504, 97535, 97541, 97520.
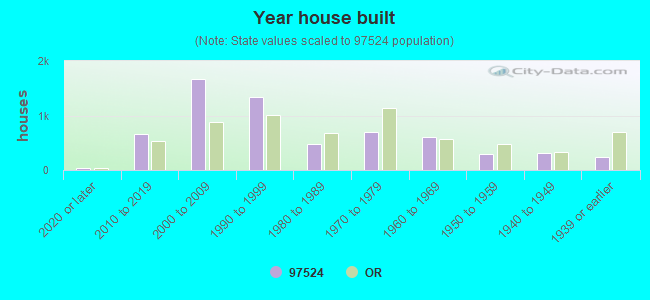


 Based on the data from the years 2002 - 2018 the average number of fire incidents per year is 47. The highest number of fires - 77 took place in 2005, and the least - 6 in 2017. The data has a dropping trend.
 When looking into fire subcategories, the most reports belonged to: Outside Fires (54.3%), and Structure Fires (29.9%).