Estimated zip code population in 2022: 2,118 Zip code population in 2010: 2,063 Zip code population in 2000: 1,934
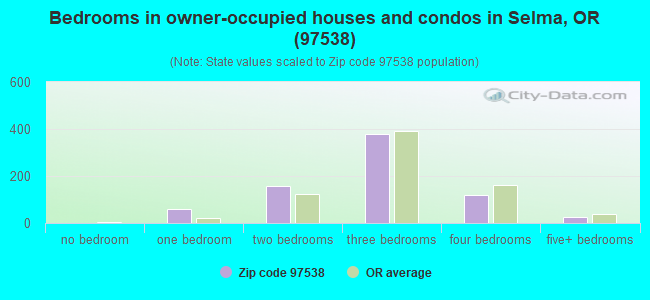
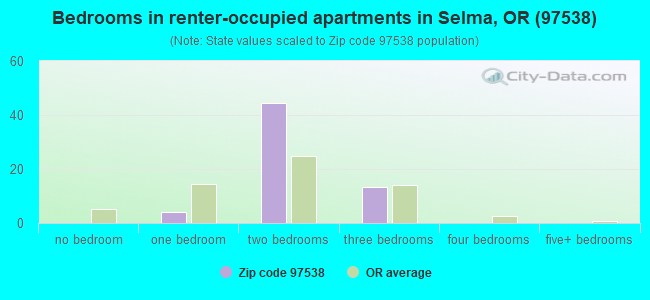
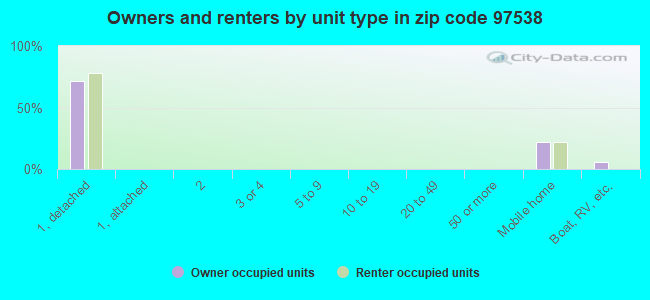
Houses and condos: 1,017 Renter-occupied apartments: 62
% of renters here:
8%
State:
37%
March 2022 cost of living index in zip code 97538: 91.2 (less than average, U.S. average is 100)
Land area: 142.0 sq. mi. Water area: 0.2 sq. mi.
Population density: 15 people per square mile
(very low).
OSM Map
General Map
Google Map
MSN Map
OSM Map
General Map
Google Map
MSN Map
OSM Map
General Map
Google Map
MSN Map
OSM Map
General Map
Google Map
MSN Map
Please wait while loading the map...
Real estate property taxes paid for housing units in 2022:
This zip code:
0.5% ($1,685)
Oregon:
0.8% ($3,646)
Median real estate property taxes paid for housing units with mortgages in 2022: $1,540 (0.5%) Median real estate property taxes paid for housing units with no mortgage in 2022: $2,038 (0.6%)
Business Search- 14 Million verified businesses
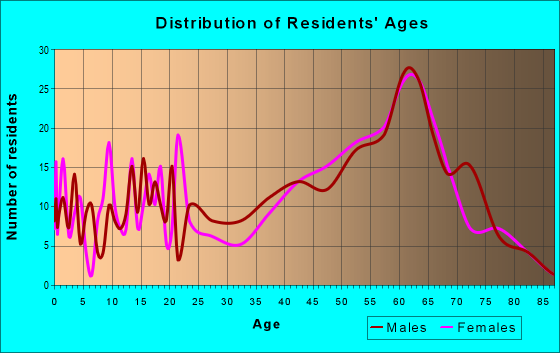
Males: 1,055
(49.8%)
Females: 1,063
(50.2%)
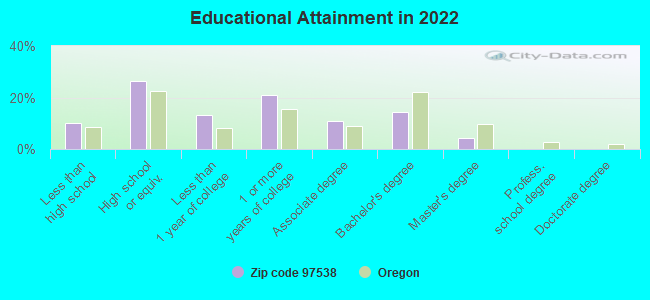
For population 25 years and over in 97538:
High school or higher: 89.2%
Bachelor's degree or higher: 18.2%
Graduate or professional degree: 4.1%
Unemployed: 8.4%
Mean travel time to work (commute): 31.2 minutes
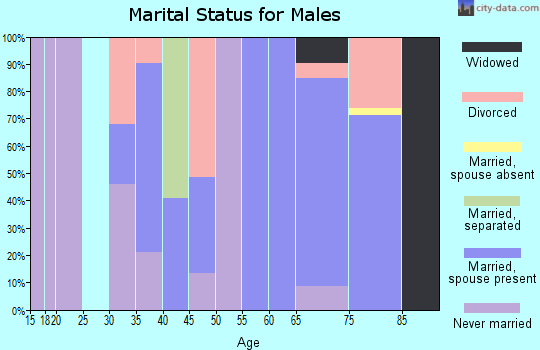
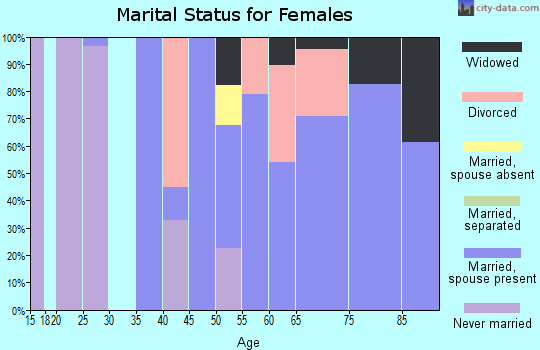
For population 15 years and over in 97538:
Never married: 12.3%
Now married: 69.0%
Separated: 0.0%
Widowed: 8.4%
Divorced: 10.4%
Zip code 97538 compared to state average:
Median household income below state average.
Unemployed percentage above state average.
Black race population percentage significantly below state average.
Hispanic race population percentage significantly below state average.
Foreign-born population percentage significantly below state average.
Renting percentage significantly below state average.
Length of stay since moving in below state average.
Number of college students significantly below state average.
Percentage of population with a bachelor's degree or higher below state average.
Averages for the 2020 tax year for zip code 97538, filed in 2021:
Average Adjusted Gross Income (AGI) in 2020: $37,603 (Individual Income Tax Returns)
Here:
$37,603
State:
$76,001
Salary/wage: $32,878 (reported on 59.2% of returns)
Here:
$32,878
State:
$61,959
(% of AGI for various income ranges: 969.6% for AGIs below $25k, 3390.8% for AGIs $25k-50k, 4880.0% for AGIs $50k-75k, 6192.5% for AGIs $75k-100k)
Taxable interest for individuals: $927 (reported on 28.9% of returns)
This zip code:
$927
Oregon:
$1,628
(% of AGI for various income ranges: 36.5% for AGIs below $25k, 18.3% for AGIs $25k-50k, 95.0% for AGIs $50k-75k)
Ordinary dividends: $3,033 (reported on 11.8% of returns)
Here:
$3,033
State:
$7,165
(% of AGI for various income ranges: 48.3% for AGIs below $25k, 86.7% for AGIs $50k-75k, 275.0% for AGIs $75k-100k)
Net capital gain/loss in AGI: +$13,150 (reported on 13.2% of returns)
Here:
+$13,150
State:
+$23,403
(% of AGI for various income ranges: 7.8% for AGIs below $25k, 101.7% for AGIs $25k-50k, 663.3% for AGIs $50k-75k)
Profit/loss from business: +$12,135 (reported on 22.4% of returns)
Here:
+$12,135
State:
+$16,511
(% of AGI for various income ranges: 322.6% for AGIs below $25k, 980.0% for AGIs $25k-50k, 362.5% for AGIs $75k-100k)
Taxable individual retirement arrangement distribution: $9,014 (reported on 9.2% of returns)
97538:
$9,014
Oregon:
$20,730
(% of AGI for various income ranges: 130.4% for AGIs below $25k, 551.7% for AGIs $50k-75k)
Total itemized deductions: $32,850 (reported on 2.6% of returns)
Here:
$32,850
State:
$31,050
(% of AGI for various income ranges: 1095.0% for AGIs $50k-75k)
Taxes paid: $6,800 (reported on 2.6% of returns)
97538:
$6,800
State:
$8,487
(% of AGI for various income ranges: 59.1% for AGIs below $25k)
Earned income credit: $2,094 (reported on 23.7% of returns)
Here:
$2,094
State:
$1,977
(% of AGI for various income ranges: 121.7% for AGIs below $25k, 80.8% for AGIs $25k-50k)
Percentage of individuals using paid preparers for their 2020 taxes: 92.1%
Here:
92%
State:
93%
(% for various income ranges: 91.9% for AGIs below $25k, 95.0% for AGIs $25k-50k, 90.0% for AGIs $50k-75k, 100.0% for AGIs $75k-100k, 80.0% for AGIs $100k-200k)
Averages for the 2012 tax year for zip code 97538, filed in 2013:
Average Adjusted Gross Income (AGI) in 2012: $34,004 (Individual Income Tax Returns)
Here:
$34,004
State:
$57,845
Salary/wage: $27,943 (reported on 63.0% of returns)
Here:
$27,943
State:
$47,723
(% of AGI for various income ranges: 53.5% for AGIs below $25k, 60.4% for AGIs $25k-50k, 52.5% for AGIs $50k-75k, 52.8% for AGIs $75k-100k, 35.9% for AGIs $100k-200k)
Taxable interest for individuals: $895 (reported on 30.1% of returns)
This zip code:
$895
Oregon:
$1,848
(% of AGI for various income ranges: 1.3% for AGIs below $25k, 0.6% for AGIs $25k-50k, 1.3% for AGIs $50k-75k, 0.8% for AGIs $75k-100k)
Ordinary dividends: $4,130 (reported on 13.7% of returns)
Here:
$4,130
State:
$5,987
(% of AGI for various income ranges: 1.4% for AGIs below $25k, 0.5% for AGIs $25k-50k, 3.5% for AGIs $50k-75k, 4.0% for AGIs $75k-100k)
Net capital gain/loss in AGI: +$2,244 (reported on 12.3% of returns)
Here:
+$2,244
State:
+$13,095
(% of AGI for various income ranges: 0.2% for AGIs $25k-50k, 7.8% for AGIs $75k-100k)
Profit/loss from business: +$6,671 (reported on 23.3% of returns)
Here:
+$6,671
State:
+$13,871
(% of AGI for various income ranges: 14.7% for AGIs below $25k, 4.8% for AGIs $25k-50k, 1.7% for AGIs $50k-75k)
Taxable individual retirement arrangement distribution: $11,671 (reported on 9.6% of returns)
97538:
$11,671
Oregon:
$16,036
Total itemized deductions: $19,888 (32% of AGI, reported on 23.3% of returns)
Here:
$19,888
State:
$24,430
Here:
32.3% of AGI
State:
23.2% of AGI
(% of AGI for various income ranges: 12.5% for AGIs below $25k, 11.3% for AGIs $25k-50k, 15.4% for AGIs $50k-75k, 17.1% for AGIs $75k-100k, 13.8% for AGIs $100k-200k)
Charity contributions: $3,109 (reported on 15.1% of returns)
Here:
$3,109
State:
$3,648
(% of AGI for various income ranges: 0.5% for AGIs below $25k, 0.9% for AGIs $25k-50k, 2.0% for AGIs $50k-75k, 4.9% for AGIs $75k-100k)
Taxes paid: $5,324 (reported on 23.3% of returns)
97538:
$5,324
State:
$10,269
(% of AGI for various income ranges: 1.4% for AGIs below $25k, 2.5% for AGIs $25k-50k, 6.4% for AGIs $50k-75k, 6.5% for AGIs $100k-200k)
Earned income credit: $1,775 (reported on 27.4% of returns)
Here:
$1,775
State:
$2,021
(% of AGI for various income ranges: 6.0% for AGIs below $25k, 1.0% for AGIs $25k-50k)
Percentage of individuals using paid preparers for their 2012 taxes: 54.8%
Here:
55%
State:
47%
(% for various income ranges: 51.3% for AGIs below $25k, 52.6% for AGIs $25k-50k, 88.9% for AGIs $50k-75k, 66.7% for AGIs $100k-200k)
Averages for the 2004 tax year for zip code 97538, filed in 2005:
Average Adjusted Gross Income (AGI) in 2004: $30,164 (Individual Income Tax Returns)
Here:
$30,164
State:
$46,788
Salary/wage: $24,933 (reported on 69.4% of returns)
Here:
$24,933
State:
$39,788
(% of AGI for various income ranges: 108.1% for AGIs below $10k, 66.5% for AGIs $10k-25k, 62.8% for AGIs $25k-50k, 74.4% for AGIs $50k-75k, 57.8% for AGIs $75k-100k, 21.8% for AGIs over 100k)
Taxable interest for individuals: $2,669 (reported on 44.7% of returns)
This zip code:
$2,669
Oregon:
$2,126
(% of AGI for various income ranges: 15.3% for AGIs below $10k, 3.6% for AGIs $10k-25k, 2.1% for AGIs $25k-50k, 1.1% for AGIs $50k-75k, 2.8% for AGIs $75k-100k, 8.4% for AGIs over 100k)
Taxable dividends: $1,888 (reported on 16.4% of returns)
Here:
$1,888
State:
$3,427
(% of AGI for various income ranges: 5.9% for AGIs below $10k, 0.9% for AGIs $10k-25k, 1.3% for AGIs $25k-50k, 1.5% for AGIs $50k-75k, 0.6% for AGIs $75k-100k)
Net capital gain/loss: +$12,155 (reported on 15.8% of returns)
Here:
+$12,155
State:
+$12,447
(% of AGI for various income ranges: -6.4% for AGIs below $10k, 0.9% for AGIs $10k-25k, 2.0% for AGIs $25k-50k, 3.0% for AGIs $50k-75k, 4.0% for AGIs $75k-100k, 22.9% for AGIs over 100k)
Profit/loss from business: +$2,021 (reported on 17.7% of returns)
Here:
+$2,021
State:
+$11,682
(% of AGI for various income ranges: -31.3% for AGIs below $10k, 7.5% for AGIs $10k-25k, 5.2% for AGIs $25k-50k, -2.3% for AGIs $50k-75k, -6.6% for AGIs $75k-100k)
IRA payment deduction: $3,167 (reported on 2.2% of returns)
97538:
$3,167
Oregon:
$3,035
Total itemized deductions: $16,004 (29% of AGI, reported on 27.7% of returns)
Here:
$16,004
State:
$20,209
Here:
29.4% of AGI
State:
24.7% of AGI
(% of AGI for various income ranges: 26.0% for AGIs below $10k, 14.0% for AGIs $10k-25k, 14.3% for AGIs $25k-50k, 16.3% for AGIs $50k-75k, 19.1% for AGIs $75k-100k, 11.3% for AGIs over 100k)
Charity contributions deductions: $2,339 (4% of AGI, reported on 20.1% of returns)
Here:
$2,339
State:
$3,145
Here:
4.1% of AGI
State:
3.6% of AGI
(% of AGI for various income ranges: 1.1% for AGIs below $10k, 2.5% for AGIs $10k-25k, 1.3% for AGIs $25k-50k, 0.9% for AGIs $50k-75k, 0.6% for AGIs $75k-100k, 2.2% for AGIs over 100k)
Total tax: $3,582 (reported on 64.6% of returns)
97538:
$3,582
State:
$7,148
(% of AGI for various income ranges: 5.6% for AGIs below $10k, 3.8% for AGIs $10k-25k, 6.1% for AGIs $25k-50k, 8.1% for AGIs $50k-75k, 11.8% for AGIs $75k-100k, 11.3% for AGIs over 100k)
Earned income credit: $1,720 (reported on 23.6% of returns)
Here:
$1,720
State:
$1,605
Percentage of individuals using paid preparers for their 2004 taxes: 62.4%
Here:
62%
State:
53%
(% for various income ranges: 58.0% for AGIs below $10k, 58.5% for AGIs $10k-25k, 64.7% for AGIs $25k-50k, 65.6% for AGIs $50k-75k, 82.8% for AGIs $75k-100k, 95.2% for AGIs over 100k)
Household received Food Stamps/SNAP in the past 12 months: 102 Household did not receive Food Stamps/SNAP in the past 12 months: 701
Women who had a birth in the past 12 months: 50 (50 now married, 0 unmarried) Women who did not have a birth in the past 12 months: 269 (218 now married, 44 unmarried)
Housing units in zip code 97538 with a mortgage: 457 (14 second mortgage, 15 both second mortgage and home equity loan) Median monthly owner costs for units with a mortgage: $1,550 Median monthly owner costs for units without a mortgage: $364
Residents with income below the poverty level in 2022:
This zip code:
21.8%
Whole state:
12.1%
Residents with income below 50% of the poverty level in 2022:
This zip code:
13.9%
Whole state:
6.2%
Median number of rooms in houses and condos:
Here:
5.7
State:
6.2
Median number of rooms in apartments:
Here:
4.2
State:
4.0
Notable locations in this zip code not listed on our city pages
Notable locations in zip code 97538: Store Gulch Guard Station (A), Lake Selmac Boat Dock (B), Lake Selmac Reeves Creek Boat Launch (C), Lake Selmac McMullen Creek Boat Launch (D), Store Gulch Recreation Site (E), Lake Selmac Boat Dock (F), Anderson Station (G), Miami Bar Boat Launch (H), Lake Selmac Boat Dock (I), Illinois Valley Fire District Station 5 (J), Illinois Valley Fire District Station 2 (K). Display/hide their locations on the map
Creeks: Ryan Creek (A), Hegan Creek (B), Hansen Creek (C), Booker Creek (D), Brockhurst Creek (E), Eight Dollar Mountain Creek (F), Montgomery Creek (G), Oak Flat Creek (H), Myrtle Creek (I). Display/hide their locations on the map
In group quarters: 3 (-1 institutionalized population)
Size of family households: 181 2-persons, 120 3-persons, 146 4-persons, 61 5-persons, 7 6-persons, 26 7-or-more-persons
Size of nonfamily households: 252 1-person
449 married couples with children.
0 single-parent households ().
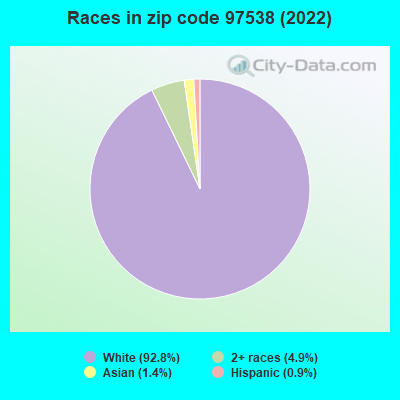
96.3% of residents of 97538 zip code speak English at home.
0.5% of residents speak Spanish at home (100% very well).
1.5% of residents speak other Indo-European language at home (100% very well).
1.4% of residents speak Asian or Pacific Island language at home (100% very well).
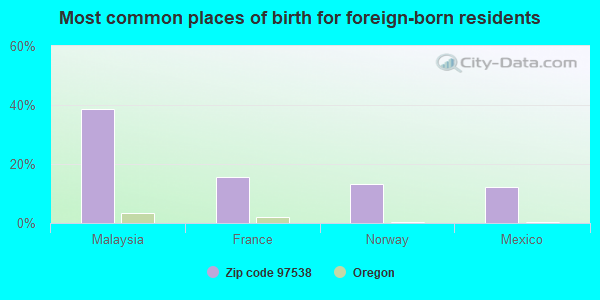
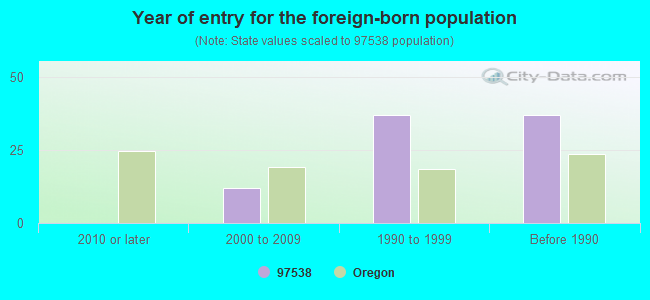
Foreign born population: 82 (3.9%) (72.3% of them are naturalized citizens)
This zip code:
3.9%
Whole state:
9.9%
39%Malaysia
16%France
13%Norway
12%Mexico
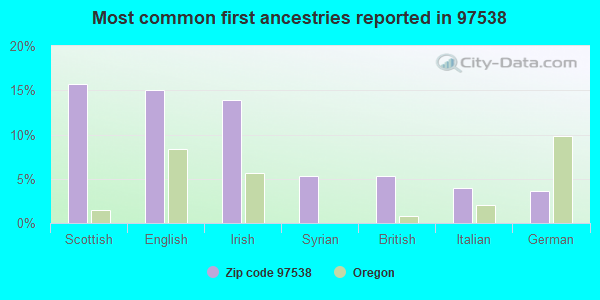
16%Scottish
15%English
14%Irish
5%Syrian
5%British
4%Italian
4%German
Year of entry for the foreign-born population
02010 or later
122000 to 2009
371990 to 1999
37Before 1990
Facilities with environmental interests located in this zip code:
BULK TRANSPORTATION SPILL SITE (HWY 199 @ MP 23 JCT GOLD CANYO in SELMA, OR)
(Resource Conservation and Recovery Act (tracking hazardous waste)) Organizations: BULK TRANSPORTATION A CALIFORNIA CORP (CONTACT/OWNER)
Housing units lacking complete plumbing facilities: 1.8% Housing units lacking complete kitchen facilities: 2.0%
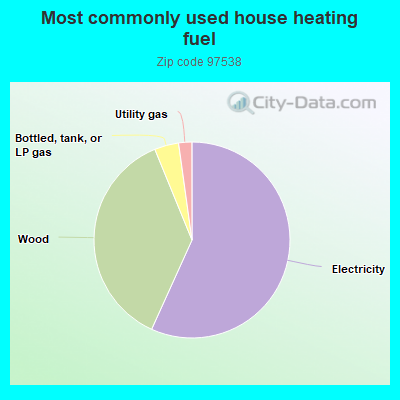
57.0%Electricity
37.2%Wood
4.0%Bottled, tank, or LP gas
2.2%Utility gas
Population in 1990: 2,065.
Place of birth for U.S.-born residents:
This state: 605
Northeast: 137
Midwest: 139
South: 203
West: 946
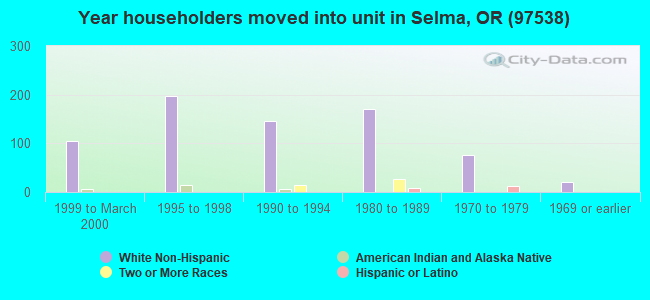
58% of the 97538 zip code residents lived in the same house 5 years ago. Out of people who lived in different houses, 50% lived in this county. Out of people who lived in different counties, 50% lived in Oregon.
83% of the 97538 zip code residents lived in the same house 1 year ago. Out of people who lived in different houses, 73% moved from this county. Out of people who lived in different houses, 9% moved from different county within same state. Out of people who lived in different houses, 13% moved from different state.
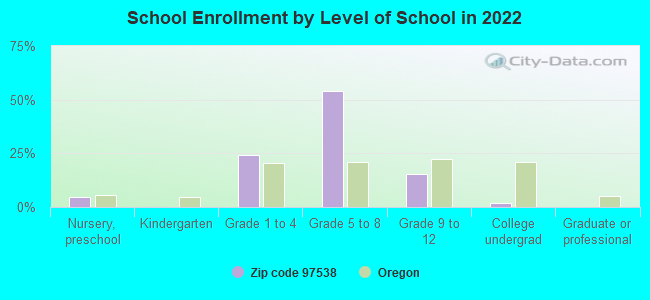
Private vs. public school enrollment:
Students in private schools in grades 1 to 8 (elementary and middle school): 18
Here:
6.0%
Oregon:
13.7%
Students in private schools in grades 9 to 12 (high school):
Here:
0.0%
Oregon:
8.8%
Students in private undergraduate colleges:
Here:
0.0%
Oregon:
17.7%
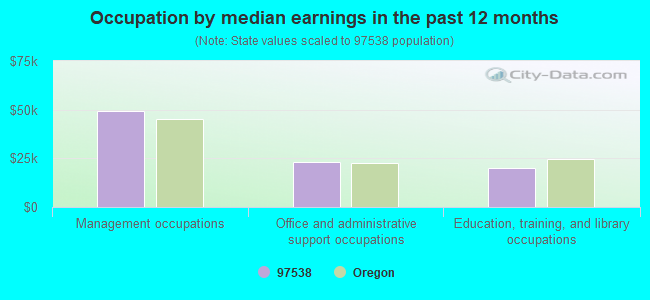
Occupation by median earnings in the past 12 months ($)
49,144Management occupations
23,358Office and administrative support occupations
19,999Education, training, and library occupations
Top industries in this zip code by the number of employees in 2005:
Information: Internet Publishing and Broadcasting (10-19 employees: 1 establishment)
Other Services (except Public Administration): Religious Organizations (10-19: 1)
Administrative and Support and Waste Management and Remediation Services: Landscaping Services (5-9: 1)
Wholesale Trade: Electrical Apparatus and Equipment, Wiring Supplies, and Related Equipment Merchant Wholesalers (5-9: 1)
Health Care and Social Assistance: Offices of Physicians (except Mental Health Specialists) (5-9: 1)
Construction: Painting and Wall Covering Contractors (1-4: 3)
Construction: Plumbing, Heating, and Air-Conditioning Contractors (1-4: 2)
People in group quarters in 2010:
3 people in workers' group living quarters and job corps centers
2 people in group homes for juveniles (non-correctional)
Fatal accident statistics in 2014:
Fatal accident count: 2
Vehicles involved in fatal accidents: 3
Fatal accidents caused by drunken drivers: 1
Fatalities: 2
Persons involved in fatal accidents: 8
Pedestrians involved in fatal accidents: 0
Fatal accident statistics in 2011:
Fatal accident count: 1
Vehicles involved in fatal accidents: 2
Fatal accidents caused by drunken drivers: 1
Fatalities: 1
Persons involved in fatal accidents: 4
Pedestrians involved in fatal accidents: 0
2002 - 2018 National Fire Incident Reporting System (NFIRS) incidents
Based on the data from the years 2002 - 2018 the average number of fires per year is 18. The highest number of fires - 35 took place in 2008, and the least - 5 in 2013. The data has a dropping trend.
When looking into fire subcategories, the most incidents belonged to: Outside Fires (55.7%), and Structure Fires (27.0%).
Fire incident types reported to NFIRS in Zip Code 97538
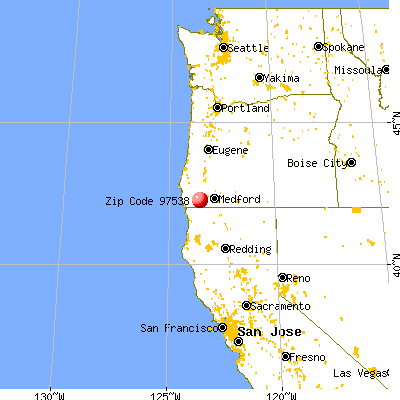


 Nearest zip codes: 97543, 97531, 97523, 97527, 97534, 97532.


 Based on the data from the years 2002 - 2018 the average number of fires per year is 18. The highest number of fires - 35 took place in 2008, and the least - 5 in 2013. The data has a dropping trend.
 When looking into fire subcategories, the most incidents belonged to: Outside Fires (55.7%), and Structure Fires (27.0%).