Estimated zip code population in 2022: 4,427 Zip code population in 2010: 4,561 Zip code population in 2000: 3,690
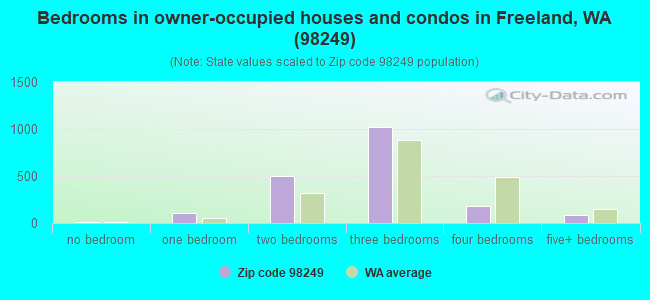
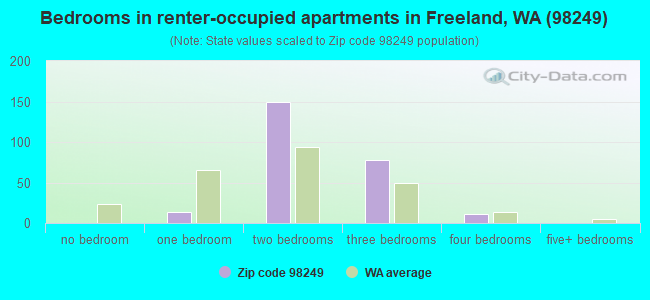
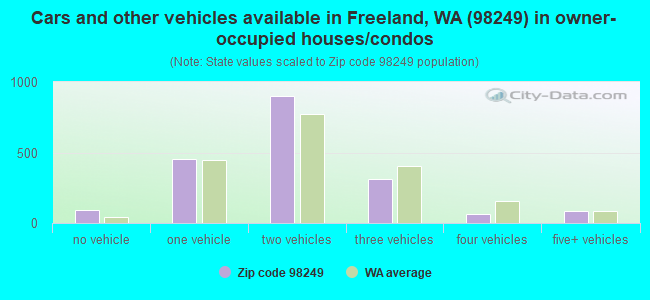
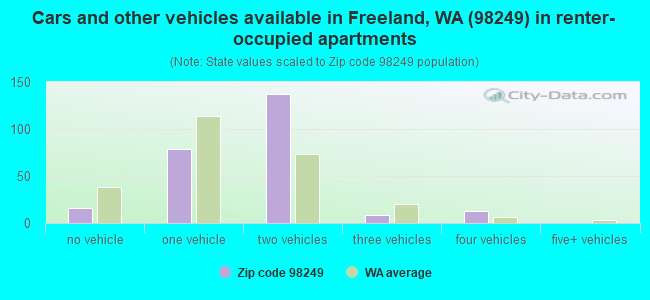
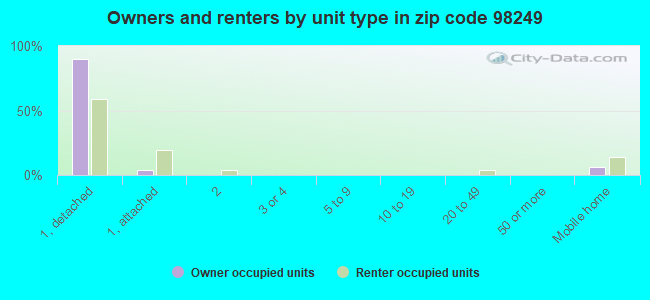
Houses and condos: 3,286 Renter-occupied apartments: 255
% of renters here:
12%
State:
36%
March 2022 cost of living index in zip code 98249: 99.1 (near average, U.S. average is 100)
Land area: 15.9 sq. mi. Water area: 8.8 sq. mi.
Population density: 278 people per square mile
(very low).
OSM Map
General Map
Google Map
MSN Map
OSM Map
General Map
Google Map
MSN Map
OSM Map
General Map
Google Map
MSN Map
OSM Map
General Map
Google Map
MSN Map
Please wait while loading the map...
Real estate property taxes paid for housing units in 2022:
This zip code:
0.5% ($3,517)
Washington:
0.8% ($4,283)
Median real estate property taxes paid for housing units with mortgages in 2022: $3,149 (0.5%) Median real estate property taxes paid for housing units with no mortgage in 2022: $3,959 (0.5%)
Business Search- 14 Million verified businesses
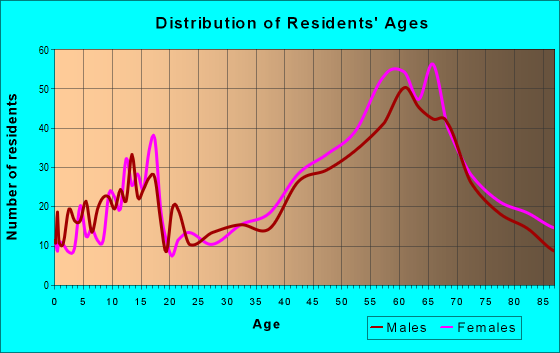
Males: 2,261
(51.1%)
Females: 2,166
(48.9%)
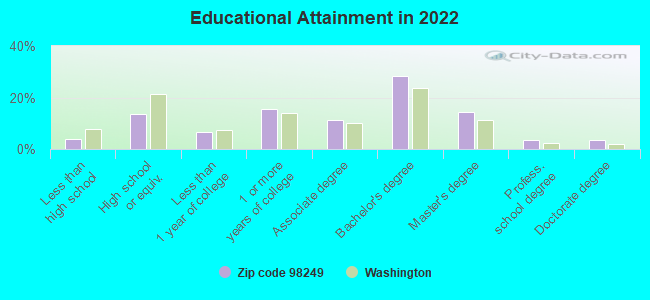
For population 25 years and over in 98249:
High school or higher: 96.7%
Bachelor's degree or higher: 49.9%
Graduate or professional degree: 21.2%
Unemployed: 3.6%
Mean travel time to work (commute): 38.4 minutes
For population 15 years and over in 98249:
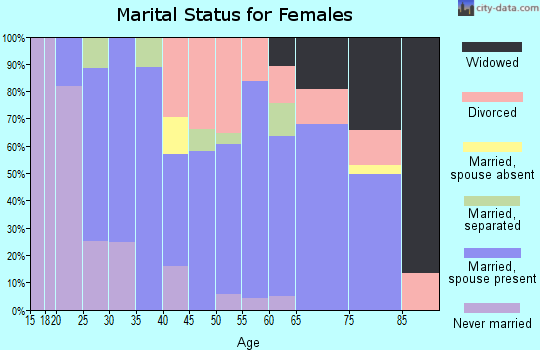
Never married: 17.9%
Now married: 59.8%
Separated: 1.0%
Widowed: 8.5%
Divorced: 12.8%
Zip code 98249 compared to state average:
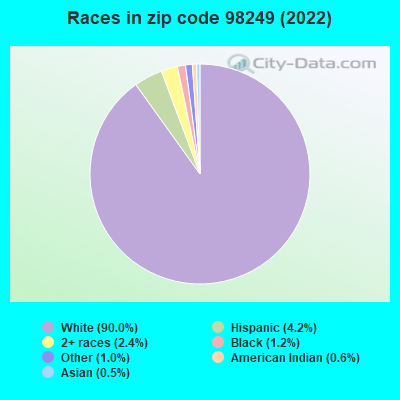
Black race population percentage significantly below state average.
Hispanic race population percentage significantly below state average.
Median age significantly above state average.
Foreign-born population percentage significantly below state average.
Renting percentage significantly below state average.
Length of stay since moving in significantly above state average.
Number of college students below state average.
Percentage of population with a bachelor's degree or higher above state average.
Estimated median house/condo value in 2022: $672,597
98249:
$672,597
Washington:
$569,500
According to our research of Washington and other state lists, there was 1 registered sex offender living in 98249 zip code as of April 26, 2024. The ratio of all residents to sex offenders in zip code 98249 is 4,205 to 1. The ratio of registered sex offenders to all residents in this zip code is much lower than the state average.
Median resident age:
This zip code:
58.0 years
Washington median age:
38.4 years
Average household size:
This zip code:
2.1 people
Washington:
2.5 people
Averages for the 2020 tax year for zip code 98249, filed in 2021:
Average Adjusted Gross Income (AGI) in 2020: $104,727 (Individual Income Tax Returns)
Here:
$104,727
State:
$99,264
Salary/wage: $72,181 (reported on 60.1% of returns)
Here:
$72,181
State:
$80,347
(% of AGI for various income ranges: 933.3% for AGIs below $25k, 2762.8% for AGIs $25k-50k, 5207.8% for AGIs $50k-75k, 7963.2% for AGIs $75k-100k, 14871.4% for AGIs $100k-200k, 80386.7% for AGIs over 200k)
Taxable interest for individuals: $1,939 (reported on 50.3% of returns)
This zip code:
$1,939
Washington:
$2,077
(% of AGI for various income ranges: 49.6% for AGIs below $25k, 74.9% for AGIs $25k-50k, 93.0% for AGIs $50k-75k, 157.9% for AGIs $75k-100k, 310.3% for AGIs $100k-200k, 1786.7% for AGIs over 200k)
Ordinary dividends: $11,723 (reported on 37.3% of returns)
Here:
$11,723
State:
$10,013
(% of AGI for various income ranges: 120.4% for AGIs below $25k, 211.0% for AGIs $25k-50k, 372.6% for AGIs $50k-75k, 445.8% for AGIs $75k-100k, 1142.1% for AGIs $100k-200k, 11815.0% for AGIs over 200k)
Net capital gain/loss in AGI: +$38,206 (reported on 36.7% of returns)
Here:
+$38,206
State:
+$40,092
(% of AGI for various income ranges: 53.7% for AGIs below $25k, 145.6% for AGIs $25k-50k, 313.5% for AGIs $50k-75k, 502.1% for AGIs $75k-100k, 1972.8% for AGIs $100k-200k, 58270.0% for AGIs over 200k)
Profit/loss from business: +$24,576 (reported on 21.4% of returns)
Here:
+$24,576
State:
+$18,312
(% of AGI for various income ranges: 223.7% for AGIs below $25k, 489.7% for AGIs $25k-50k, 665.7% for AGIs $50k-75k, 717.9% for AGIs $75k-100k, 2112.8% for AGIs $100k-200k, 7098.3% for AGIs over 200k)
Taxable individual retirement arrangement distribution: $27,078 (reported on 21.1% of returns)
98249:
$27,078
Washington:
$24,221
(% of AGI for various income ranges: 145.9% for AGIs below $25k, 280.3% for AGIs $25k-50k, 589.6% for AGIs $50k-75k, 1148.4% for AGIs $75k-100k, 2292.1% for AGIs $100k-200k, 9420.0% for AGIs over 200k)
Self-employed (Keogh) retirement plans: $24,950 (reported on 1.3% of returns)
98249:
$24,950
Washington:
$24,166
(% of AGI for various income ranges: 344.1% for AGIs $100k-200k)
Total itemized deductions: $37,213 (reported on 14.6% of returns)
Here:
$37,213
State:
$39,068
(% of AGI for various income ranges: 99.3% for AGIs below $25k, 334.6% for AGIs $25k-50k, 522.6% for AGIs $50k-75k, 1001.6% for AGIs $75k-100k, 1764.5% for AGIs $100k-200k, 11270.0% for AGIs over 200k)
Charity contributions: $12,394 (reported on 11.7% of returns)
Here:
$12,394
State:
$15,331
(% of AGI for various income ranges: 39.5% for AGIs $25k-50k, 93.0% for AGIs $50k-75k, 131.6% for AGIs $75k-100k, 292.1% for AGIs $100k-200k, 4995.0% for AGIs over 200k)
Taxes paid: $7,444 (reported on 14.0% of returns)
98249:
$7,444
State:
$7,774
(% of AGI for various income ranges: 81.5% for AGIs $25k-50k, 102.2% for AGIs $50k-75k, 185.3% for AGIs $75k-100k, 404.5% for AGIs $100k-200k, 1871.7% for AGIs over 200k)
Earned income credit: $1,440 (reported on 6.5% of returns)
Here:
$1,440
State:
$2,020
(% of AGI for various income ranges: 27.2% for AGIs below $25k, 41.8% for AGIs $25k-50k)
Percentage of individuals using paid preparers for their 2020 taxes: 90.3%
Here:
90%
State:
93%
(% for various income ranges: 87.2% for AGIs below $25k, 90.2% for AGIs $25k-50k, 92.5% for AGIs $50k-75k, 88.6% for AGIs $75k-100k, 92.4% for AGIs $100k-200k, 92.9% for AGIs over 200k)
Averages for the 2012 tax year for zip code 98249, filed in 2013:
Average Adjusted Gross Income (AGI) in 2012: $82,387 (Individual Income Tax Returns)
Here:
$82,387
State:
$69,533
Salary/wage: $54,116 (reported on 64.8% of returns)
Here:
$54,116
State:
$57,267
(% of AGI for various income ranges: 51.3% for AGIs below $25k, 51.1% for AGIs $25k-50k, 54.3% for AGIs $50k-75k, 54.8% for AGIs $75k-100k, 54.9% for AGIs $100k-200k, 24.0% for AGIs over 200k)
Taxable interest for individuals: $2,344 (reported on 50.8% of returns)
This zip code:
$2,344
Washington:
$1,816
(% of AGI for various income ranges: 3.3% for AGIs below $25k, 1.5% for AGIs $25k-50k, 0.9% for AGIs $50k-75k, 1.6% for AGIs $75k-100k, 1.0% for AGIs $100k-200k, 1.6% for AGIs over 200k)
Ordinary dividends: $8,344 (reported on 36.3% of returns)
Here:
$8,344
State:
$8,163
(% of AGI for various income ranges: 6.9% for AGIs below $25k, 3.1% for AGIs $25k-50k, 3.4% for AGIs $50k-75k, 3.5% for AGIs $75k-100k, 2.8% for AGIs $100k-200k, 4.1% for AGIs over 200k)
Net capital gain/loss in AGI: +$24,796 (reported on 31.2% of returns)
Here:
+$24,796
State:
+$21,568
(% of AGI for various income ranges: 1.1% for AGIs $25k-50k, 0.7% for AGIs $50k-75k, 3.1% for AGIs $75k-100k, 2.4% for AGIs $100k-200k, 21.9% for AGIs over 200k)
Profit/loss from business: +$19,150 (reported on 22.7% of returns)
Here:
+$19,150
State:
+$16,521
(% of AGI for various income ranges: 14.6% for AGIs below $25k, 9.5% for AGIs $25k-50k, 5.6% for AGIs $50k-75k, 3.5% for AGIs $75k-100k, 4.7% for AGIs $100k-200k, 3.9% for AGIs over 200k)
Taxable individual retirement arrangement distribution: $22,851 (reported on 22.3% of returns)
98249:
$22,851
Washington:
$18,648
(% of AGI for various income ranges: 7.2% for AGIs below $25k, 6.8% for AGIs $25k-50k, 6.4% for AGIs $50k-75k, 9.9% for AGIs $75k-100k, 7.5% for AGIs $100k-200k, 3.7% for AGIs over 200k)
Self-employment retirement plans: $21,733 (reported on 1.2% of returns)
98249:
$21,733
Washington:
$20,087
Total itemized deductions: $25,974 (19% of AGI, reported on 44.9% of returns)
Here:
$25,974
State:
$23,872
Here:
19.2% of AGI
State:
18.2% of AGI
(% of AGI for various income ranges: 23.7% for AGIs below $25k, 20.7% for AGIs $25k-50k, 17.9% for AGIs $50k-75k, 16.3% for AGIs $75k-100k, 14.8% for AGIs $100k-200k, 9.2% for AGIs over 200k)
Charity contributions: $4,448 (reported on 37.1% of returns)
Here:
$4,448
State:
$4,465
(% of AGI for various income ranges: 1.2% for AGIs below $25k, 1.9% for AGIs $25k-50k, 1.8% for AGIs $50k-75k, 2.0% for AGIs $75k-100k, 1.8% for AGIs $100k-200k, 2.3% for AGIs over 200k)
Taxes paid: $6,592 (reported on 44.9% of returns)
98249:
$6,592
State:
$6,400
(% of AGI for various income ranges: 5.2% for AGIs below $25k, 4.3% for AGIs $25k-50k, 3.7% for AGIs $50k-75k, 4.5% for AGIs $75k-100k, 4.0% for AGIs $100k-200k, 2.6% for AGIs over 200k)
Earned income credit: $1,481 (reported on 10.2% of returns)
Here:
$1,481
State:
$2,073
(% of AGI for various income ranges: 2.9% for AGIs below $25k, 0.5% for AGIs $25k-50k)
Percentage of individuals using paid preparers for their 2012 taxes: 47.7%
Here:
48%
State:
43%
(% for various income ranges: 35.4% for AGIs below $25k, 48.1% for AGIs $25k-50k, 46.2% for AGIs $50k-75k, 56.7% for AGIs $75k-100k, 56.4% for AGIs $100k-200k, 83.3% for AGIs over 200k)
Averages for the 2004 tax year for zip code 98249, filed in 2005:
Average Adjusted Gross Income (AGI) in 2004: $64,769 (Individual Income Tax Returns)
Here:
$64,769
State:
$54,331
Salary/wage: $45,297 (reported on 66.1% of returns)
Here:
$45,297
State:
$45,761
(% of AGI for various income ranges: 95.5% for AGIs below $10k, 51.4% for AGIs $10k-25k, 58.2% for AGIs $25k-50k, 63.5% for AGIs $50k-75k, 58.2% for AGIs $75k-100k, 33.7% for AGIs over 100k)
Taxable interest for individuals: $3,610 (reported on 61.8% of returns)
This zip code:
$3,610
Washington:
$2,110
(% of AGI for various income ranges: 18.7% for AGIs below $10k, 7.6% for AGIs $10k-25k, 3.1% for AGIs $25k-50k, 2.3% for AGIs $50k-75k, 2.5% for AGIs $75k-100k, 3.5% for AGIs over 100k)
Taxable dividends: $6,649 (reported on 40.9% of returns)
Here:
$6,649
State:
$5,879
(% of AGI for various income ranges: 20.5% for AGIs below $10k, 5.9% for AGIs $10k-25k, 3.0% for AGIs $25k-50k, 3.7% for AGIs $50k-75k, 2.7% for AGIs $75k-100k, 4.6% for AGIs over 100k)
Net capital gain/loss: +$16,996 (reported on 37.7% of returns)
Here:
+$16,996
State:
+$15,835
(% of AGI for various income ranges: -11.0% for AGIs below $10k, 2.0% for AGIs $10k-25k, 1.6% for AGIs $25k-50k, 2.8% for AGIs $50k-75k, 5.6% for AGIs $75k-100k, 16.3% for AGIs over 100k)
Profit/loss from business: +$18,058 (reported on 24.4% of returns)
Here:
+$18,058
State:
+$13,994
(% of AGI for various income ranges: 19.6% for AGIs below $10k, 11.7% for AGIs $10k-25k, 9.4% for AGIs $25k-50k, 7.2% for AGIs $50k-75k, 6.4% for AGIs $75k-100k, 5.5% for AGIs over 100k)
IRA payment deduction: $3,473 (reported on 5.0% of returns)
98249:
$3,473
Washington:
$3,001
(% of AGI for various income ranges: 0.7% for AGIs $10k-25k, 0.4% for AGIs $25k-50k, 0.4% for AGIs $50k-75k, 0.3% for AGIs $75k-100k, 0.2% for AGIs over 100k)
Self-employed pension: $10,705 (reported on 1.9% of returns)
Here:
$10,705
Washington:
$14,244
(% of AGI for various income ranges: 1.0% for AGIs $10k-25k, 0.6% for AGIs $50k-75k, 0.3% for AGIs over 100k)
Total itemized deductions: $21,087 (22% of AGI, reported on 48.1% of returns)
Here:
$21,087
State:
$19,669
Here:
22.3% of AGI
State:
20.7% of AGI
(% of AGI for various income ranges: 62.6% for AGIs below $10k, 28.5% for AGIs $10k-25k, 19.7% for AGIs $25k-50k, 18.5% for AGIs $50k-75k, 18.6% for AGIs $75k-100k, 11.2% for AGIs over 100k)
Charity contributions deductions: $3,471 (3% of AGI, reported on 41.6% of returns)
Here:
$3,471
State:
$3,569
Here:
3.2% of AGI
State:
3.5% of AGI
(% of AGI for various income ranges: 2.1% for AGIs below $10k, 2.1% for AGIs $10k-25k, 2.0% for AGIs $25k-50k, 2.2% for AGIs $50k-75k, 2.6% for AGIs $75k-100k, 2.2% for AGIs over 100k)
Total tax: $10,669 (reported on 80.4% of returns)
98249:
$10,669
State:
$9,065
(% of AGI for various income ranges: 6.4% for AGIs below $10k, 5.0% for AGIs $10k-25k, 7.7% for AGIs $25k-50k, 9.4% for AGIs $50k-75k, 10.9% for AGIs $75k-100k, 17.3% for AGIs over 100k)
Earned income credit: $1,249 (reported on 9.1% of returns)
Here:
$1,249
State:
$1,607
Percentage of individuals using paid preparers for their 2004 taxes: 54.9%
Here:
55%
State:
49%
(% for various income ranges: 47.0% for AGIs below $10k, 53.9% for AGIs $10k-25k, 55.9% for AGIs $25k-50k, 51.8% for AGIs $50k-75k, 55.9% for AGIs $75k-100k, 68.5% for AGIs over 100k)
Likely homosexual households (counted as self-reported same-sex unmarried-partner households)
Lesbian couples: 0.3% of all households
Gay men: 0.7% of all households
Household received Food Stamps/SNAP in the past 12 months: 109 Household did not receive Food Stamps/SNAP in the past 12 months: 2,037
Women who had a birth in the past 12 months: 13 (14 now married, 0 unmarried) Women who did not have a birth in the past 12 months: 570 (370 now married, 196 unmarried)
Housing units in zip code 98249 with a mortgage: 1,077 (106 second mortgage, 87 both second mortgage and home equity loan) Median monthly owner costs for units with a mortgage: $1,952 Median monthly owner costs for units without a mortgage: $736
Residents with income below the poverty level in 2022:
This zip code:
6.8%
Whole state:
10.0%
Residents with income below 50% of the poverty level in 2022:
This zip code:
4.2%
Whole state:
4.6%
Median number of rooms in houses and condos:
Here:
6.2
State:
6.5
Median number of rooms in apartments:
Here:
4.9
State:
3.9
Notable locations in this zip code not listed on our city pages
Notable locations in zip code 98249: Freeland Landfill (A), Bush Point Boat Launch (B), Mutiny Bay Boat Launch (C), Holmes Harbor Golf and Beach Club (D), Double Bluff Light (E), Bush Point Light (F), Holmes Harbor Wastewater Treatment Plant (G), Island County Fire District 3 (H), Freeland Library (I). Display/hide their locations on the map
Churches in zip code 98249 include: Christian Life Ministry Center (A), Tahoma One Drop Zen Monastery (B), Saint Augustines in the Woods Episcopal Church (C), Trinity Lutheran Church (D). Display/hide their locations on the map
In group quarters: 4 (-1 institutionalized population)
Size of family households: 787 2-persons, 215 3-persons, 144 4-persons, 34 5-persons, 26 7-or-more-persons
Size of nonfamily households: 794 1-person, 163 2-persons
552 married couples with children.
6 single-parent households (6 men).
94.5% of residents of 98249 zip code speak English at home.
2.5% of residents speak Spanish at home (66% very well, 25% well, 9% not well).
1.6% of residents speak other Indo-European language at home (100% very well).
0.8% of residents speak Asian or Pacific Island language at home (100% very well).
1.2% of residents speak other language at home (100% very well).
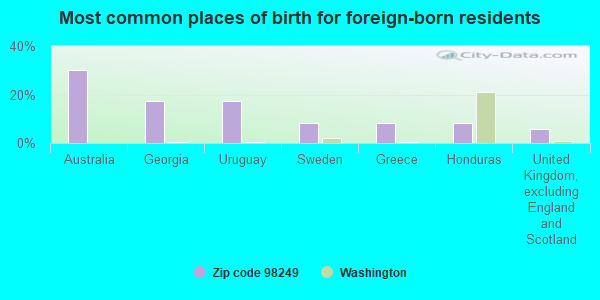
Foreign born population: 226 (5.1%) (46.9% of them are naturalized citizens)
This zip code:
5.1%
Whole state:
15.3%
30%Australia
17%Georgia
17%Uruguay
8%Sweden
8%Greece
8%Honduras
6%United Kingdom, excluding England and Scotland
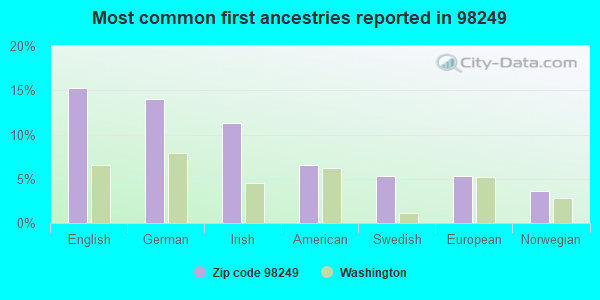
15%English
14%German
11%Irish
7%American
5%Swedish
5%European
4%Norwegian
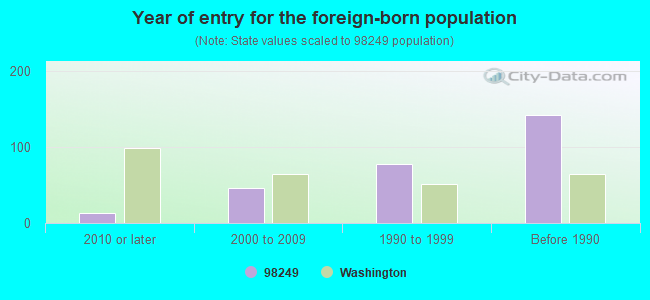
Year of entry for the foreign-born population
132010 or later
462000 to 2009
771990 to 1999
142Before 1990
Housing units lacking complete kitchen facilities: 1.3%
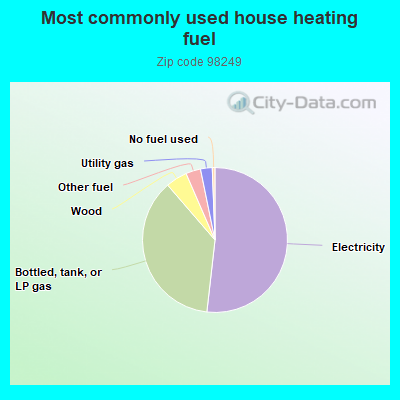
51.7%Electricity
36.8%Bottled, tank, or LP gas
4.8%Wood
3.3%Other fuel
2.6%Utility gas
0.6%No fuel used
Population in 1990: 2,321. Population change in the 1990s: +1,369 (+59.0%).
Place of birth for U.S.-born residents:
This state: 1,845
Northeast: 280
Midwest: 610
South: 441
West: 933
53% of the 98249 zip code residents lived in the same house 5 years ago. Out of people who lived in different houses, 40% lived in this county. Out of people who lived in different counties, 50% lived in Washington.
93% of the 98249 zip code residents lived in the same house 1 year ago. Out of people who lived in different houses, 45% moved from this county. Out of people who lived in different houses, 52% moved from different county within same state. Out of people who lived in different houses, 9% moved from different state.
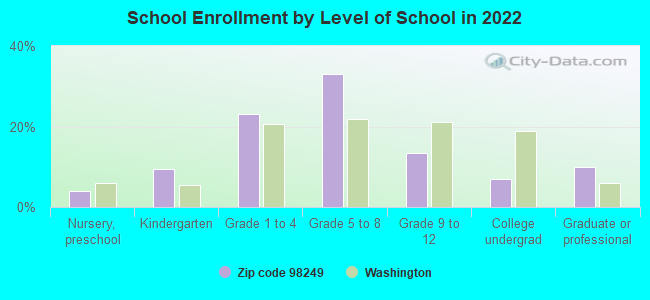
Private vs. public school enrollment:
Students in private schools in grades 1 to 8 (elementary and middle school): 71
Here:
21.6%
Washington:
12.4%
Students in private schools in grades 9 to 12 (high school):
Here:
0.0%
Washington:
9.2%
Students in private undergraduate colleges: 14
Here:
34.5%
Washington:
16.5%
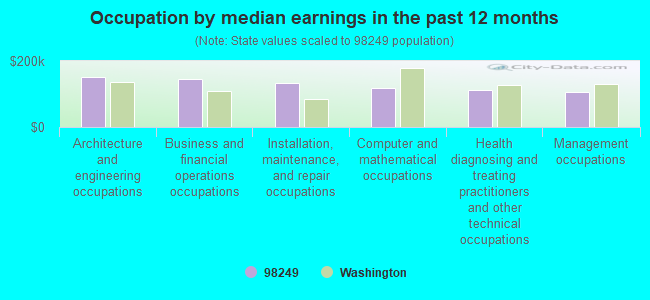
Occupation by median earnings in the past 12 months ($)
152,761Architecture and engineering occupations
145,863Business and financial operations occupations
132,236Installation, maintenance, and repair occupations
118,932Computer and mathematical occupations
112,332Health diagnosing and treating practitioners and other technical occupations
104,739Management occupations
Companies with federal contracts located in this zip code:
MUTINY BAY SOFTWARE, LLC (5645 CARIE LANE in FREELAND, WA; small business) : $99,840 in 5 contractsfrom 2004 to 2005
Contracts for ADP Data Conversion Services by Public Health Service Signed by year:2000: $0; 2001: $0; 2002: $0; 2003: $0; 2004: $74,880; 2005: $24,960; 2006: $0.
Biggest contracts:
$24,960 with Public Health Service for ADP Data Conversion Services. Taking place in SD. Signed on 2005-01-12. Effective on 2005-02-22. Completion date: 2005-04-30.
$24,960, same as above.Signed on 2004-03-03. Completion date: 2005-02-22.
$24,960, same as above.Signed on 2004-09-29. Effective on 2004-03-03. Completion date: 2005-02-22.
$24,960, same as above.Signed on 2004-06-08. Effective on 2004-03-03. Completion date: 2005-02-22.
Top industries in this zip code by the number of employees in 2005:
Health Care and Social Assistance: Services for the Elderly and Persons with Disabilities (100-249 employees: 1 establishment)
2003 - 2018 National Fire Incident Reporting System (NFIRS) incidents
According to the data from the years 2003 - 2018 the average number of fire incidents per year is 20. The highest number of fires - 37 took place in 2007, and the least - 9 in 2016. The data has a decreasing trend.
When looking into fire subcategories, the most reports belonged to: Outside Fires (45.5%), and Structure Fires (37.4%).
Fire incident types reported to NFIRS in Zip Code 98249
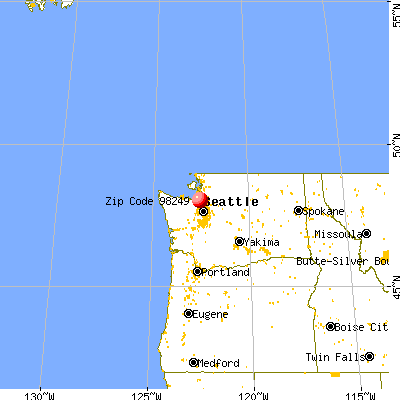


 Nearest zip codes: 98253, 98260, 98340, 98236, 98364, 98358.
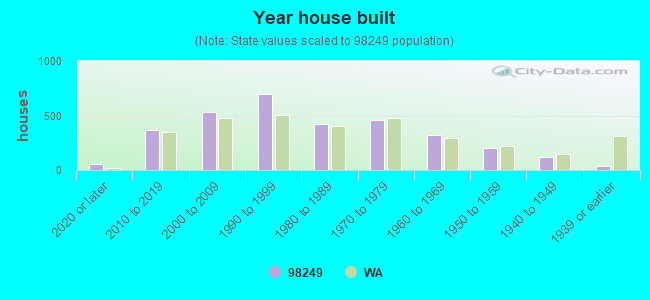


 : $99,840 in 5 contracts from 2004 to 2005
 According to the data from the years 2003 - 2018 the average number of fire incidents per year is 20. The highest number of fires - 37 took place in 2007, and the least - 9 in 2016. The data has a decreasing trend.
 When looking into fire subcategories, the most reports belonged to: Outside Fires (45.5%), and Structure Fires (37.4%).