Estimated zip code population in 2022: 7,657 Zip code population in 2010: 7,233 Zip code population in 2000: 7,778
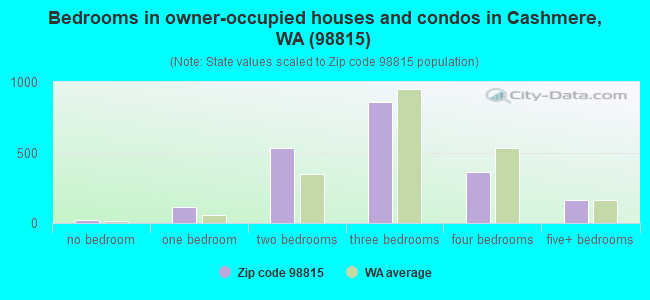
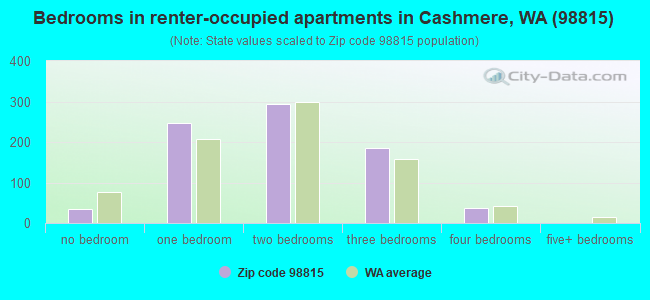
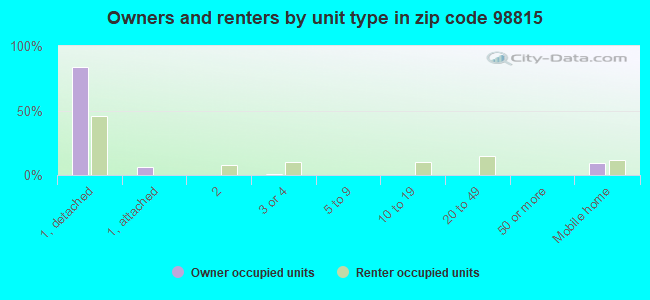
Houses and condos: 3,067 Renter-occupied apartments: 802
% of renters here:
28%
State:
36%
March 2022 cost of living index in zip code 98815: 98.2 (near average, U.S. average is 100)
Land area: 118.8 sq. mi. Water area: 0.3 sq. mi.
Population density: 64 people per square mile
(very low).
OSM Map
General Map
Google Map
MSN Map
OSM Map
General Map
Google Map
MSN Map
OSM Map
General Map
Google Map
MSN Map
OSM Map
General Map
Google Map
MSN Map
Please wait while loading the map...
Real estate property taxes paid for housing units in 2022:
This zip code:
0.6% ($3,580)
Washington:
0.8% ($4,283)
Median real estate property taxes paid for housing units with mortgages in 2022: $3,758 (0.6%) Median real estate property taxes paid for housing units with no mortgage in 2022: $2,960 (0.7%)
Business Search- 14 Million verified businesses
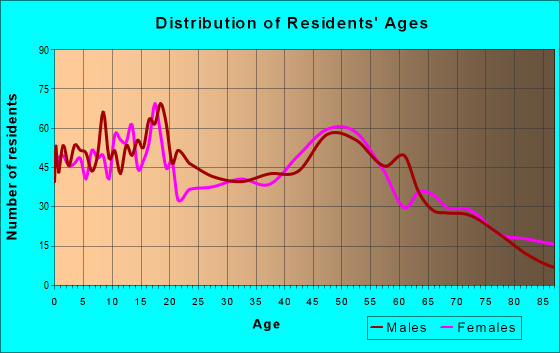
Males: 3,907
(51.0%)
Females: 3,750
(49.0%)
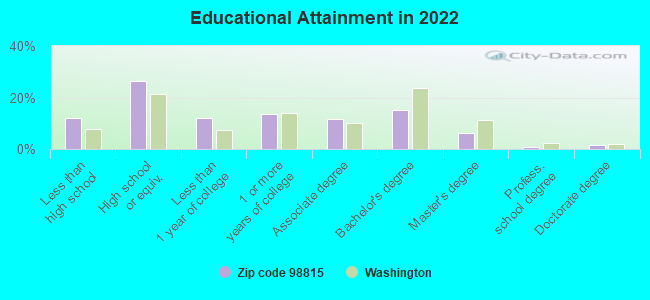
For population 25 years and over in 98815:
High school or higher: 86.2%
Bachelor's degree or higher: 23.5%
Graduate or professional degree: 8.6%
Unemployed: 2.4%
Mean travel time to work (commute): 20.2 minutes
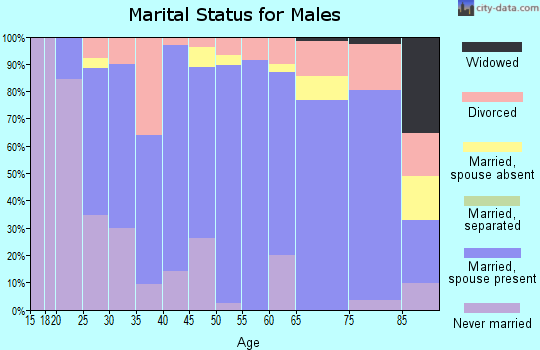
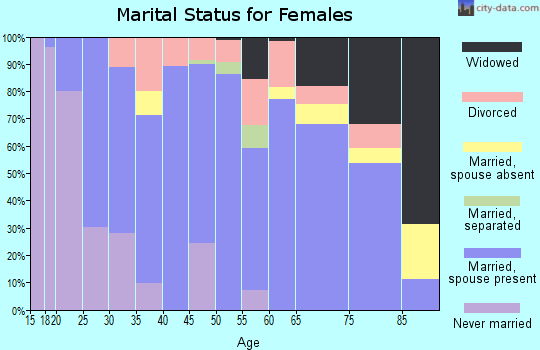
For population 15 years and over in 98815:
Never married: 24.7%
Now married: 52.4%
Separated: 2.5%
Widowed: 8.2%
Divorced: 12.1%
Zip code 98815 compared to state average:
Black race population percentage significantly below state average.
Median age above state average.
Length of stay since moving in significantly above state average.
Percentage of population with a bachelor's degree or higher below state average.
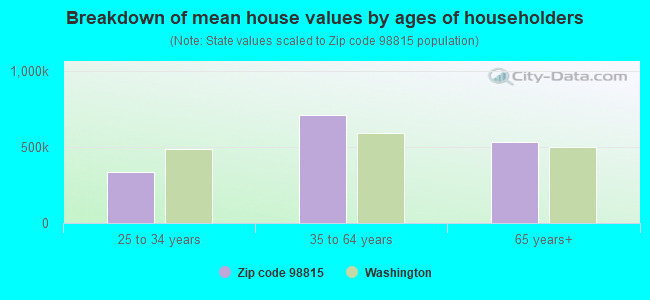
Estimated median house/condo value in 2022: $574,432
98815:
$574,432
Washington:
$569,500
Median resident age:
This zip code:
44.1 years
Washington median age:
38.4 years
Average household size:
This zip code:
2.6 people
Washington:
2.5 people
Averages for the 2020 tax year for zip code 98815, filed in 2021:
Average Adjusted Gross Income (AGI) in 2020: $66,136 (Individual Income Tax Returns)
Here:
$66,136
State:
$99,264
Salary/wage: $54,001 (reported on 84.1% of returns)
Here:
$54,001
State:
$80,347
(% of AGI for various income ranges: 1524.6% for AGIs below $25k, 3644.7% for AGIs $25k-50k, 6345.6% for AGIs $50k-75k, 9745.0% for AGIs $75k-100k, 19168.5% for AGIs $100k-200k, 65407.5% for AGIs over 200k)
Taxable interest for individuals: $1,515 (reported on 31.6% of returns)
This zip code:
$1,515
Washington:
$2,077
(% of AGI for various income ranges: 20.3% for AGIs below $25k, 21.7% for AGIs $25k-50k, 29.7% for AGIs $50k-75k, 112.1% for AGIs $75k-100k, 184.4% for AGIs $100k-200k, 1327.5% for AGIs over 200k)
Ordinary dividends: $6,135 (reported on 16.8% of returns)
Here:
$6,135
State:
$10,013
(% of AGI for various income ranges: 28.6% for AGIs below $25k, 45.7% for AGIs $25k-50k, 80.5% for AGIs $50k-75k, 165.8% for AGIs $75k-100k, 515.9% for AGIs $100k-200k, 2625.0% for AGIs over 200k)
Net capital gain/loss in AGI: +$23,155 (reported on 15.6% of returns)
Here:
+$23,155
State:
+$40,092
(% of AGI for various income ranges: 20.3% for AGIs below $25k, 44.1% for AGIs $25k-50k, 108.2% for AGIs $50k-75k, 173.8% for AGIs $75k-100k, 949.6% for AGIs $100k-200k, 22772.5% for AGIs over 200k)
Profit/loss from business: +$17,307 (reported on 11.5% of returns)
Here:
+$17,307
State:
+$18,312
(% of AGI for various income ranges: 58.5% for AGIs below $25k, 120.6% for AGIs $25k-50k, 142.1% for AGIs $50k-75k, 266.7% for AGIs $75k-100k, 897.4% for AGIs $100k-200k, 5535.0% for AGIs over 200k)
Taxable individual retirement arrangement distribution: $18,838 (reported on 8.1% of returns)
98815:
$18,838
Washington:
$24,221
(% of AGI for various income ranges: 51.9% for AGIs below $25k, 74.9% for AGIs $25k-50k, 181.0% for AGIs $50k-75k, 220.4% for AGIs $75k-100k, 627.8% for AGIs $100k-200k, 4087.5% for AGIs over 200k)
Total itemized deductions: $32,233 (reported on 6.7% of returns)
Here:
$32,233
State:
$39,068
(% of AGI for various income ranges: 116.3% for AGIs $25k-50k, 213.3% for AGIs $50k-75k, 440.0% for AGIs $75k-100k, 1061.1% for AGIs $100k-200k, 5422.5% for AGIs over 200k)
Charity contributions: $10,822 (reported on 5.0% of returns)
Here:
$10,822
State:
$15,331
(% of AGI for various income ranges: 24.7% for AGIs $25k-50k, 97.1% for AGIs $75k-100k, 298.9% for AGIs $100k-200k, 1837.5% for AGIs over 200k)
Taxes paid: $7,121 (reported on 6.7% of returns)
98815:
$7,121
State:
$7,774
(% of AGI for various income ranges: 16.3% for AGIs $25k-50k, 56.7% for AGIs $50k-75k, 94.2% for AGIs $75k-100k, 247.4% for AGIs $100k-200k, 1200.0% for AGIs over 200k)
Earned income credit: $1,967 (reported on 13.4% of returns)
Here:
$1,967
State:
$2,020
(% of AGI for various income ranges: 56.1% for AGIs below $25k, 77.1% for AGIs $25k-50k)
Percentage of individuals using paid preparers for their 2020 taxes: 92.2%
Here:
92%
State:
93%
(% for various income ranges: 88.1% for AGIs below $25k, 92.5% for AGIs $25k-50k, 94.2% for AGIs $50k-75k, 97.2% for AGIs $75k-100k, 94.2% for AGIs $100k-200k, 93.8% for AGIs over 200k)
Averages for the 2012 tax year for zip code 98815, filed in 2013:
Average Adjusted Gross Income (AGI) in 2012: $47,461 (Individual Income Tax Returns)
Here:
$47,461
State:
$69,533
Salary/wage: $40,200 (reported on 84.9% of returns)
Here:
$40,200
State:
$57,267
(% of AGI for various income ranges: 80.3% for AGIs below $25k, 78.5% for AGIs $25k-50k, 76.8% for AGIs $50k-75k, 79.3% for AGIs $75k-100k, 69.1% for AGIs $100k-200k, 42.8% for AGIs over 200k)
Taxable interest for individuals: $1,674 (reported on 36.9% of returns)
This zip code:
$1,674
Washington:
$1,816
(% of AGI for various income ranges: 2.2% for AGIs below $25k, 1.4% for AGIs $25k-50k, 0.9% for AGIs $50k-75k, 1.3% for AGIs $75k-100k, 1.1% for AGIs $100k-200k, 1.4% for AGIs over 200k)
Ordinary dividends: $5,442 (reported on 15.1% of returns)
Here:
$5,442
State:
$8,163
(% of AGI for various income ranges: 2.8% for AGIs below $25k, 0.8% for AGIs $25k-50k, 1.5% for AGIs $50k-75k, 1.0% for AGIs $75k-100k, 2.1% for AGIs $100k-200k, 2.8% for AGIs over 200k)
Net capital gain/loss in AGI: +$10,049 (reported on 11.0% of returns)
Here:
+$10,049
State:
+$21,568
(% of AGI for various income ranges: 0.4% for AGIs $25k-50k, 1.4% for AGIs $50k-75k, 3.2% for AGIs $100k-200k, 10.2% for AGIs over 200k)
Profit/loss from business: +$11,405 (reported on 12.3% of returns)
Here:
+$11,405
State:
+$16,521
(% of AGI for various income ranges: 3.8% for AGIs below $25k, 2.5% for AGIs $25k-50k, 1.9% for AGIs $50k-75k, 2.5% for AGIs $75k-100k, 5.4% for AGIs $100k-200k)
Taxable individual retirement arrangement distribution: $11,122 (reported on 8.5% of returns)
98815:
$11,122
Washington:
$18,648
(% of AGI for various income ranges: 2.0% for AGIs below $25k, 1.9% for AGIs $25k-50k, 1.5% for AGIs $50k-75k, 2.5% for AGIs $75k-100k, 3.1% for AGIs $100k-200k)
Total itemized deductions: $20,633 (23% of AGI, reported on 24.6% of returns)
Here:
$20,633
State:
$23,872
Here:
22.5% of AGI
State:
18.2% of AGI
(% of AGI for various income ranges: 8.8% for AGIs below $25k, 8.8% for AGIs $25k-50k, 11.3% for AGIs $50k-75k, 12.8% for AGIs $75k-100k, 12.5% for AGIs $100k-200k, 8.2% for AGIs over 200k)
Charity contributions: $4,668 (reported on 17.7% of returns)
Here:
$4,668
State:
$4,465
(% of AGI for various income ranges: 0.5% for AGIs below $25k, 0.7% for AGIs $25k-50k, 1.6% for AGIs $50k-75k, 2.3% for AGIs $75k-100k, 2.3% for AGIs $100k-200k, 2.9% for AGIs over 200k)
Taxes paid: $4,948 (reported on 24.3% of returns)
98815:
$4,948
State:
$6,400
(% of AGI for various income ranges: 1.3% for AGIs below $25k, 1.9% for AGIs $25k-50k, 2.7% for AGIs $50k-75k, 3.0% for AGIs $75k-100k, 3.3% for AGIs $100k-200k, 2.4% for AGIs over 200k)
Earned income credit: $2,160 (reported on 18.0% of returns)
Here:
$2,160
State:
$2,073
(% of AGI for various income ranges: 4.9% for AGIs below $25k, 1.4% for AGIs $25k-50k)
Percentage of individuals using paid preparers for their 2012 taxes: 45.1%
Here:
45%
State:
43%
(% for various income ranges: 39.4% for AGIs below $25k, 44.9% for AGIs $25k-50k, 50.0% for AGIs $50k-75k, 48.1% for AGIs $75k-100k, 57.1% for AGIs $100k-200k, 80.0% for AGIs over 200k)
Averages for the 2004 tax year for zip code 98815, filed in 2005:
Average Adjusted Gross Income (AGI) in 2004: $36,968 (Individual Income Tax Returns)
Here:
$36,968
State:
$54,331
Salary/wage: $32,482 (reported on 83.7% of returns)
Here:
$32,482
State:
$45,761
(% of AGI for various income ranges: 223.0% for AGIs below $10k, 76.5% for AGIs $10k-25k, 80.1% for AGIs $25k-50k, 77.1% for AGIs $50k-75k, 74.0% for AGIs $75k-100k, 53.5% for AGIs over 100k)
Taxable interest for individuals: $1,785 (reported on 45.9% of returns)
This zip code:
$1,785
Washington:
$2,110
(% of AGI for various income ranges: 24.6% for AGIs below $10k, 3.0% for AGIs $10k-25k, 2.1% for AGIs $25k-50k, 1.2% for AGIs $50k-75k, 1.7% for AGIs $75k-100k, 2.2% for AGIs over 100k)
Taxable dividends: $3,678 (reported on 20.2% of returns)
Here:
$3,678
State:
$5,879
(% of AGI for various income ranges: 10.4% for AGIs below $10k, 1.6% for AGIs $10k-25k, 1.4% for AGIs $25k-50k, 1.0% for AGIs $50k-75k, 1.6% for AGIs $75k-100k, 3.7% for AGIs over 100k)
Net capital gain/loss: +$8,763 (reported on 17.5% of returns)
Here:
+$8,763
State:
+$15,835
(% of AGI for various income ranges: -3.6% for AGIs below $10k, 0.3% for AGIs $10k-25k, 0.6% for AGIs $25k-50k, 1.8% for AGIs $50k-75k, 3.9% for AGIs $75k-100k, 13.1% for AGIs over 100k)
Profit/loss from business: +$10,944 (reported on 13.4% of returns)
Here:
+$10,944
State:
+$13,994
(% of AGI for various income ranges: -2.9% for AGIs below $10k, 3.2% for AGIs $10k-25k, 2.4% for AGIs $25k-50k, 5.7% for AGIs $50k-75k, 4.5% for AGIs $75k-100k, 4.3% for AGIs over 100k)
Profit/loss from farming: +$2,373 (reported on 3.6% of returns)
Here:
+$2,373
State:
-$6,197
(% of AGI for various income ranges: -9.9% for AGIs below $10k, -0.7% for AGIs $10k-25k, 0.0% for AGIs $25k-50k, -0.2% for AGIs $75k-100k, 2.1% for AGIs over 100k)
IRA payment deduction: $3,595 (reported on 3.0% of returns)
98815:
$3,595
Washington:
$3,001
(% of AGI for various income ranges: 2.2% for AGIs below $10k, 0.3% for AGIs $25k-50k, 0.3% for AGIs $50k-75k, 0.4% for AGIs $75k-100k, 0.3% for AGIs over 100k)
Self-employed pension: $7,375 (reported on 0.6% of returns)
Here:
$7,375
Washington:
$14,244
Total itemized deductions: $16,529 (25% of AGI, reported on 26.5% of returns)
Here:
$16,529
State:
$19,669
Here:
25.2% of AGI
State:
20.7% of AGI
(% of AGI for various income ranges: 26.1% for AGIs below $10k, 9.8% for AGIs $10k-25k, 11.1% for AGIs $25k-50k, 13.1% for AGIs $50k-75k, 13.6% for AGIs $75k-100k, 10.8% for AGIs over 100k)
Charity contributions deductions: $3,099 (4% of AGI, reported on 21.6% of returns)
Here:
$3,099
State:
$3,569
Here:
4.4% of AGI
State:
3.5% of AGI
(% of AGI for various income ranges: 1.6% for AGIs below $10k, 1.0% for AGIs $10k-25k, 1.6% for AGIs $25k-50k, 2.0% for AGIs $50k-75k, 1.8% for AGIs $75k-100k, 2.4% for AGIs over 100k)
Total tax: $4,929 (reported on 69.6% of returns)
98815:
$4,929
State:
$9,065
(% of AGI for various income ranges: 5.5% for AGIs below $10k, 3.7% for AGIs $10k-25k, 5.6% for AGIs $25k-50k, 8.6% for AGIs $50k-75k, 10.1% for AGIs $75k-100k, 16.7% for AGIs over 100k)
Earned income credit: $1,826 (reported on 16.3% of returns)
Here:
$1,826
State:
$1,607
Percentage of individuals using paid preparers for their 2004 taxes: 47.1%
Here:
47%
State:
49%
(% for various income ranges: 41.3% for AGIs below $10k, 43.2% for AGIs $10k-25k, 47.1% for AGIs $25k-50k, 49.0% for AGIs $50k-75k, 57.7% for AGIs $75k-100k, 70.3% for AGIs over 100k)
Household received Food Stamps/SNAP in the past 12 months: 219 Household did not receive Food Stamps/SNAP in the past 12 months: 2,629
Women who had a birth in the past 12 months: 148 (130 now married, 20 unmarried) Women who did not have a birth in the past 12 months: 1,460 (634 now married, 827 unmarried)
Housing units in zip code 98815 with a mortgage: 1,394 (177 second mortgage, 148 both second mortgage and home equity loan) Median monthly owner costs for units with a mortgage: $2,071 Median monthly owner costs for units without a mortgage: $505
Residents with income below the poverty level in 2022:
This zip code:
10.6%
Whole state:
10.0%
Residents with income below 50% of the poverty level in 2022:
This zip code:
6.0%
Whole state:
4.6%
Median number of rooms in houses and condos:
Here:
6.2
State:
6.5
Median number of rooms in apartments:
Here:
3.8
State:
3.9
Notable locations in this zip code not listed on our city pages
Notable locations in zip code 98815: Pine Campground (A), Cashmere Landfill (B), Chelan County Exposition Center (C), Meadow Campground (D), Cashmere Sewage Treatment Plant (E), Spring Campground (F), Willis Carey Historical Museum (G), Cashmere Convalescent Center (H). Display/hide their locations on the map
Churches in zip code 98815 include: Cashmere Seventh Day Adventist Church (A), Evergreen Baptist Church (B), Life Trac Family Ministries (C), United Methodist Foundation of the Northwest (D), Cashmere Church of Christ (E), Cashmere Presbyterian Church (F), Cashmere United Methodist Church (G), Faith Church of God (H), Grace Lutheran Church (I). Display/hide their locations on the map
Streams, rivers, and creeks: Bear Gulch (A), Brender Creek (B), Little Camas Creek (C), Mission Creek (D), Sand Creek (E). Display/hide their locations on the map
Parks in zip code 98815 include: John Simpson Memorial Park (1), Natatoruim Park (2), Ardetta Park (3), Cashmere Avenue Park (4). Display/hide their locations on the map
In group quarters: 218 (-1 institutionalized population)
Size of family households: 784 2-persons, 475 3-persons, 395 4-persons, 201 5-persons, 61 6-persons, 17 7-or-more-persons
Size of nonfamily households: 722 1-person, 179 2-persons, 3 3-persons
1,381 married couples with children.
236 single-parent households (84 men, 152 women).
82.1% of residents of 98815 zip code speak English at home.
14.7% of residents speak Spanish at home (37% very well, 23% well, 14% not well, 26% not at all).
2.1% of residents speak other Indo-European language at home (100% very well).
1.2% of residents speak Asian or Pacific Island language at home (42% very well, 44% well, 8% not well, 6% not at all).
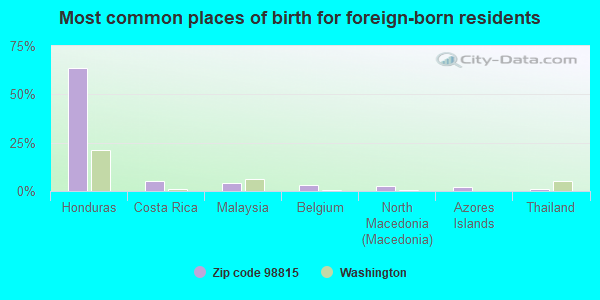
Foreign born population: 902 (11.8%) (50.0% of them are naturalized citizens)
This zip code:
11.8%
Whole state:
15.3%
64%Honduras
5%Costa Rica
4%Malaysia
3%Belgium
3%North Macedonia (Macedonia)
2%Azores Islands
1%Thailand
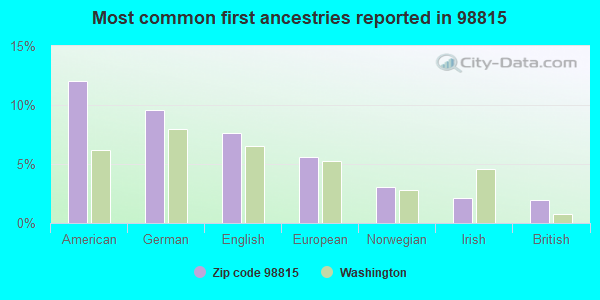
12%American
10%German
8%English
6%European
3%Norwegian
2%Irish
2%British
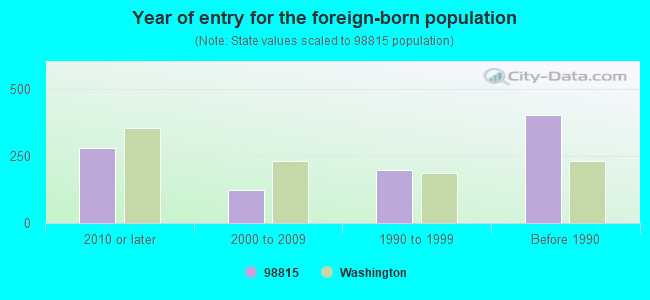
Year of entry for the foreign-born population
2802010 or later
1232000 to 2009
1991990 to 1999
403Before 1990
Facilities with environmental interests located in this zip code:
CASHMERE HIGH SCHOOL (329 TIGNER RD in CASHMERE, WA)
(Geographic Names Information System) (National Center for Education Statistics) - STATE ID-3268 STATE MASTER (Washington State Department of Ecology's Facility/Site identification system) - TOXICS-, GROUND WATER PROGRAM Organizations: CASHMERE SCHOOL DIST 222 (SCHOOL DISTRICT)
CASHMERE CLEANERS (312 RIVER ST in CASHMERE, WA)
(Resource Conservation and Recovery Act (tracking hazardous waste)) STATE MASTER (Washington State Department of Ecology's Facility/Site identification system) - TOXICS-962, UNDERGROUND STORAGE TANK PROGRAM Business SIC classification: GASOLINE SERVICE STATIONS; NONCLASSIFIABLE ESTABLISHMENTS
CASHMERE WASTEWATER TREATMENT PLANT (101 WOODRING STREET in CASHMERE, WA)
National Pollutant Discharge Elimination System NON-MAJOR (Tracking pollutant discharge elimination systems) - permit (Resource Conservation and Recovery Act (tracking hazardous waste)) STATE MASTER (Washington State Department of Ecology's Facility/Site identification system) - HAZWASTE-WAR000007518, CESQG, TOXICS-2431, LEAKING STORAGE TANK, UNDERGROUND STORAGE TANK PROGRAM, WATQUAL-WA0023183, NPDES NON-MAJOR Business SIC classification: FABRICATED STRUCTURAL METAL; SEWERAGE SYSTEMS; NONCLASSIFIABLE ESTABLISHMENTS Organizations: COULEE DAM CITY (CONTACT/OPERATOR)
, CASHMERE CITY (CONTACT/OWNER)
Alternative names: CASHMERE CITY, CASHMERE, CITY OF, CASHMERE STP
BLUE STAR GROWERS INC PLANT 1 (200 BLUE STAR ROAD in CASHMERE, WA)
National Pollutant Discharge Elimination System NON-MAJOR (Tracking pollutant discharge elimination systems) - permit STATE MASTER (Washington State Department of Ecology's Facility/Site identification system) - TOXICS-100804, UNDERGROUND STORAGE TANK PROGRAM, HAZWASTE-CRK000029040, EPCRA, WATQUAL-WAG435140, NPDES NON-MAJOR Business SIC classification: CROP PREPARATION SERVICES FOR MARKET, EXCEPT COTTON GINNING; REFRIGERATED WAREHOUSING AND STORAGE Alternative names: BLUE STAR GROWERS INC BLUE STA, BLUE STAR GROWERS INC BLUE STAR WY
BETHLEHEM CONSTRUCTION INC CASHMERE (5505 TITCHENAL RD in CASHMERE, WA)
National Pollutant Discharge Elimination System NON-MAJOR (Tracking pollutant discharge elimination systems) - permit STATE MASTER (Washington State Department of Ecology's Facility/Site identification system) - WATQUAL-WAG505151, National Pollutant Discharge Elimination System Permit Business SIC classification: EXCAVATION WORK; CONCRETE PRODUCTS, EXCEPT BLOCK AND BRICK; READY-MIXED CONCRETE Alternative names: BETHLEHEM CONSTRUCTION & GRAVE
CASHMERE MIDDLE SCHOOL (300 TIGNER RD in CASHMERE, WA)
(Geographic Names Information System) (National Center for Education Statistics) - STATE ID-2315 Organizations: CASHMERE SCHOOL DIST 222 (SCHOOL DISTRICT)
CEDARBROOK LUMBER (SUNSET AVE& MILL RD in CASHMERE, WA)
CRITERIA AND HAZARDOUS AIR POLLUTANT INVENTORY (Inventory of air pollution sources) STATE MASTER (Washington State Department of Ecology's Facility/Site identification system) - AIRQUAL-, AIR MINOR Business SIC classification: SAWMILLS AND PLANING MILLS, GENERAL
CASHMERE LANDFILL (0.1 MILE EAST OF DIVISION STREET in CASHMERE, WA)
CRITERIA AND HAZARDOUS AIR POLLUTANT INVENTORY (Inventory of air pollution sources) STATE MASTER (Washington State Department of Ecology's Facility/Site identification system) - TOXICS-, GROUND WATER PROGRAM Business SIC classification: REFUSE SYSTEMS Business NAICS classification: SOLID WASTE LANDFILL.
CASHMERE SD 222 (210 S DIVISION ST in CASHMERE, WA)
COMPLIANCE ACTIVITY (Tracking inspections of insecticide, fungicide, and rodenticide, and toxic substances)
CASHMERE PIONEER FRUIT GROWERS (309 MISSION AVE in CASHMERE, WA)
COMPLIANCE ACTIVITY (Tracking inspections of insecticide, fungicide, and rodenticide, and toxic substances)
Housing units lacking complete plumbing facilities: 0.5% Housing units lacking complete kitchen facilities: 0.7%
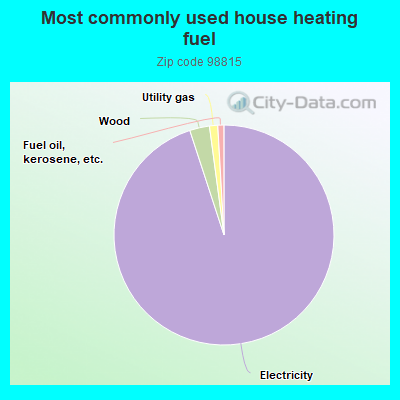
94.6%Electricity
2.9%Wood
1.2%Utility gas
0.9%Fuel oil, kerosene, etc.
Population in 1990: 7,504. Population change in the 1990s: +274 (+3.7%).
Place of birth for U.S.-born residents:
This state: 4,745
Northeast: 116
Midwest: 393
South: 327
West: 1,040
55% of the 98815 zip code residents lived in the same house 5 years ago. Out of people who lived in different houses, 65% lived in this county. Out of people who lived in different counties, 50% lived in Washington.
94% of the 98815 zip code residents lived in the same house 1 year ago. Out of people who lived in different houses, 59% moved from this county. Out of people who lived in different houses, 33% moved from different county within same state. Out of people who lived in different houses, 1% moved from different state. Out of people who lived in different houses, 14% moved from abroad.
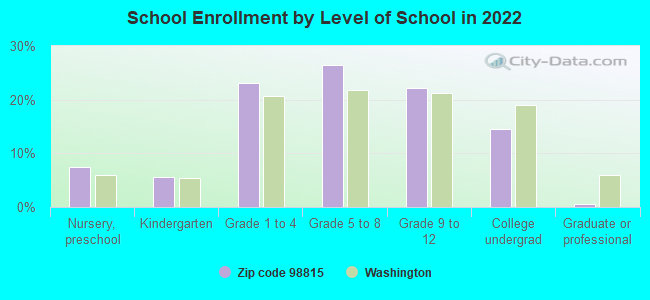
Private vs. public school enrollment:
Students in private schools in grades 1 to 8 (elementary and middle school): 105
Here:
12.0%
Washington:
12.4%
Students in private schools in grades 9 to 12 (high school): 10
Here:
2.7%
Washington:
9.2%
Students in private undergraduate colleges: 31
Here:
12.0%
Washington:
16.5%
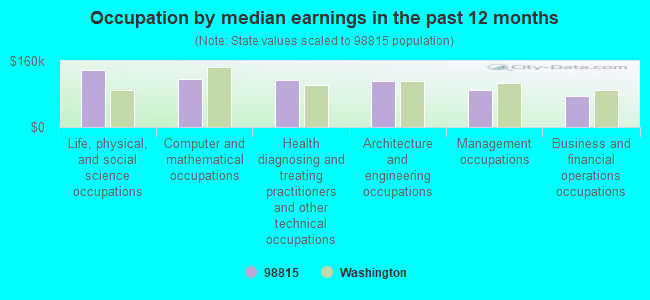
Occupation by median earnings in the past 12 months ($)
137,527Life, physical, and social science occupations
116,637Computer and mathematical occupations
114,319Health diagnosing and treating practitioners and other technical occupations
112,019Architecture and engineering occupations
90,682Management occupations
74,222Business and financial operations occupations
Companies with federal contracts located in this zip code:
LIBERTY ORCHARDS COMPANY INC (117 MISSION AVE in CASHMERE, WA; small business) : $88,883 in 5 contractsfrom 2004 to 2005
Contracts for Food Items For Resale, Non-Food Items For Resale by Defense Commissary Agency Signed by year:2000: $0; 2001: $0; 2002: $0; 2003: $0; 2004: $37,495; 2005: $51,388; 2006: $0.
Biggest contracts:
$37,495 with Defense Commissary Agency for Food Items For Resale. Signed on 2004-10-01. Completion date: 2005-02-28.
$22,173 with Defense Commissary Agency for Non-Food Items For Resale. Signed on 2005-10-01. Completion date: 2005-12-31.
$17,127 with Defense Commissary Agency for Food Items For Resale. Signed on 2005-04-01. Completion date: 2005-08-31.
$8,188, same as above.Signed on 2005-01-01. Completion date: 2005-03-31.
PIERCE COUNTY EMERGENCY VEHICL (5593 SUNSET HWY in CASHMERE, WA; small business) : $10,400 in 3 contractsin 2005
$18,914 with Army for Vehicular Furniture and Accessories. Signed on 2005-07-19. Completion date: 2005-07-29.
$0, same as above.Signed on 2005-12-02. Completion date: 2005-07-29.
-$8,514, same as above.Signed on 2005-12-02. Completion date: 2005-07-29.
Top industries in this zip code by the number of employees in 2005:
Health Care and Social Assistance: Nursing Care Facilities (100-249 employees: 1 establishment)
Construction: Poured Concrete Foundation and Structure Contractors (50-99: 1)
Finance and Insurance: Commercial Banking (50-99: 1)
Accommodation and Food Services: Full-Service Restaurants (10-19: 1, 5-9: 4)
Construction: Site Preparation Contractors (10-19: 2, 1-4: 5)
Construction: Commercial and Institutional Building Construction (20-49: 1, 1-4: 1)
People in group quarters in 2010:
80 people in nursing facilities/skilled-nursing facilities
38 people in workers' group living quarters and job corps centers
12 people in group homes intended for adults
People in group quarters in 2000:
104 people in nursing homes
26 people in unknown juvenile institutions
26 people in other workers' dormitories
6 people in agriculture workers' dormitories on farms
Home Mortgage Disclosure Act Aggregated Statistics For Year 2009 (Based on 2 full and 2 partial tracts)
A) FHA, FSA/RHS & VA Home Purchase Loans
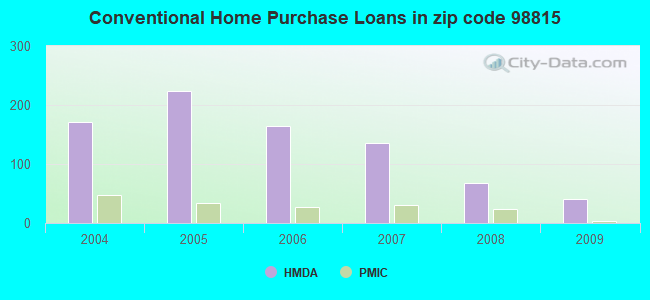
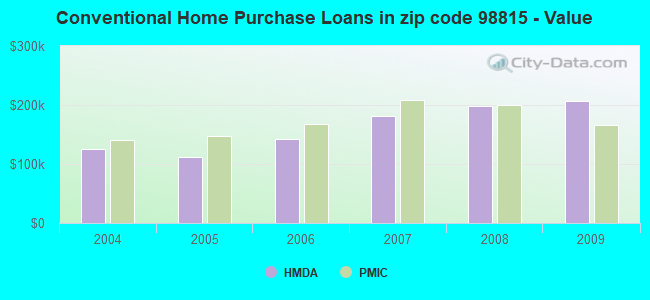
B) Conventional Home Purchase Loans
C) Refinancings
D) Home Improvement Loans
E) Loans on Dwellings For 5+ Families
F) Non-occupant Loans on < 5 Family Dwellings (A B C & D)
G) Loans On Manufactured Home Dwelling (A B C & D)
Number
Average Value
Number
Average Value
Number
Average Value
Number
Average Value
Number
Average Value
Number
Average Value
Number
Average Value
LOANS ORIGINATED
29
$207,145
40
$206,198
365
$179,606
51
$133,781
1
$85,970
46
$145,597
34
$107,932
APPLICATIONS APPROVED, NOT ACCEPTED
1
$101,960
9
$186,588
41
$186,607
1
$19,990
0
$0
4
$159,825
3
$140,387
APPLICATIONS DENIED
5
$155,418
7
$149,024
92
$210,719
5
$204,058
0
$0
11
$126,926
9
$173,116
APPLICATIONS WITHDRAWN
5
$191,426
3
$133,590
67
$211,423
7
$91,723
0
$0
2
$59,815
7
$155,740
FILES CLOSED FOR INCOMPLETENESS
0
$0
3
$247,617
13
$151,562
1
$36,650
0
$0
0
$0
3
$78,857
Aggregated Statistics For Year 2008 (Based on 2 full and 2 partial tracts)
A) FHA, FSA/RHS & VA Home Purchase Loans
B) Conventional Home Purchase Loans
C) Refinancings
D) Home Improvement Loans
F) Non-occupant Loans on < 5 Family Dwellings (A B C & D)
G) Loans On Manufactured Home Dwelling (A B C & D)
Number
Average Value
Number
Average Value
Number
Average Value
Number
Average Value
Number
Average Value
Number
Average Value
LOANS ORIGINATED
14
$167,789
67
$198,487
167
$168,218
31
$88,311
33
$152,940
21
$127,291
APPLICATIONS APPROVED, NOT ACCEPTED
0
$0
5
$143,212
36
$176,955
6
$48,353
3
$130,493
7
$105,991
APPLICATIONS DENIED
4
$264,678
25
$203,476
117
$175,783
32
$104,250
13
$213,512
21
$154,890
APPLICATIONS WITHDRAWN
11
$136,811
7
$247,187
35
$240,041
8
$92,030
4
$148,915
1
$193,260
FILES CLOSED FOR INCOMPLETENESS
0
$0
0
$0
8
$192,455
1
$179,930
0
$0
1
$126,620
Aggregated Statistics For Year 2007 (Based on 2 full and 2 partial tracts)
A) FHA, FSA/RHS & VA Home Purchase Loans
B) Conventional Home Purchase Loans
C) Refinancings
D) Home Improvement Loans
E) Loans on Dwellings For 5+ Families
F) Non-occupant Loans on < 5 Family Dwellings (A B C & D)
G) Loans On Manufactured Home Dwelling (A B C & D)
Number
Average Value
Number
Average Value
Number
Average Value
Number
Average Value
Number
Average Value
Number
Average Value
Number
Average Value
LOANS ORIGINATED
10
$193,572
136
$181,928
222
$169,468
45
$64,936
2
$3,008,645
37
$156,615
38
$109,768
APPLICATIONS APPROVED, NOT ACCEPTED
0
$0
12
$147,517
31
$146,231
3
$45,457
1
$419,830
2
$173,265
5
$89,698
APPLICATIONS DENIED
1
$74,640
33
$173,664
112
$154,625
26
$121,498
0
$0
5
$248,184
18
$160,392
APPLICATIONS WITHDRAWN
0
$0
21
$157,575
39
$141,197
15
$63,938
0
$0
13
$136,684
1
$120,620
FILES CLOSED FOR INCOMPLETENESS
0
$0
3
$117,043
9
$172,833
1
$53,980
0
$0
0
$0
1
$53,980
Aggregated Statistics For Year 2006 (Based on 2 full and 2 partial tracts)
A) FHA, FSA/RHS & VA Home Purchase Loans
B) Conventional Home Purchase Loans
C) Refinancings
D) Home Improvement Loans
F) Non-occupant Loans on < 5 Family Dwellings (A B C & D)
G) Loans On Manufactured Home Dwelling (A B C & D)
Number
Average Value
Number
Average Value
Number
Average Value
Number
Average Value
Number
Average Value
Number
Average Value
LOANS ORIGINATED
1
$147,940
165
$141,988
217
$133,317
46
$55,427
37
$138,035
33
$87,155
APPLICATIONS APPROVED, NOT ACCEPTED
0
$0
49
$120,248
31
$119,737
3
$153,180
11
$136,008
8
$132,906
APPLICATIONS DENIED
3
$92,463
35
$127,525
125
$123,109
27
$67,435
9
$133,302
20
$80,278
APPLICATIONS WITHDRAWN
2
$121,285
25
$163,614
47
$156,496
5
$35,238
2
$102,680
4
$111,455
FILES CLOSED FOR INCOMPLETENESS
0
$0
8
$133,504
11
$143,254
0
$0
6
$135,910
1
$19,330
Aggregated Statistics For Year 2005 (Based on 2 full and 2 partial tracts)
A) FHA, FSA/RHS & VA Home Purchase Loans
B) Conventional Home Purchase Loans
C) Refinancings
D) Home Improvement Loans
E) Loans on Dwellings For 5+ Families
F) Non-occupant Loans on < 5 Family Dwellings (A B C & D)
G) Loans On Manufactured Home Dwelling (A B C & D)
Number
Average Value
Number
Average Value
Number
Average Value
Number
Average Value
Number
Average Value
Number
Average Value
Number
Average Value
LOANS ORIGINATED
9
$147,704
223
$111,689
221
$130,847
35
$35,970
2
$115,640
48
$98,440
39
$99,110
APPLICATIONS APPROVED, NOT ACCEPTED
1
$63,310
29
$130,494
41
$124,962
1
$16,660
2
$358,885
5
$178,730
7
$109,384
APPLICATIONS DENIED
5
$147,244
35
$115,484
110
$133,574
30
$47,068
0
$0
13
$73,387
26
$132,255
APPLICATIONS WITHDRAWN
2
$123,285
33
$99,049
84
$132,013
11
$80,938
0
$0
12
$107,663
6
$109,512
FILES CLOSED FOR INCOMPLETENESS
0
$0
3
$65,940
31
$120,600
0
$0
0
$0
0
$0
4
$119,452
Aggregated Statistics For Year 2004 (Based on 2 full and 2 partial tracts)
A) FHA, FSA/RHS & VA Home Purchase Loans
B) Conventional Home Purchase Loans
C) Refinancings
D) Home Improvement Loans
E) Loans on Dwellings For 5+ Families
F) Non-occupant Loans on < 5 Family Dwellings (A B C & D)
G) Loans On Manufactured Home Dwelling (A B C & D)
Detailed PMIC statistics for the following Tracts:9605.00
, 9606.00
2002 - 2018 National Fire Incident Reporting System (NFIRS) incidents
According to the data from the years 2002 - 2018 the average number of fires per year is 19. The highest number of reported fires - 43 took place in 2002, and the least - 0 in 2012. The data has a declining trend.
When looking into fire subcategories, the most reports belonged to: Outside Fires (55.7%), and Structure Fires (26.1%).
Fire incident types reported to NFIRS in Zip Code 98815


+$2,373
-$6,197
(% of AGI for various income ranges: -9.9% for AGIs below $10k, -0.7% for AGIs $10k-25k, 0.0% for AGIs $25k-50k, -0.2% for AGIs $75k-100k, 2.1% for AGIs over 100k) Nearest zip codes: 98836, 98821, 98801, 98847, 98811, 98802.
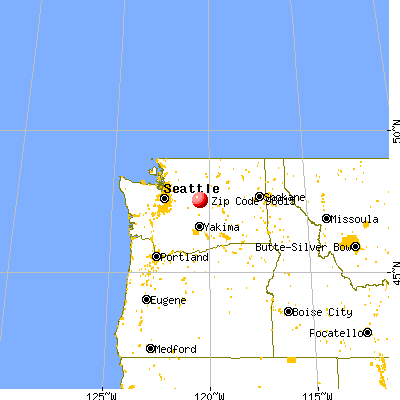
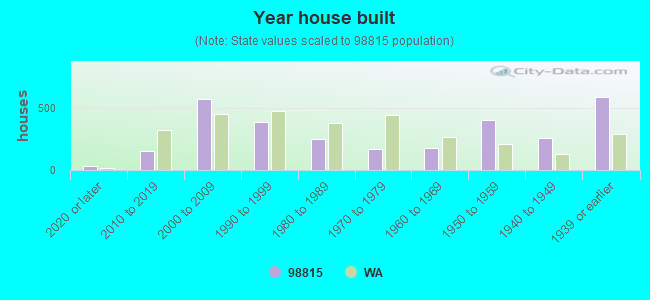


 According to the data from the years 2002 - 2018 the average number of fires per year is 19. The highest number of reported fires - 43 took place in 2002, and the least - 0 in 2012. The data has a declining trend.
 When looking into fire subcategories, the most reports belonged to: Outside Fires (55.7%), and Structure Fires (26.1%).