Estimated zip code population in 2022: 1,970 Zip code population in 2010: 2,177 Zip code population in 2000: 1,992
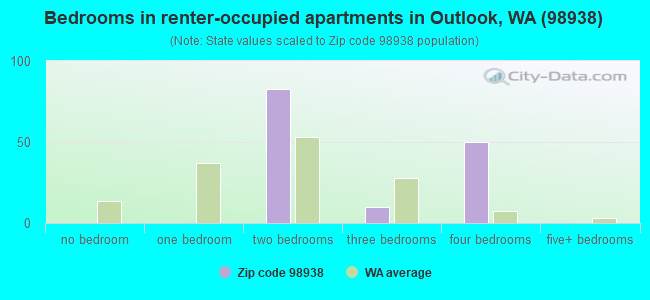
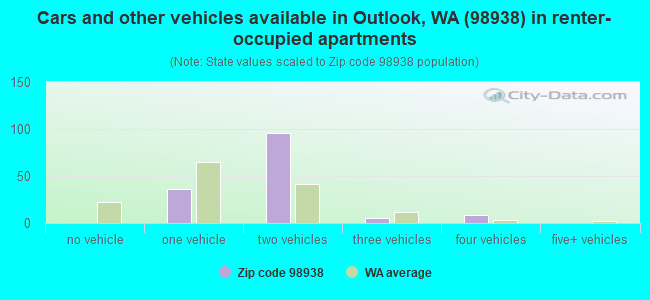
Houses and condos: 679 Renter-occupied apartments: 147
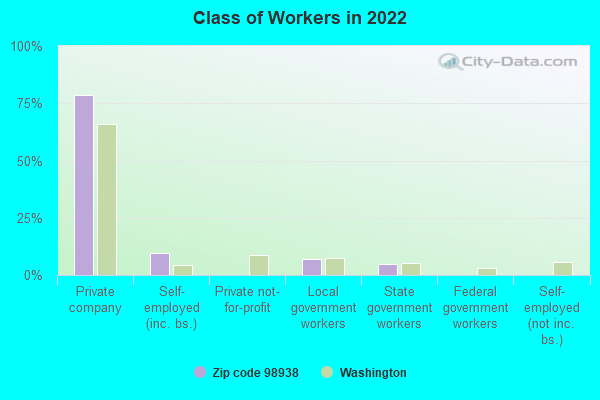
% of renters here:
22%
State:
36%
March 2022 cost of living index in zip code 98938: 89.1 (less than average, U.S. average is 100)
Land area: 36.9 sq. mi. Water area: 0.0 sq. mi.
Population density: 53 people per square mile
(very low).
OSM Map
General Map
Google Map
MSN Map
OSM Map
General Map
Google Map
MSN Map
OSM Map
General Map
Google Map
MSN Map
OSM Map
General Map
Google Map
MSN Map
Please wait while loading the map...
Real estate property taxes paid for housing units in 2022:
This zip code:
0.6% ($1,484)
Washington:
0.8% ($4,283)
Median real estate property taxes paid for housing units with mortgages in 2022: $1,414 (0.3%) Median real estate property taxes paid for housing units with no mortgage in 2022: $1,587 (0.8%)
Business Search- 14 Million verified businesses
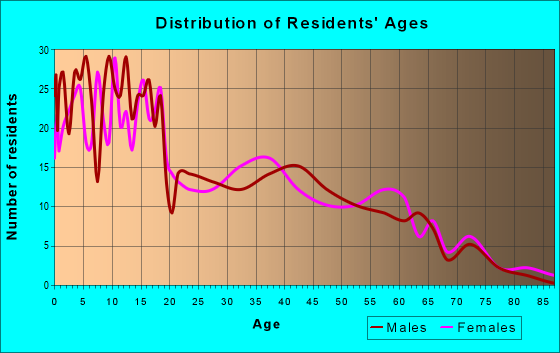
Males: 875
(44.4%)
Females: 1,094
(55.6%)
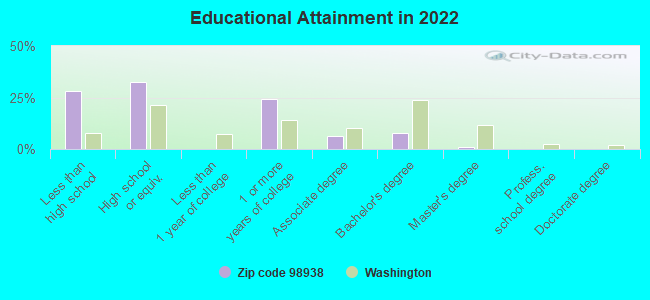
For population 25 years and over in 98938:
High school or higher: 70.7%
Bachelor's degree or higher: 8.6%
Graduate or professional degree: 0.9%
Unemployed: 3.9%
Mean travel time to work (commute): 11.8 minutes
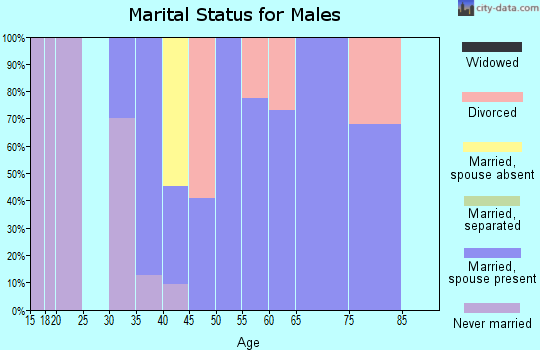
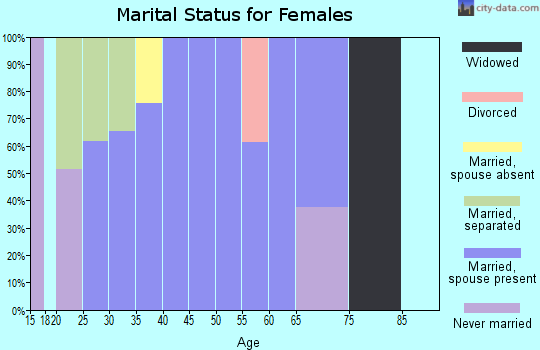
For population 15 years and over in 98938:
Never married: 28.7%
Now married: 52.2%
Separated: 0.0%
Widowed: 6.9%
Divorced: 12.3%
Zip code 98938 compared to state average:
Median household income below state average.
Median house value below state average.
Black race population percentage significantly below state average.
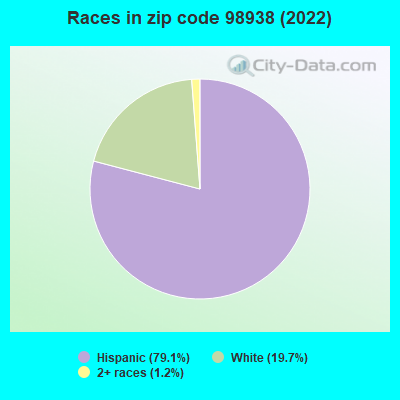
Hispanic race population percentage significantly above state average.
Median age below state average.
Foreign-born population percentage above state average.
Renting percentage below state average.
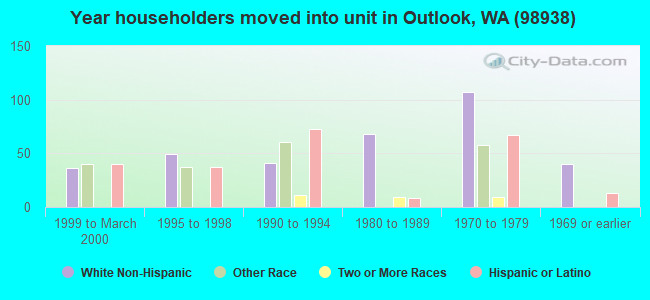
Length of stay since moving in significantly above state average.
Number of college students below state average.
Percentage of population with a bachelor's degree or higher significantly below state average.
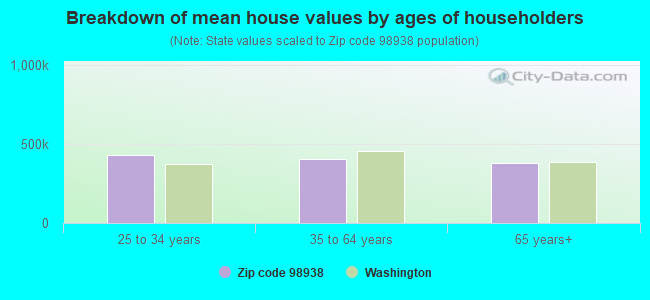
Estimated median house/condo value in 2022: $253,352
98938:
$253,352
Washington:
$569,500
According to our research of Washington and other state lists, there was 1 registered sex offender living in 98938 zip code as of April 27, 2024. The ratio of all residents to sex offenders in zip code 98938 is 3,568 to 1. The ratio of registered sex offenders to all residents in this zip code is much lower than the state average.
Median resident age:
This zip code:
32.1 years
Washington median age:
38.4 years
Average household size:
This zip code:
2.9 people
Washington:
2.5 people
Averages for the 2020 tax year for zip code 98938, filed in 2021:
Average Adjusted Gross Income (AGI) in 2020: $45,995 (Individual Income Tax Returns)
Here:
$45,995
State:
$99,264
Salary/wage: $42,771 (reported on 88.4% of returns)
Here:
$42,771
State:
$80,347
(% of AGI for various income ranges: 1608.3% for AGIs below $25k, 4080.8% for AGIs $25k-50k, 7225.6% for AGIs $50k-75k, 9818.0% for AGIs $75k-100k, 26135.0% for AGIs $100k-200k)
Taxable interest for individuals: $1,536 (reported on 14.7% of returns)
This zip code:
$1,536
Washington:
$2,077
(% of AGI for various income ranges: 14.6% for AGIs below $25k, 4.8% for AGIs $25k-50k, 23.3% for AGIs $50k-75k, 367.5% for AGIs $100k-200k)
Ordinary dividends: $2,700 (reported on 4.2% of returns)
Here:
$2,700
State:
$10,013
(% of AGI for various income ranges: 2.9% for AGIs below $25k, 252.5% for AGIs $100k-200k)
Net capital gain/loss in AGI: +$10,900 (reported on 4.2% of returns)
Here:
+$10,900
State:
+$40,092
(% of AGI for various income ranges: 22.1% for AGIs below $25k, 957.5% for AGIs $100k-200k)
Earned income credit: $2,395 (reported on 22.1% of returns)
Here:
$2,395
State:
$2,020
(% of AGI for various income ranges: 109.2% for AGIs below $25k, 96.4% for AGIs $25k-50k)
Percentage of individuals using paid preparers for their 2020 taxes: 89.5%
Here:
89%
State:
93%
(% for various income ranges: 85.7% for AGIs below $25k, 90.6% for AGIs $25k-50k, 91.7% for AGIs $50k-75k, 85.7% for AGIs $75k-100k, 100.0% for AGIs $100k-200k)
Averages for the 2012 tax year for zip code 98938, filed in 2013:
Average Adjusted Gross Income (AGI) in 2012: $41,349 (Individual Income Tax Returns)
Here:
$41,349
State:
$69,533
Salary/wage: $36,134 (reported on 88.8% of returns)
Here:
$36,134
State:
$57,267
(% of AGI for various income ranges: 85.7% for AGIs below $25k, 86.2% for AGIs $25k-50k, 89.6% for AGIs $50k-75k, 89.3% for AGIs $75k-100k, 52.0% for AGIs $100k-200k)
Taxable interest for individuals: $1,850 (reported on 20.0% of returns)
This zip code:
$1,850
Washington:
$1,816
(% of AGI for various income ranges: 0.5% for AGIs below $25k, 0.4% for AGIs $25k-50k, 0.9% for AGIs $50k-75k, 2.0% for AGIs $100k-200k)
Ordinary dividends: $2,212 (reported on 10.0% of returns)
Here:
$2,212
State:
$8,163
Net capital gain/loss in AGI: +$9,460 (reported on 6.2% of returns)
Here:
+$9,460
State:
+$21,568
Profit/loss from business: +$7,171 (reported on 8.8% of returns)
Here:
+$7,171
State:
+$16,521
Taxable individual retirement arrangement distribution: $5,033 (reported on 3.8% of returns)
98938:
$5,033
Washington:
$18,648
Total itemized deductions: $18,067 (24% of AGI, reported on 15.0% of returns)
Here:
$18,067
State:
$23,872
Here:
23.5% of AGI
State:
18.2% of AGI
(% of AGI for various income ranges: 5.8% for AGIs $25k-50k, 15.4% for AGIs $50k-75k, 7.9% for AGIs $100k-200k)
Charity contributions: $4,600 (reported on 10.0% of returns)
Here:
$4,600
State:
$4,465
Taxes paid: $3,590 (reported on 12.5% of returns)
98938:
$3,590
State:
$6,400
(% of AGI for various income ranges: 0.7% for AGIs $25k-50k, 2.5% for AGIs $50k-75k, 1.6% for AGIs $100k-200k)
Earned income credit: $2,733 (reported on 26.2% of returns)
Here:
$2,733
State:
$2,073
(% of AGI for various income ranges: 9.3% for AGIs below $25k, 1.5% for AGIs $25k-50k)
Percentage of individuals using paid preparers for their 2012 taxes: 70.0%
Here:
70%
State:
43%
(% for various income ranges: 62.9% for AGIs below $25k, 72.0% for AGIs $25k-50k, 70.0% for AGIs $50k-75k, 80.0% for AGIs $75k-100k, 100.0% for AGIs $100k-200k)
Averages for the 2004 tax year for zip code 98938, filed in 2005:
Average Adjusted Gross Income (AGI) in 2004: $34,707 (Individual Income Tax Returns)
Here:
$34,707
State:
$54,331
Salary/wage: $30,282 (reported on 87.9% of returns)
Here:
$30,282
State:
$45,761
(% of AGI for various income ranges: 85.3% for AGIs $10k-25k, 90.2% for AGIs $25k-50k, 88.3% for AGIs $50k-75k, 78.0% for AGIs $75k-100k, 44.6% for AGIs over 100k)
Taxable interest for individuals: $2,183 (reported on 33.4% of returns)
This zip code:
$2,183
Washington:
$2,110
(% of AGI for various income ranges: 1.1% for AGIs $10k-25k, 0.5% for AGIs $25k-50k, 2.5% for AGIs $50k-75k, 0.7% for AGIs $75k-100k, 3.2% for AGIs over 100k)
Taxable dividends: $1,523 (reported on 12.2% of returns)
Here:
$1,523
State:
$5,879
(% of AGI for various income ranges: 0.3% for AGIs $10k-25k, 0.2% for AGIs $25k-50k, 0.3% for AGIs $50k-75k, 1.0% for AGIs over 100k)
Net capital gain/loss: +$7,705 (reported on 12.5% of returns)
Here:
+$7,705
State:
+$15,835
(% of AGI for various income ranges: 0.1% for AGIs $25k-50k, 3.1% for AGIs $50k-75k, 7.2% for AGIs over 100k)
Profit/loss from business: +$5,826 (reported on 9.8% of returns)
Here:
+$5,826
State:
+$13,994
(% of AGI for various income ranges: 4.8% for AGIs $10k-25k, -0.6% for AGIs $25k-50k, 5.8% for AGIs $50k-75k)
IRA payment deduction: $4,000 (reported on 1.4% of returns)
98938:
$4,000
Washington:
$3,001
Total itemized deductions: $14,981 (23% of AGI, reported on 14.7% of returns)
Here:
$14,981
State:
$19,669
Here:
22.7% of AGI
State:
20.7% of AGI
(% of AGI for various income ranges: 2.9% for AGIs $10k-25k, 7.3% for AGIs $25k-50k, 9.3% for AGIs $50k-75k, 9.0% for AGIs $75k-100k, 4.7% for AGIs over 100k)
Charity contributions deductions: $3,351 (4% of AGI, reported on 10.5% of returns)
Here:
$3,351
State:
$3,569
Here:
4.4% of AGI
State:
3.5% of AGI
(% of AGI for various income ranges: 1.2% for AGIs $25k-50k, 1.4% for AGIs $50k-75k, 0.7% for AGIs $75k-100k, 1.3% for AGIs over 100k)
Total tax: $6,222 (reported on 56.9% of returns)
98938:
$6,222
State:
$9,065
(% of AGI for various income ranges: 2.9% for AGIs $10k-25k, 3.7% for AGIs $25k-50k, 7.5% for AGIs $50k-75k, 9.7% for AGIs $75k-100k, 20.7% for AGIs over 100k)
Earned income credit: $2,194 (reported on 29.3% of returns)
Here:
$2,194
State:
$1,607
Percentage of individuals using paid preparers for their 2004 taxes: 67.9%
Here:
68%
State:
49%
(% for various income ranges: 68.0% for AGIs below $10k, 65.9% for AGIs $10k-25k, 64.4% for AGIs $25k-50k, 71.4% for AGIs $50k-75k, 78.6% for AGIs $75k-100k, 81.8% for AGIs over 100k)
Household received Food Stamps/SNAP in the past 12 months: 140 Household did not receive Food Stamps/SNAP in the past 12 months: 531
Women who had a birth in the past 12 months: 115 (66 now married, 46 unmarried) Women who did not have a birth in the past 12 months: 350 (104 now married, 248 unmarried)
Housing units in zip code 98938 with a mortgage: 247 Median monthly owner costs for units with a mortgage: $1,807 Median monthly owner costs for units without a mortgage: $452
Residents with income below the poverty level in 2022:
This zip code:
12.9%
Whole state:
10.0%
Residents with income below 50% of the poverty level in 2022:
This zip code:
7.8%
Whole state:
4.6%
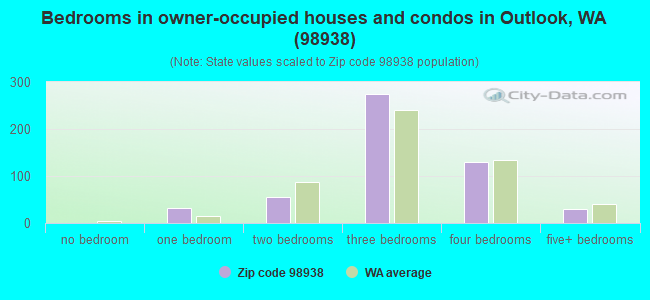
Median number of rooms in houses and condos:
Here:
6.0
State:
6.5
Median number of rooms in apartments:
Here:
4.3
State:
3.9
Notable locations in this zip code not listed on our city pages
Size of family households: 90 2-persons, 163 3-persons, 205 4-persons, 17 5-persons, 5 6-persons
Size of nonfamily households: 120 1-person, 57 2-persons
346 married couples with children.
185 single-parent households (57 men, 128 women).
27.0% of residents of 98938 zip code speak English at home.
74.8% of residents speak Spanish at home (45% very well, 31% well, 16% not well, 8% not at all).
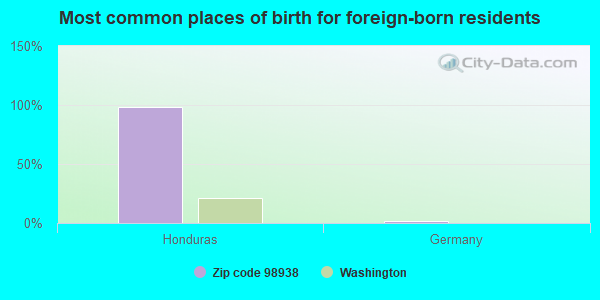
Foreign born population: 460 (23.3%) (46.2% of them are naturalized citizens)
This zip code:
23.3%
Whole state:
15.3%
98%Honduras
1%Germany
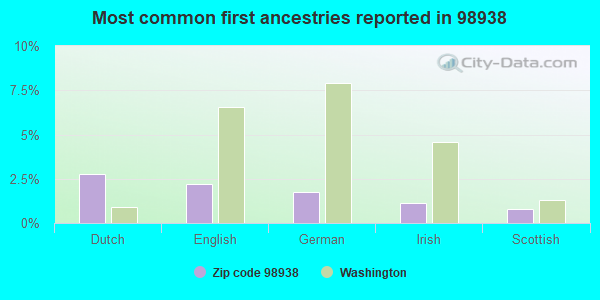
3%Dutch
2%English
2%German
1%Irish
1%Scottish
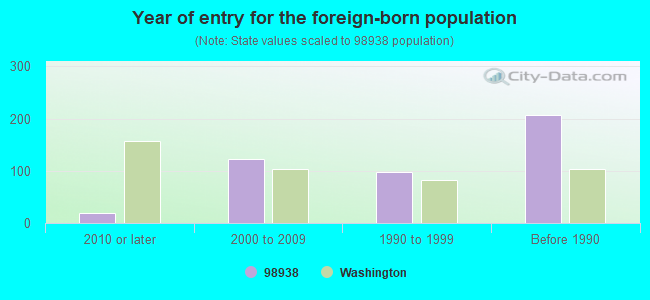
Year of entry for the foreign-born population
202010 or later
1232000 to 2009
971990 to 1999
207Before 1990
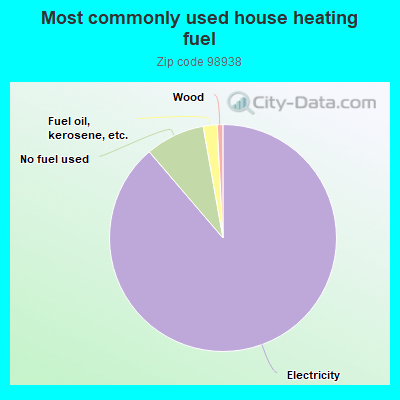
89.0%Electricity
8.5%No fuel used
2.0%Fuel oil, kerosene, etc.
0.8%Wood
Population in 1990: 1,705. Population change in the 1990s: +287 (+16.8%).
Place of birth for U.S.-born residents:
This state: 1,288
Midwest: 42
South: 110
West: 55
70% of the 98938 zip code residents lived in the same house 5 years ago. Out of people who lived in different houses, 60% lived in this county. Out of people who lived in different counties, 50% lived in Washington.
90% of the 98938 zip code residents lived in the same house 1 year ago. Out of people who lived in different houses, 94% moved from this county.
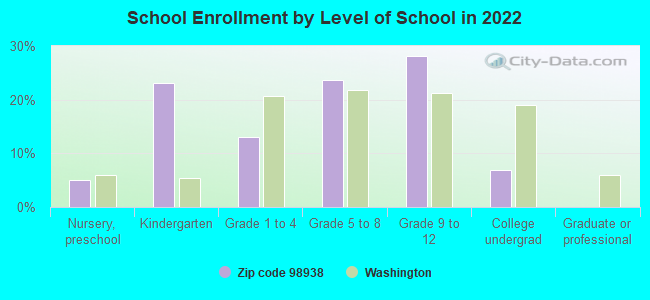
Private vs. public school enrollment:
Students in private schools in grades 1 to 8 (elementary and middle school): 12
Here:
7.6%
Washington:
12.4%
Students in private schools in grades 9 to 12 (high school):
Here:
0.0%
Washington:
9.2%
Students in private undergraduate colleges:
Here:
0.0%
Washington:
16.5%
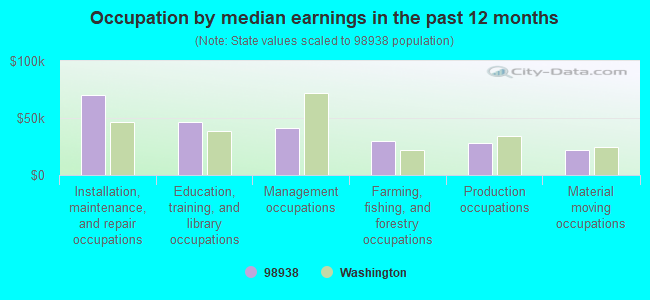
Occupation by median earnings in the past 12 months ($)
69,960Installation, maintenance, and repair occupations
46,828Education, training, and library occupations
40,926Management occupations
29,580Farming, fishing, and forestry occupations
27,958Production occupations
21,926Material moving occupations
Top industries in this zip code by the number of employees in 2005:
Construction: Commercial and Institutional Building Construction (10-19 employees: 1 establishment, 5-9 employees: 1 establishment)
Wholesale Trade: Fresh Fruit and Vegetable Merchant Wholesalers (10-19: 1)
Construction: Siding Contractors (5-9: 1)
Other Services (except Public Administration): Commercial and Industrial Machinery and Equipment (except Automotive and Electronic) Repair and Maintenance (5-9: 1)
Administrative and Support and Waste Management and Remediation Services: Landscaping Services (1-4: 1)
Fatal accident statistics in 2014:
Fatal accident count: 1
Vehicles involved in fatal accidents: 1
Fatal accidents caused by drunken drivers: 1
Fatalities: 1
Persons involved in fatal accidents: 1
Pedestrians involved in fatal accidents: 0
Fatal accident statistics in 2013:
Fatal accident count: 1
Vehicles involved in fatal accidents: 1
Fatal accidents caused by drunken drivers: 0
Fatalities: 1
Persons involved in fatal accidents: 1
Pedestrians involved in fatal accidents: 0
Home Mortgage Disclosure Act Aggregated Statistics For Year 2009 (Based on 2 partial tracts)
A) FHA, FSA/RHS & VA Home Purchase Loans
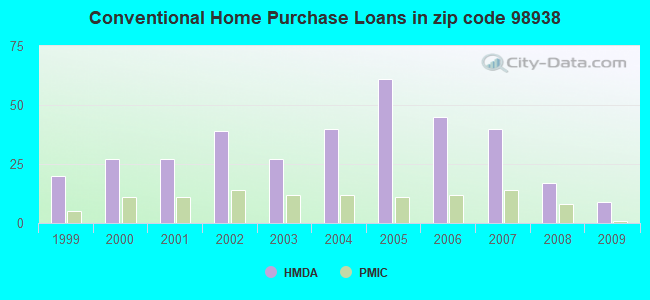
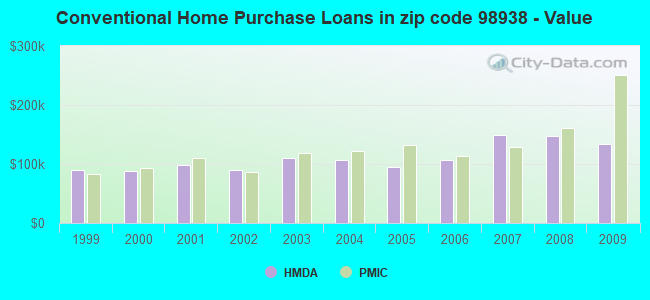
B) Conventional Home Purchase Loans
C) Refinancings
D) Home Improvement Loans
F) Non-occupant Loans on < 5 Family Dwellings (A B C & D)
G) Loans On Manufactured Home Dwelling (A B C & D)
Number
Average Value
Number
Average Value
Number
Average Value
Number
Average Value
Number
Average Value
Number
Average Value
LOANS ORIGINATED
15
$140,777
9
$133,622
47
$148,111
6
$58,388
4
$78,925
10
$111,857
APPLICATIONS APPROVED, NOT ACCEPTED
0
$0
1
$36,910
14
$139,963
3
$83,277
0
$0
2
$61,890
APPLICATIONS DENIED
2
$108,450
7
$132,379
45
$145,836
9
$67,758
1
$169,200
10
$102,601
APPLICATIONS WITHDRAWN
2
$78,355
1
$276,520
12
$139,773
1
$28,390
0
$0
1
$134,000
FILES CLOSED FOR INCOMPLETENESS
0
$0
1
$156,140
6
$119,522
1
$35,770
1
$22,710
1
$123,780
Aggregated Statistics For Year 2008 (Based on 2 partial tracts)
A) FHA, FSA/RHS & VA Home Purchase Loans
B) Conventional Home Purchase Loans
C) Refinancings
D) Home Improvement Loans
F) Non-occupant Loans on < 5 Family Dwellings (A B C & D)
G) Loans On Manufactured Home Dwelling (A B C & D)
Number
Average Value
Number
Average Value
Number
Average Value
Number
Average Value
Number
Average Value
Number
Average Value
LOANS ORIGINATED
12
$143,985
17
$147,394
49
$124,082
6
$38,422
12
$83,751
11
$98,643
APPLICATIONS APPROVED, NOT ACCEPTED
1
$39,750
4
$99,932
11
$139,524
2
$51,670
1
$122,640
2
$102,205
APPLICATIONS DENIED
3
$221,630
9
$131,730
57
$138,663
18
$84,571
5
$132,866
13
$97,050
APPLICATIONS WITHDRAWN
0
$0
2
$181,130
19
$142,518
1
$68,140
1
$20,440
4
$77,220
FILES CLOSED FOR INCOMPLETENESS
0
$0
2
$110,155
6
$114,222
1
$9,080
0
$0
1
$157,850
Aggregated Statistics For Year 2007 (Based on 2 partial tracts)
A) FHA, FSA/RHS & VA Home Purchase Loans
B) Conventional Home Purchase Loans
C) Refinancings
D) Home Improvement Loans
F) Non-occupant Loans on < 5 Family Dwellings (A B C & D)
G) Loans On Manufactured Home Dwelling (A B C & D)
Number
Average Value
Number
Average Value
Number
Average Value
Number
Average Value
Number
Average Value
Number
Average Value
LOANS ORIGINATED
6
$125,483
40
$149,246
44
$116,012
14
$35,244
7
$82,411
15
$96,564
APPLICATIONS APPROVED, NOT ACCEPTED
1
$124,920
12
$106,652
15
$121,093
3
$83,277
1
$45,990
8
$114,128
APPLICATIONS DENIED
1
$132,300
23
$105,685
68
$128,189
11
$87,957
3
$162,960
18
$89,492
APPLICATIONS WITHDRAWN
2
$99,935
7
$113,479
17
$136,172
4
$84,035
2
$48,545
6
$108,355
FILES CLOSED FOR INCOMPLETENESS
0
$0
1
$53,940
5
$122,076
1
$175,450
0
$0
0
$0
Aggregated Statistics For Year 2006 (Based on 2 partial tracts)
A) FHA, FSA/RHS & VA Home Purchase Loans
B) Conventional Home Purchase Loans
C) Refinancings
D) Home Improvement Loans
F) Non-occupant Loans on < 5 Family Dwellings (A B C & D)
G) Loans On Manufactured Home Dwelling (A B C & D)
Number
Average Value
Number
Average Value
Number
Average Value
Number
Average Value
Number
Average Value
Number
Average Value
LOANS ORIGINATED
7
$104,719
45
$107,100
51
$107,748
10
$45,083
10
$96,356
20
$94,425
APPLICATIONS APPROVED, NOT ACCEPTED
2
$135,420
8
$93,402
12
$145,972
2
$108,735
2
$79,490
4
$104,618
APPLICATIONS DENIED
3
$219,927
17
$88,811
73
$111,507
20
$59,136
7
$86,793
18
$108,292
APPLICATIONS WITHDRAWN
0
$0
12
$97,662
24
$118,788
5
$75,630
3
$107,503
2
$93,970
FILES CLOSED FOR INCOMPLETENESS
0
$0
2
$109,585
8
$91,061
0
$0
1
$45,990
1
$173,180
Aggregated Statistics For Year 2005 (Based on 2 partial tracts)
A) FHA, FSA/RHS & VA Home Purchase Loans
B) Conventional Home Purchase Loans
C) Refinancings
D) Home Improvement Loans
F) Non-occupant Loans on < 5 Family Dwellings (A B C & D)
G) Loans On Manufactured Home Dwelling (A B C & D)
Number
Average Value
Number
Average Value
Number
Average Value
Number
Average Value
Number
Average Value
Number
Average Value
LOANS ORIGINATED
10
$103,226
61
$95,595
47
$116,012
7
$72,273
5
$115,490
18
$93,876
APPLICATIONS APPROVED, NOT ACCEPTED
1
$189,650
7
$86,873
16
$78,356
2
$16,750
2
$44,290
2
$86,305
APPLICATIONS DENIED
2
$115,545
22
$87,957
101
$93,715
27
$55,791
6
$55,833
32
$83,662
APPLICATIONS WITHDRAWN
2
$112,425
16
$92,090
46
$116,967
4
$379,290
2
$55,930
8
$92,339
FILES CLOSED FOR INCOMPLETENESS
0
$0
5
$61,322
10
$107,712
1
$11,360
1
$97,660
1
$42,590
Aggregated Statistics For Year 2004 (Based on 2 partial tracts)
A) FHA, FSA/RHS & VA Home Purchase Loans
B) Conventional Home Purchase Loans
C) Refinancings
D) Home Improvement Loans
F) Non-occupant Loans on < 5 Family Dwellings (A B C & D)
G) Loans On Manufactured Home Dwelling (A B C & D)
Number
Average Value
Number
Average Value
Number
Average Value
Number
Average Value
Number
Average Value
Number
Average Value
LOANS ORIGINATED
6
$115,073
40
$106,519
65
$159,045
10
$44,232
9
$175,829
14
$160,890
APPLICATIONS APPROVED, NOT ACCEPTED
1
$83,470
14
$99,771
19
$90,280
1
$10,790
2
$65,015
2
$94,825
APPLICATIONS DENIED
1
$64,160
18
$92,110
61
$102,641
12
$59,430
3
$85,170
14
$69,231
APPLICATIONS WITHDRAWN
0
$0
7
$94,579
28
$107,740
1
$56,210
2
$66,150
4
$94,538
FILES CLOSED FOR INCOMPLETENESS
1
$108,450
2
$83,185
6
$111,288
0
$0
0
$0
1
$145,360
Aggregated Statistics For Year 2003 (Based on 2 partial tracts)
A) FHA, FSA/RHS & VA Home Purchase Loans
B) Conventional Home Purchase Loans
C) Refinancings
D) Home Improvement Loans
F) Non-occupant Loans on < 5 Family Dwellings (A B C & D)
Number
Average Value
Number
Average Value
Number
Average Value
Number
Average Value
Number
Average Value
LOANS ORIGINATED
3
$108,070
27
$110,448
99
$97,725
3
$42,587
9
$60,502
APPLICATIONS APPROVED, NOT ACCEPTED
1
$55,640
6
$89,902
12
$102,678
1
$99,930
1
$55,640
APPLICATIONS DENIED
1
$111,290
19
$86,066
69
$93,127
6
$37,285
3
$82,900
APPLICATIONS WITHDRAWN
0
$0
4
$136,272
27
$109,102
0
$0
1
$44,860
FILES CLOSED FOR INCOMPLETENESS
0
$0
0
$0
5
$119,692
0
$0
0
$0
Aggregated Statistics For Year 2002 (Based on 2 partial tracts)
A) FHA, FSA/RHS & VA Home Purchase Loans
B) Conventional Home Purchase Loans
C) Refinancings
D) Home Improvement Loans
F) Non-occupant Loans on < 5 Family Dwellings (A B C & D)
Number
Average Value
Number
Average Value
Number
Average Value
Number
Average Value
Number
Average Value
LOANS ORIGINATED
8
$90,848
39
$90,033
62
$96,059
4
$17,742
6
$66,905
APPLICATIONS APPROVED, NOT ACCEPTED
2
$126,620
7
$90,849
12
$101,116
1
$11,360
2
$67,285
APPLICATIONS DENIED
2
$113,560
13
$80,715
54
$94,307
11
$42,792
5
$92,552
APPLICATIONS WITHDRAWN
2
$106,180
4
$104,475
29
$96,957
0
$0
0
$0
FILES CLOSED FOR INCOMPLETENESS
0
$0
1
$114,130
5
$92,210
1
$38,610
0
$0
Aggregated Statistics For Year 2001 (Based on 2 partial tracts)
A) FHA, FSA/RHS & VA Home Purchase Loans
B) Conventional Home Purchase Loans
C) Refinancings
D) Home Improvement Loans
F) Non-occupant Loans on < 5 Family Dwellings (A B C & D)
Number
Average Value
Number
Average Value
Number
Average Value
Number
Average Value
Number
Average Value
LOANS ORIGINATED
6
$88,103
27
$98,839
78
$92,195
3
$20,063
3
$64,730
APPLICATIONS APPROVED, NOT ACCEPTED
1
$36,340
7
$68,866
14
$83,994
3
$10,787
1
$135,700
APPLICATIONS DENIED
3
$103,717
21
$81,980
56
$81,662
7
$21,657
1
$99,360
APPLICATIONS WITHDRAWN
2
$73,530
9
$57,348
36
$94,870
2
$20,440
2
$62,460
FILES CLOSED FOR INCOMPLETENESS
0
$0
2
$30,095
7
$92,470
0
$0
0
$0
Aggregated Statistics For Year 2000 (Based on 2 partial tracts)
A) FHA, FSA/RHS & VA Home Purchase Loans
B) Conventional Home Purchase Loans
C) Refinancings
D) Home Improvement Loans
F) Non-occupant Loans on < 5 Family Dwellings (A B C & D)
Number
Average Value
Number
Average Value
Number
Average Value
Number
Average Value
Number
Average Value
LOANS ORIGINATED
8
$92,339
27
$88,766
32
$84,088
5
$22,258
6
$83,088
APPLICATIONS APPROVED, NOT ACCEPTED
1
$32,930
9
$87,946
16
$73,211
3
$34,637
5
$81,196
APPLICATIONS DENIED
3
$79,680
46
$82,763
38
$81,255
10
$28,787
1
$27,820
APPLICATIONS WITHDRAWN
1
$101,640
7
$68,460
15
$69,953
2
$37,760
1
$35,200
FILES CLOSED FOR INCOMPLETENESS
0
$0
1
$71,540
9
$81,574
1
$40,880
1
$81,200
Aggregated Statistics For Year 1999 (Based on 1 partial tract)
A) FHA, FSA/RHS & VA Home Purchase Loans
B) Conventional Home Purchase Loans
C) Refinancings
D) Home Improvement Loans
F) Non-occupant Loans on < 5 Family Dwellings (A B C & D)
Detailed PMIC statistics for the following Tracts:0021.00
2002 - 2018 National Fire Incident Reporting System (NFIRS) incidents
Based on the data from the years 2002 - 2018 the average number of fire incidents per year is 21. The highest number of fires - 34 took place in 2009, and the least - 11 in 2014. The data has an increasing trend.
When looking into fire subcategories, the most incidents belonged to: Outside Fires (40.5%), and Mobile Property/Vehicle Fires (23.8%).
Fire incident types reported to NFIRS in Zip Code 98938
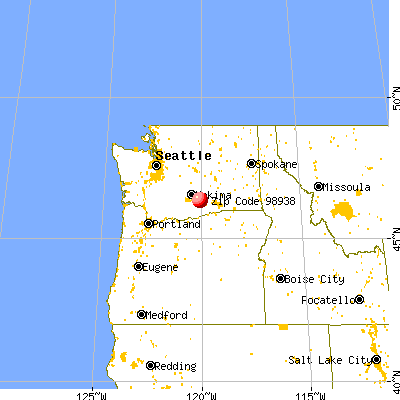


 Nearest zip codes: 98932, 98953, 98936, 98921, 98930, 98948.


 Based on the data from the years 2002 - 2018 the average number of fire incidents per year is 21. The highest number of fires - 34 took place in 2009, and the least - 11 in 2014. The data has an increasing trend.
 When looking into fire subcategories, the most incidents belonged to: Outside Fires (40.5%), and Mobile Property/Vehicle Fires (23.8%).