Bridge Statistics for Lynden, Washington (WA)
Condition, Traffic, Stress, Structural Evaluation, Project Costs
- National Bridge Inventory (NBI) Statistics
- 37Number of bridges
- 479ft / 146mTotal length
- $115,593,000Total costs
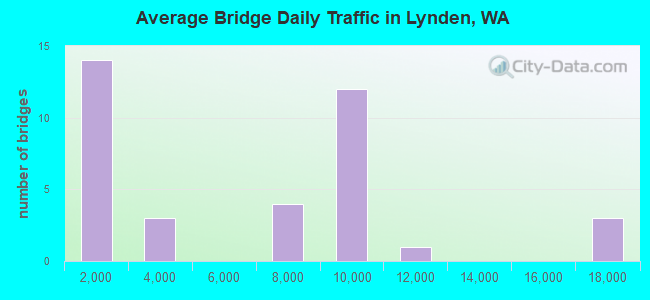
- 211,210Total average daily traffic
- 13,267Total average daily truck traffic
- 291,063Total future (year 2038) average daily traffic
- National Bridge Inventory (NBI) Registered Bridges for Lynden
- No street view available for this location
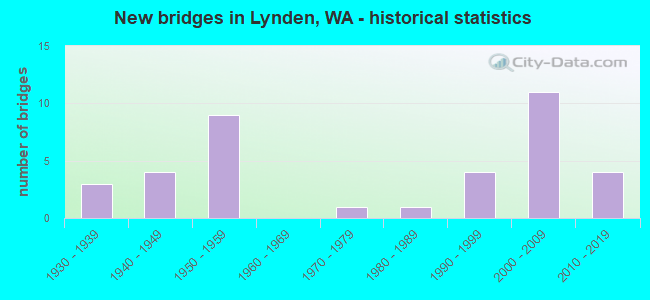
- New bridges - historical statistics
- 31930-1939
- 41940-1949
- 91950-1959
- 11970-1979
- 11980-1989
- 41990-1999
- 112000-2009
- 42010-2019
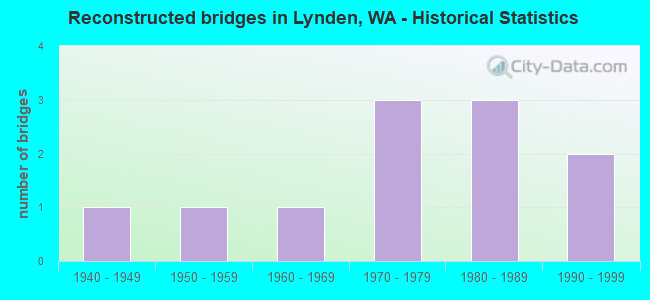
- Reconstructed bridges - Historical Statistics
- 11940-1949
- 11950-1959
- 11960-1969
- 31970-1979
- 31980-1989
- 21990-1999
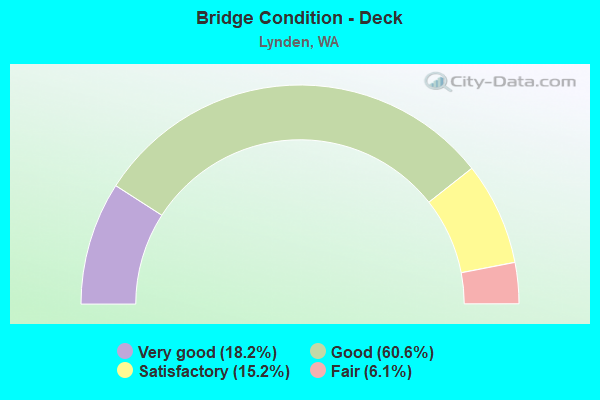
- Bridge Condition - Deck
- 18.2%Very good
- 60.6%Good
- 15.2%Satisfactory
- 6.1%Fair
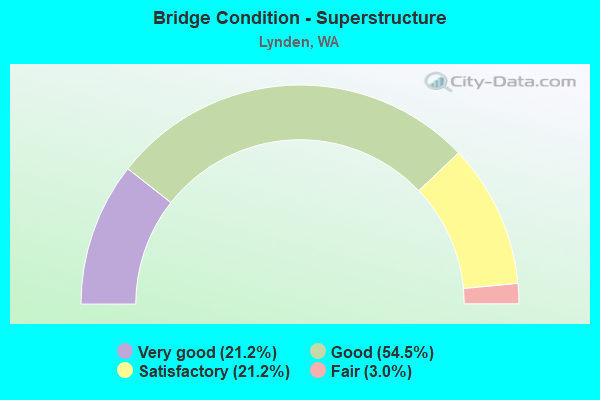
- Bridge Condition - Superstructure
- 21.2%Very good
- 54.5%Good
- 21.2%Satisfactory
- 3.0%Fair
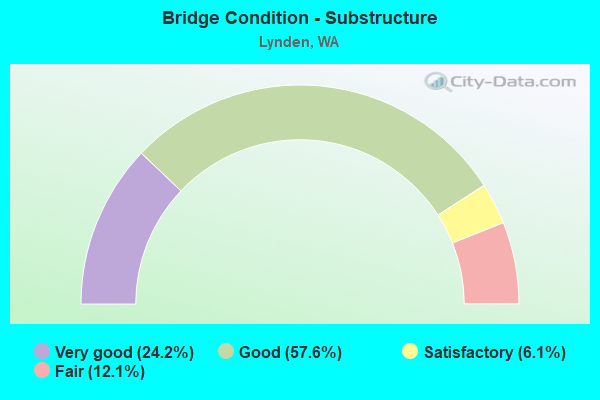
- Bridge Condition - Substructure
- 24.2%Very good
- 57.6%Good
- 6.1%Satisfactory
- 12.1%Fair
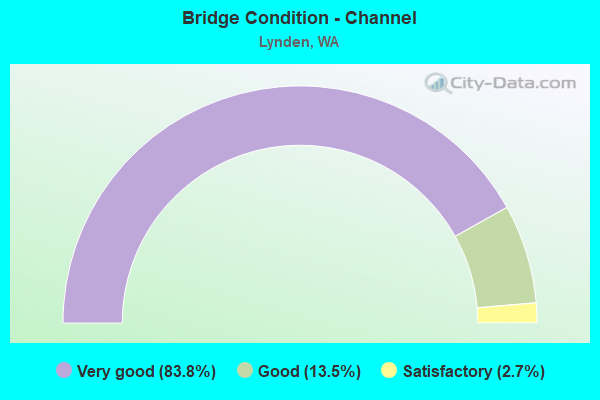
- Bridge Condition - Channel
- 83.8%Very good
- 13.5%Good
- 2.7%Satisfactory
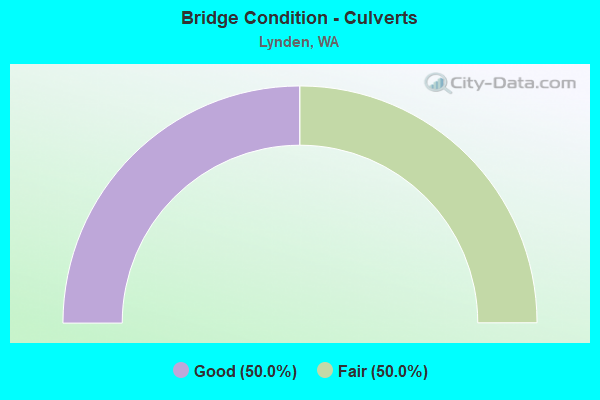
- Bridge Condition - Culverts
- 50.0%Good
- 50.0%Fair