Coastal, California
Submit your own pictures of this place and show them to the world
- OSM Map
- General Map
- Google Map
- MSN Map

| Males: 639 | |
| Females: 538 |
| Median resident age: | 45.6 years |
| California median age: | 33.3 years |
Zip code: 93920
| Coastal: | $81,099 |
| CA: | $91,551 |
Estimated per capita income in 2022: $52,732 (it was $28,732 in 2000)
Coastal CCD income, earnings, and wages data
Estimated median house or condo value in 2022: over $1,000,000 (it was $639,800 in 2000)
| Coastal: | over $1,000,000 |
| CA: | $715,900 |
Mean prices in 2022: all housing units: $955,620; detached houses: over $1,000,000; townhouses or other attached units: $741,452; in 2-unit structures: $782,213; in 3-to-4-unit structures: $910,101; in 5-or-more-unit structures: $502,903; mobile homes: $231,372; occupied boats, rvs, vans, etc.: $667,482
Detailed information about poverty and poor residents in Coastal, CA


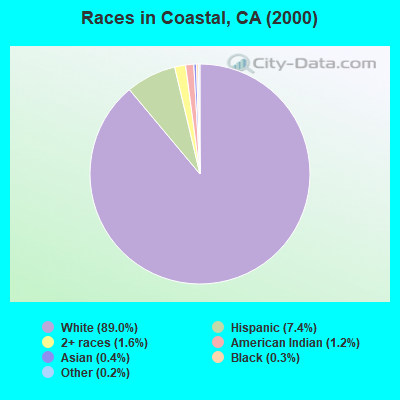
- 1,05089.0%White alone
- 877.4%Hispanic
- 191.6%Two or more races
- 141.2%American Indian alone
- 50.4%Asian alone
- 30.3%Black alone
- 20.2%Other race alone
 Recent articles from our blog. Our writers, many of them Ph.D. graduates or candidates, create easy-to-read articles on a wide variety of topics.

Current Local Time: PST time zone
Land area: 273.0 square miles.
Population density: 4.3 people per square mile (very low).

| Coastal CCD: | 0.4% ($2,358) |
| California: | 0.8% ($1,564) |
Nearest city with pop. 50,000+: Salinas, CA  (30.9 miles , pop. 151,060).
Nearest city with pop. 200,000+: San Jose, CA (73.5 miles , pop. 894,943).
Nearest city with pop. 1,000,000+: Los Angeles, CA (242.4 miles , pop. 3,694,820).
Nearest cities:
), ), ), ), ), Latitude: 36.25 N, Longitude: 121.75 W
Area code commonly used in this area: 831

| Here: | 8.6% |
| California: | 5.1% |
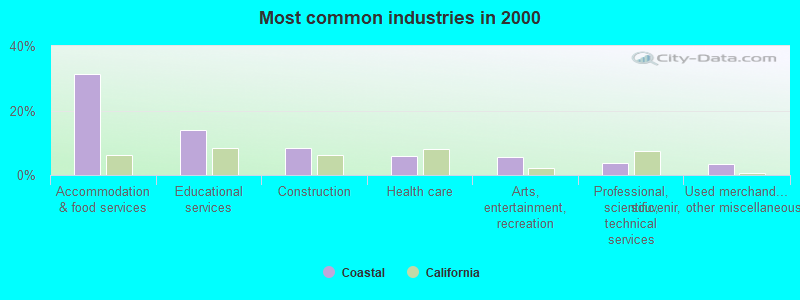
- Accommodation & food services (31.3%)
- Educational services (13.9%)
- Construction (8.5%)
- Health care (6.0%)
- Arts, entertainment, recreation (5.7%)
- Professional, scientific, technical services (3.9%)
- Used merchandise, gift, novelty, souvenir, other miscellaneous stores (3.5%)
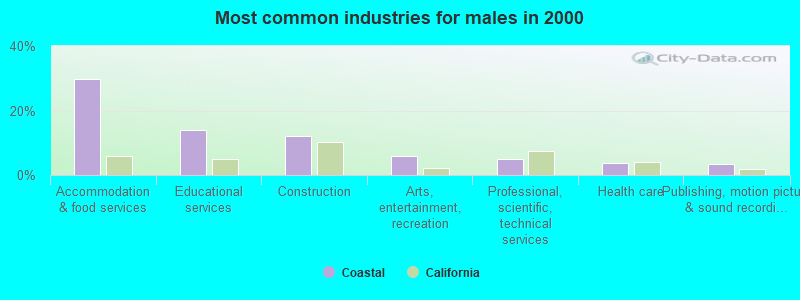
- Accommodation & food services (29.8%)
- Educational services (13.9%)
- Construction (12.0%)
- Arts, entertainment, recreation (5.7%)
- Professional, scientific, technical services (4.9%)
- Health care (3.8%)
- Publishing, motion picture & sound recording industries (3.3%)
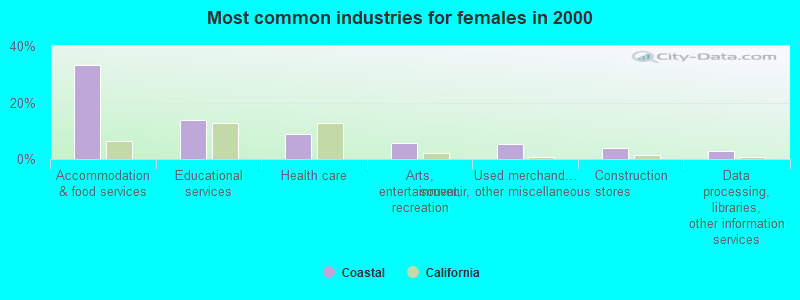
- Accommodation & food services (33.2%)
- Educational services (13.8%)
- Health care (8.8%)
- Arts, entertainment, recreation (5.7%)
- Used merchandise, gift, novelty, souvenir, other miscellaneous stores (5.3%)
- Construction (3.9%)
- Data processing, libraries, other information services (2.8%)
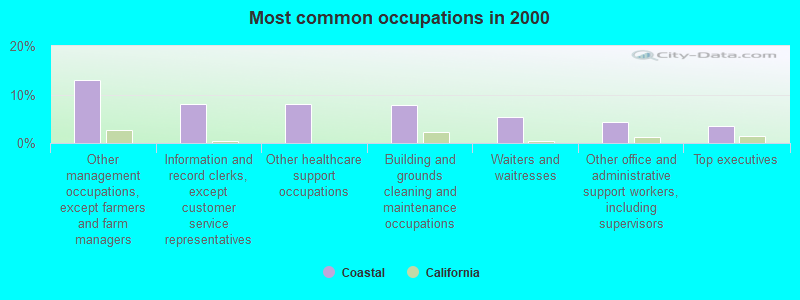
- Other management occupations, except farmers and farm managers (12.9%)
- Information and record clerks, except customer service representatives (8.0%)
- Other healthcare support occupations (8.0%)
- Building and grounds cleaning and maintenance occupations (7.9%)
- Waiters and waitresses (5.4%)
- Other office and administrative support workers, including supervisors (4.3%)
- Top executives (3.5%)
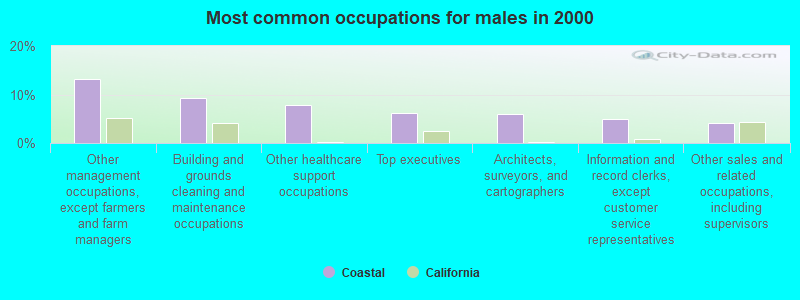
- Other management occupations, except farmers and farm managers (13.1%)
- Building and grounds cleaning and maintenance occupations (9.3%)
- Other healthcare support occupations (7.9%)
- Top executives (6.3%)
- Architects, surveyors, and cartographers (6.0%)
- Information and record clerks, except customer service representatives (4.9%)
- Other sales and related occupations, including supervisors (4.1%)
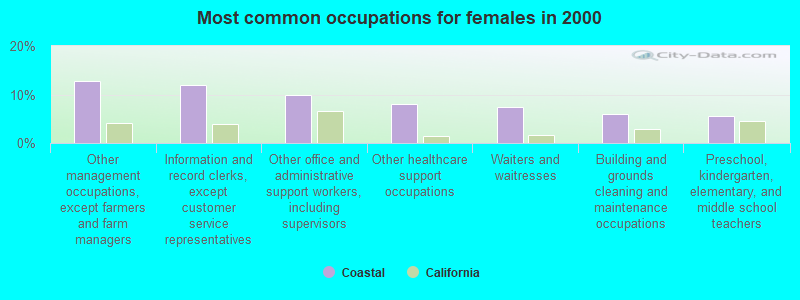
- Other management occupations, except farmers and farm managers (12.7%)
- Information and record clerks, except customer service representatives (12.0%)
- Other office and administrative support workers, including supervisors (9.9%)
- Other healthcare support occupations (8.1%)
- Waiters and waitresses (7.4%)
- Building and grounds cleaning and maintenance occupations (6.0%)
- Preschool, kindergarten, elementary, and middle school teachers (5.7%)
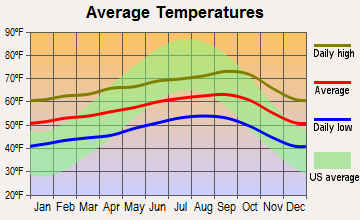
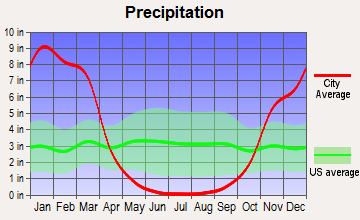
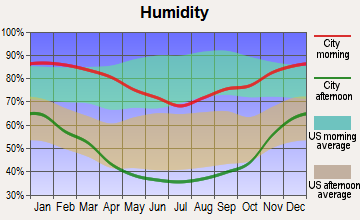
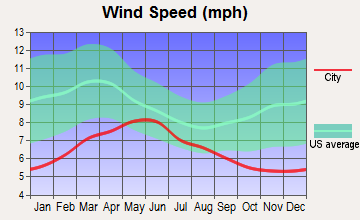
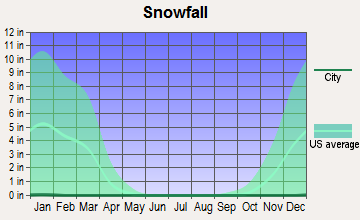
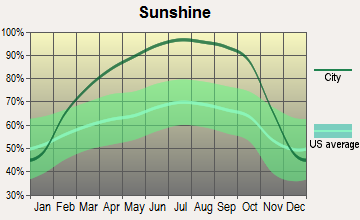
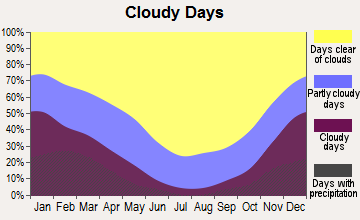
Average climate in Coastal, California
Based on data reported by over 4,000 weather stations
(lower is better)
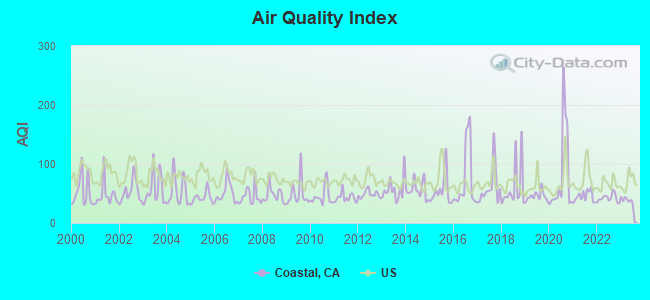
Air Quality Index (AQI) level in 2023 was 38.5. This is significantly better than average.
| City: | 38.5 |
| U.S.: | 72.6 |
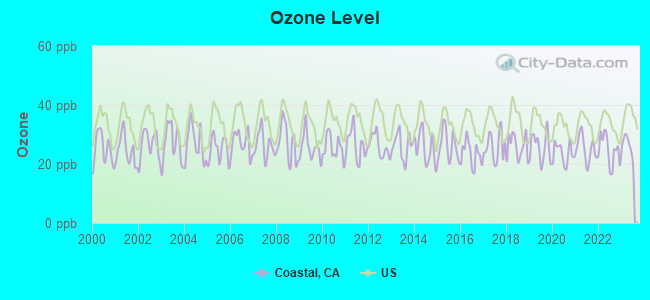
Ozone [ppb] level in 2023 was 26.0. This is better than average. Closest monitor was 16.3 miles away from the city center.
| City: | 26.0 |
| U.S.: | 33.3 |
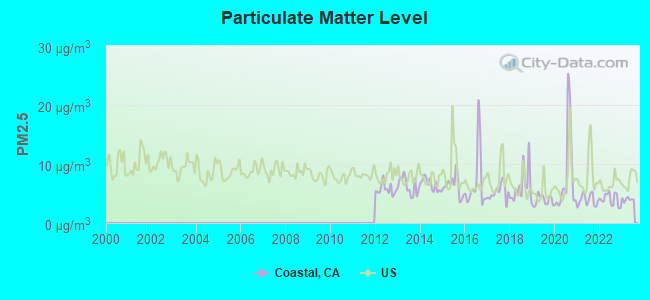
Particulate Matter (PM2.5) [µg/m3] level in 2023 was 4.00. This is significantly better than average. Closest monitor was 16.3 miles away from the city center.
| City: | 4.00 |
| U.S.: | 8.11 |
Earthquake activity:
Coastal-area historical earthquake activity is significantly above California state average. It is 7197% greater than the overall U.S. average.On 4/18/1906 at 13:12:21, a magnitude 7.9 (7.9 UK, Class: Major, Intensity: VIII - XII) earthquake occurred 139.5 miles away from Coastal center, causing $524,000,000 total damage
On 11/4/1927 at 13:51:53, a magnitude 7.5 (7.5 UK) earthquake occurred 100.6 miles away from the city center
On 7/21/1952 at 11:52:14, a magnitude 7.7 (7.7 UK) earthquake occurred 177.1 miles away from the city center, causing $50,000,000 total damage
On 10/18/1989 at 00:04:15, a magnitude 7.1 (6.5 MB, 7.1 MS, 6.9 MW, 7.0 ML) earthquake occurred 59.8 miles away from the city center, causing 62 deaths (62 shaking deaths) and 3757 injuries, causing $1,305,032,704 total damage
On 5/2/1983 at 23:42:37, a magnitude 6.7 (6.2 MB, 6.5 MS, 6.5 MW, 6.7 ML, Class: Strong, Intensity: VII - IX) earthquake occurred 80.8 miles away from the city center, causing $31,000,000 total damage
On 12/22/2003 at 19:15:56, a magnitude 6.6 (6.1 MB, 6.4 MS, 6.6 MW, 6.4 MW) earthquake occurred 57.8 miles away from the city center, causing 2 deaths (2 shaking deaths) and 40 injuries, causing $200,000,000 total damage
Magnitude types: body-wave magnitude (MB), local magnitude (ML), surface-wave magnitude (MS), moment magnitude (MW)
Natural disasters:
The number of natural disasters in Monterey County (23) is greater than the US average (15).Major Disasters (Presidential) Declared: 14
Emergencies Declared: 3
Causes of natural disasters: Floods: 12, Winter Storms: 7, Storms: 6, Fires: 4, Landslides: 4, Mudslides: 4, Freezes: 2, Drought: 1, Earthquake: 1, Hurricane: 1, Tornado: 1, Tsunami Wave: 1, Other: 1 (Note: some incidents may be assigned to more than one category).
Colleges/universities with over 2000 students nearest to Coastal:
- Monterey Peninsula College (about 25 miles; Monterey, CA; Full-time enrollment: 4,588)
- Naval Postgraduate School (about 26 miles; Monterey, CA; FT enrollment: 4,951)
- California State University-Monterey Bay (about 29 miles; Seaside, CA; FT enrollment: 5,125)
- Hartnell College (about 30 miles; Salinas, CA; FT enrollment: 5,506)
- Gavilan College (about 52 miles; Gilroy, CA; FT enrollment: 3,327)
- Cabrillo College (about 53 miles; Aptos, CA; FT enrollment: 7,729)
- University of California-Santa Cruz (about 55 miles; Santa Cruz, CA; FT enrollment: 17,751)
Points of interest:
Notable locations in Coastal: Jackson Camp (A), Higgins Camp (B), Outlaw Camp (C), P B S S P South Campground (D), Lone Pine Camp (E), Pico Blanco Boy Scout Camp (F), Escondido Camp Ground (G), Comings Cabin (H), Cold Spring Camp (I), Cienega Camp (J), Big Sur Guard Station (K), Barlow Flat Camp (L), Pat Springs Camp (M), Anderson Landing (N), Pine Ridge Camp (O), Redwood Creek Camp (P), Sawmill Flat Campground (Q), Strawberry Camp (R), Tan Oak Camp (S), Ventana Camp (T). Display/hide their locations on the map
Rivers and creeks: Higgins Creek (A), North Fork Big Sur River (B), Garrapata Creek (C), Doud Creek (D), Doolans Hole Creek (E), Dolores Creek (F), Mule Canyon Creek (G), Mocho Creek (H), Mill Creek (I). Display/hide their locations on the map
Parks in Coastal include: Pfeiffer Big Sur State Park (1), Limekiln State Park (2), Point Sur State Historic Park (3), Garrapata State Park (4), Julia Pfeiffer Burns State Park (5), Andrew Molera State Park (6). Display/hide their locations on the map
Beaches: Pfeiffer Beach (A), Wreck Beach (B). Display/hide their locations on the map
| This place: | 2.1 people |
| California: | 2.9 people |
| This place: | 34.3% |
| Whole state: | 69.4% |
| This place: | 7.9% |
| Whole state: | 5.9% |
Likely homosexual households (counted as self-reported same-sex unmarried-partner households)
- Lesbian couples: 0.0% of all households
- Gay men: 0.7% of all households
| This place: | 12.0% |
| Whole state: | 14.2% |
| This place: | 8.6% |
| Whole state: | 6.3% |
For population 15 years and over in Coastal:
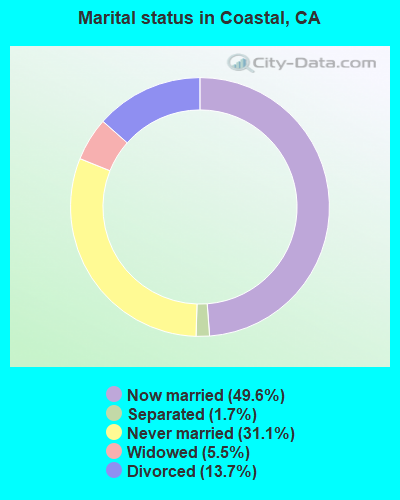
- Never married: 31.1%
- Now married: 49.6%
- Separated: 1.7%
- Widowed: 5.5%
- Divorced: 13.7%
For population 25 years and over in Coastal:
- High school or higher: 94.0%
- Bachelor's degree or higher: 45.2%
- Graduate or professional degree: 11.7%
- Unemployed: 6.9%
- Mean travel time to work (commute): 22.9 minutes
| Here: | 9.5 |
| California average: | 16.1 |
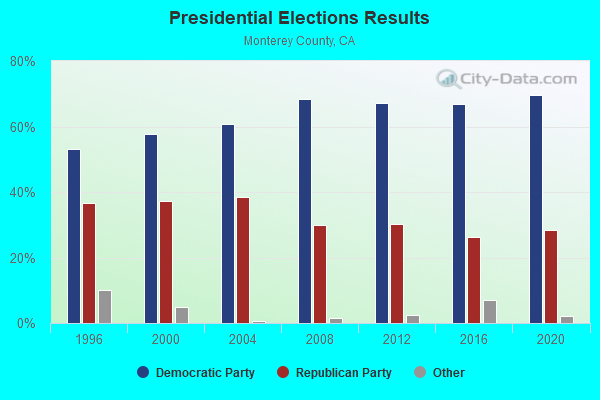
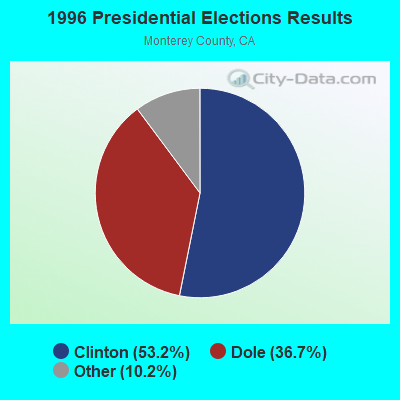
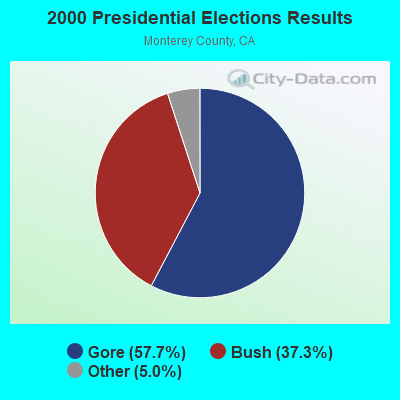
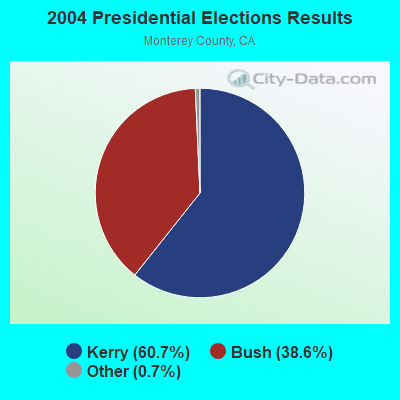
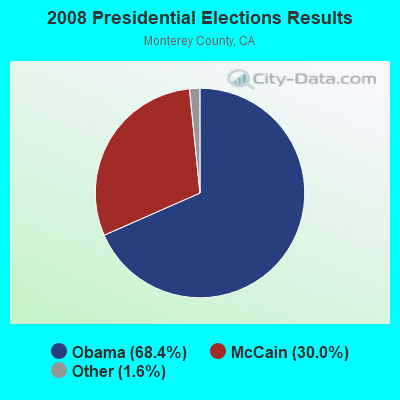
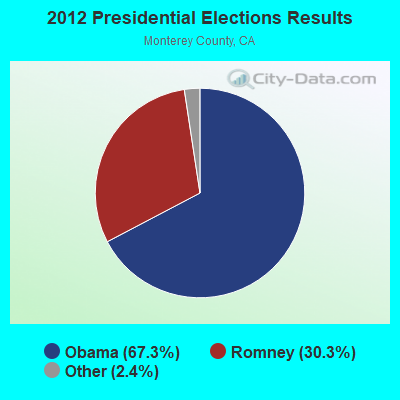
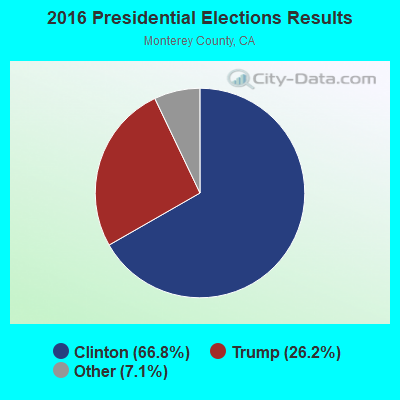
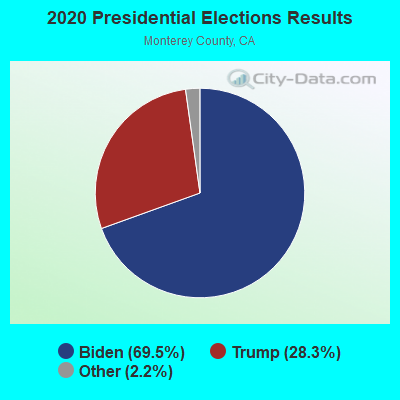
Graphs represent county-level data. Detailed 2008 Election Results
Religion statistics for Coastal, CA (based on Monterey County data)
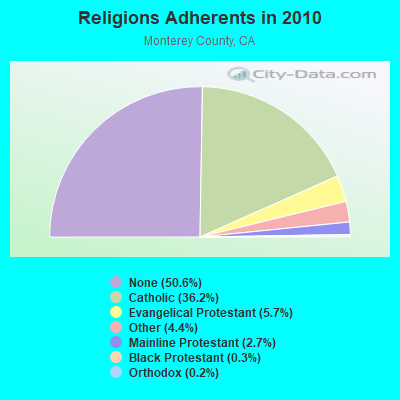
| Religion | Adherents | Congregations |
|---|---|---|
| Catholic | 150,050 | 26 |
| Evangelical Protestant | 23,624 | 154 |
| Other | 18,309 | 48 |
| Mainline Protestant | 11,244 | 48 |
| Black Protestant | 1,199 | 8 |
| Orthodox | 640 | 3 |
| None | 209,991 | - |
Food Environment Statistics:
| Here: | 2.82 / 10,000 pop. |
| California: | 2.14 / 10,000 pop. |
| Monterey County: | 0.05 / 10,000 pop. |
| California: | 0.04 / 10,000 pop. |
| Monterey County: | 0.91 / 10,000 pop. |
| California: | 0.62 / 10,000 pop. |
| Monterey County: | 2.00 / 10,000 pop. |
| California: | 1.49 / 10,000 pop. |
| Monterey County: | 9.24 / 10,000 pop. |
| California: | 7.42 / 10,000 pop. |
| This county: | 7.5% |
| California: | 7.3% |
| This county: | 21.8% |
| State: | 21.3% |
| Monterey County: | 18.4% |
| California: | 17.9% |
4.96% of this county's 2021 resident taxpayers lived in other counties in 2020 ($91,945 average adjusted gross income)
| Here: | 4.96% |
| California average: | 5.19% |
0.08% of residents moved from foreign countries ($1,276 average AGI)
Monterey County: 0.08% California average: 0.03%
Top counties from which taxpayers relocated into this county between 2020 and 2021:
| from Santa Cruz County, CA | |
| from Santa Clara County, CA | |
| from Los Angeles County, CA |
6.17% of this county's 2020 resident taxpayers moved to other counties in 2021 ($76,219 average adjusted gross income)
| Here: | 6.17% |
| California average: | 6.14% |
0.08% of residents moved to foreign countries ($1,055 average AGI)
Monterey County: 0.08% California average: 0.02%
Top counties to which taxpayers relocated from this county between 2020 and 2021:
| to Santa Cruz County, CA | |
| to Santa Clara County, CA | |
| to Los Angeles County, CA |
Strongest AM radio stations in Coastal:
- KYAA (1200 AM; 25 kW; SOQUEL, CA; Owner: PEOPLE'S RADIO, INC.)
- KSRK (540 AM; 10 kW; CARMEL VALLEY, CA; Owner: PEOPLE'S RADIO, INC.)
- KMBX (700 AM; 10 kW; SOLEDAD, CA; Owner: ENTRAVISION HOLDINGS, LLC)
- KKMC (880 AM; 10 kW; GONZALES, CA; Owner: MONTEREY COUNTY BROADCASTERS, INC.)
- KDBV (980 AM; 10 kW; SALINAS, CA; Owner: WOLFHOUSE RADIO GROUP, INC.)
- KNBR (680 AM; 50 kW; SAN FRANCISCO, CA; Owner: KNBR LICO, INC.)
- KLOK (1170 AM; 50 kW; SAN JOSE, CA; Owner: ENTRAVISION HOLDINGS, LLC)
- KGO (810 AM; 50 kW; SAN FRANCISCO, CA; Owner: KGO-AM RADIO, INC.)
- KION (1460 AM; 10 kW; SALINAS, CA)
- KTCT (1050 AM; 50 kW; SAN MATEO, CA; Owner: SUSQUEHANNA RADIO CORP.)
- KGDP (660 AM; 50 kW; ORCUTT, CA; Owner: RADIO REPRESENTATIVES, INC.)
- KFAX (1100 AM; 50 kW; SAN FRANCISCO, CA; Owner: GOLDEN GATE BROADCASTING CO, INC.)
- KCBC (770 AM; 50 kW; RIVERBANK, CA; Owner: KIERTRON, INC.)
Strongest FM radio stations in Coastal:
- KUSP (88.9 FM; SANTA CRUZ, CA; Owner: PATAPHYSICAL B/CING. FOUNDATION,INC.)
- K260AA (99.9 FM; CARMEL VALLEY, CA; Owner: ENTRAVISION HOLDINGS, LLC)
- KWAV (96.9 FM; MONTEREY, CA; Owner: BUCKLEY BROADCASTING OF MONTEREY)
- KTOM-FM (100.7 FM; SALINAS, CA; Owner: CLEAR CHANNEL BROADCASTING LICENSES, INC.)
- K291AE (106.1 FM; SEASIDE, CA; Owner: MAPELTON COMMUNICATIONS, LLC)
- KSEA (107.9 FM; GREENFIELD, CA; Owner: FARMWORKER EDU'AL RADIO NETWORK, INC)
- K240AK (95.9 FM; SOLEDAD, CA; Owner: CALVARY CHAPEL OF TWIN FALLS, INC.)
- K265DK (100.9 FM; GREENFIELD, CA; Owner: CLEAR CHANNEL BROADCASTING LICENSES, INC.)
- K290AE (105.9 FM; BIG SUR VALLEY, CA; Owner: PATAPHYSICAL BROADCASTING FOUNDATION, INC)
- KDON-FM (102.5 FM; SALINAS, CA; Owner: CLEAR CHANNEL BROADCASTING LICENSES, INC.)
- K202DU (88.3 FM; SAN JUAN BAUTISTA, CA; Owner: CALVARY CHAPEL OF TWIN FALLS, INC.)
- KBTU (93.5 FM; HOLLISTER, CA; Owner: MAPLETON COMMUNICATIONS, L.L.C.)
- KOCN (105.1 FM; PACIFIC GROVE, CA; Owner: CLEAR CHANNEL BROADCASTING LICENSES, INC.)
- KLVM (89.7 FM; PRUNEDALE, CA; Owner: PRUNEDALE EDUCATIONAL ASSOCIATION)
- K265DG (100.9 FM; HOLLISTER, CA; Owner: CLEAR CHANNEL BROADCASTING LICENSES, INC.)
- K206BQ (89.1 FM; HOLLISTER, CA; Owner: PATAPHYSICAL BROADCASTING FOUNDATION, INC.)
- KMBY-FM (103.9 FM; SEASIDE, CA; Owner: MAPLETON COMMUNICATIONS, LLC)
- KSQL (99.1 FM; SANTA CRUZ, CA; Owner: TMS LICENSE CALIFORNIA, INC)
- KRKC-FM (102.1 FM; KING CITY, CA; Owner: KING CITY COMMUNICATIONS CORPORATION)
- KKUP (91.5 FM; CUPERTINO, CA; Owner: ASSURANCE SCIENCES FOUNDATION)
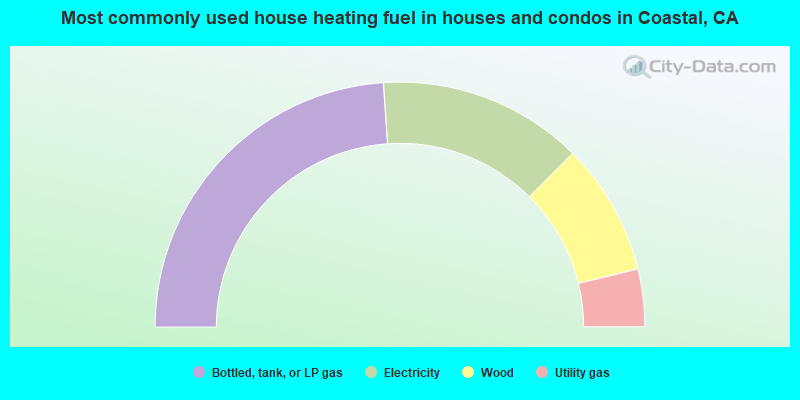
- 47.9%Bottled, tank, or LP gas
- 27.1%Electricity
- 17.5%Wood
- 7.6%Utility gas
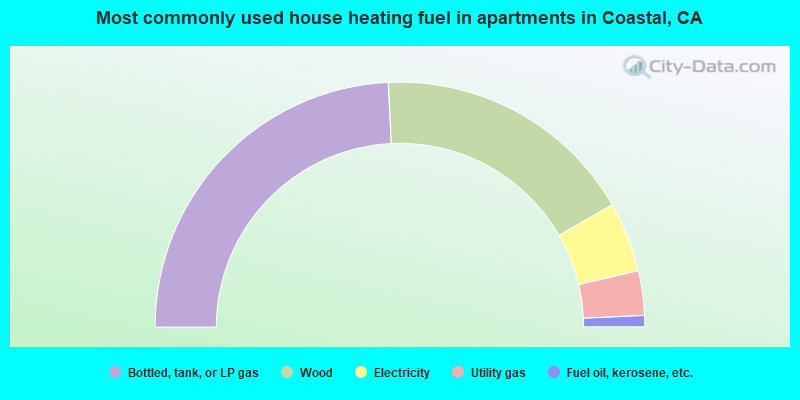
- 48.5%Bottled, tank, or LP gas
- 34.9%Wood
- 9.2%Electricity
- 5.9%Utility gas
- 1.5%Fuel oil, kerosene, etc.
Coastal compared to California state average:
- Unemployed percentage below state average.
- Black race population percentage significantly below state average.
- Hispanic race population percentage significantly below state average.
- Median age significantly above state average.
- Foreign-born population percentage significantly below state average.
- Renting percentage significantly below state average.
- Length of stay since moving in significantly above state average.
- Number of rooms per house significantly below state average.
- House age significantly below state average.
- Percentage of population with a bachelor's degree or higher above state average.
Coastal on our top lists:
- #15 on the list of "Top 101 cities with the largest percentage of people in religious group quarters (population 1,000+)"
- #20 on the list of "Top 100 cities with highest ratio of median house value to median household income"
- #53 on the list of "Top 101 cities with the lowest percentage of family households, population 1,000+"
- #15 on the list of "Top 101 counties with the highest Nitrogen Dioxide air pollution readings in 2012 (ppm)"
- #20 on the list of "Top 101 counties with the lowest surface withdrawal of fresh water for public supply (pop. 50,000+)"
- #33 on the list of "Top 101 counties with the highest number of births per 1000 residents 2007-2013"
- #44 on the list of "Top 101 counties with the lowest Particulate Matter (PM2.5) Annual air pollution readings in 2012 (µg/m3)"
- #54 on the list of "Top 101 counties with the highest Particulate Matter (PM10) Annual air pollution readings in 2012 (µg/m3)"