Red Mountain-Trona, California
Submit your own pictures of this place and show them to the world
- OSM Map
- Google Map
- MSN Map
| Males: 1,352 | |
| Females: 1,307 |
| Median resident age: | 37.5 years |
| California median age: | 33.3 years |
| Red Mountain-Trona: | $68,818 |
| CA: | $91,551 |
Estimated per capita income in 2022: $31,792 (it was $17,001 in 2000)
Red Mountain-Trona CCD income, earnings, and wages data
Estimated median house or condo value in 2022: $118,730 (it was $29,400 in 2000)
| Red Mountain-Trona: | $118,730 |
| CA: | $715,900 |
Mean prices in 2022: all housing units: $538,674; detached houses: $572,275; townhouses or other attached units: $512,095; in 2-unit structures: $547,337; in 3-to-4-unit structures: $471,159; in 5-or-more-unit structures: $418,370; mobile homes: $119,083; occupied boats, rvs, vans, etc.: $73,388
Red Mountain-Trona, CA residents, houses, and apartments details
Detailed information about poverty and poor residents in Red Mountain-Trona, CA


- 1,81979.3%White alone
- 32314.1%Hispanic
- 592.6%Two or more races
- 341.5%Black alone
- 321.4%American Indian alone
- 140.6%Asian alone
- 80.3%Native Hawaiian and Other
Pacific Islander alone - 40.2%Other race alone

 Recent articles from our blog. Our writers, many of them Ph.D. graduates or candidates, create easy-to-read articles on a wide variety of topics.

Current Local Time: PST time zone
Land area: 1356.9 square miles.
Population density: 2.0 people per square mile (very low).
| Red Mountain-Trona CCD: | 1.2% ($362) |
| California: | 0.8% ($1,564) |
Nearest city with pop. 50,000+: East Kern, CA (40.5 miles  , pop. 69,614).
Nearest city with pop. 200,000+: Bakersfield, CA (90.3 miles , pop. 247,057).
Nearest city with pop. 1,000,000+: Los Angeles, CA (116.1 miles , pop. 3,694,820).
Nearest cities:
Latitude: 35.58 N, Longitude: 117.45 W
Area code commonly used in this area: 760

| Here: | 5.0% |
| California: | 5.1% |
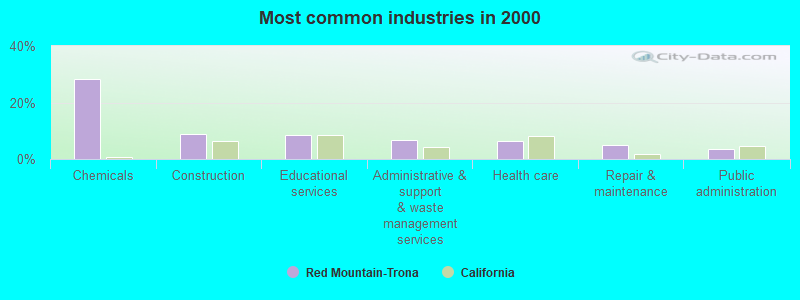
- Chemicals (28.2%)
- Construction (8.7%)
- Educational services (8.5%)
- Administrative & support & waste management services (6.6%)
- Health care (6.3%)
- Repair & maintenance (5.0%)
- Public administration (3.7%)
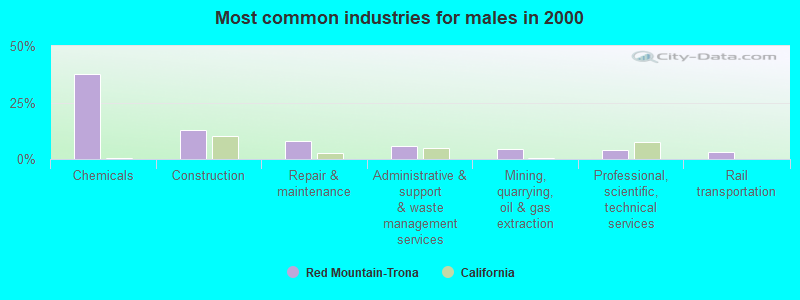
- Chemicals (37.8%)
- Construction (12.8%)
- Repair & maintenance (8.0%)
- Administrative & support & waste management services (6.0%)
- Mining, quarrying, oil & gas extraction (4.3%)
- Professional, scientific, technical services (4.1%)
- Rail transportation (3.0%)
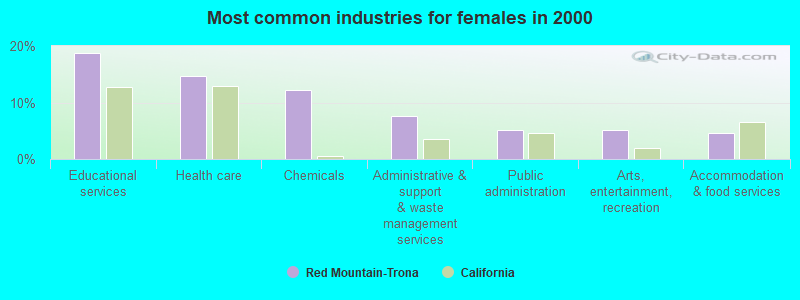
- Educational services (18.7%)
- Health care (14.7%)
- Chemicals (12.3%)
- Administrative & support & waste management services (7.7%)
- Public administration (5.2%)
- Arts, entertainment, recreation (5.2%)
- Accommodation & food services (4.6%)

- Vehicle and mobile equipment mechanics, installers, and repairers (6.4%)
- Building and grounds cleaning and maintenance occupations (6.3%)
- Life, physical, and social science technicians (5.1%)
- Electrical equipment mechanics and other installation, maintenance, and repair workers, including supervisors (4.5%)
- Other management occupations, except farmers and farm managers (3.8%)
- Metal workers and plastic workers (3.6%)
- Secretaries and administrative assistants (3.4%)

- Vehicle and mobile equipment mechanics, installers, and repairers (10.2%)
- Electrical equipment mechanics and other installation, maintenance, and repair workers, including supervisors (7.3%)
- Life, physical, and social science technicians (6.0%)
- Metal workers and plastic workers (5.8%)
- Supervisors, construction and extraction workers (5.0%)
- Laborers and material movers, hand (4.5%)
- Electricians (4.3%)

- Building and grounds cleaning and maintenance occupations (12.0%)
- Secretaries and administrative assistants (8.9%)
- Child care workers (7.1%)
- Bookkeeping, accounting, and auditing clerks (5.8%)
- Other management occupations, except farmers and farm managers (4.3%)
- Nursing, psychiatric, and home health aides (4.0%)
- Health technologists and technicians (4.0%)
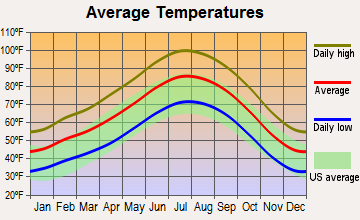
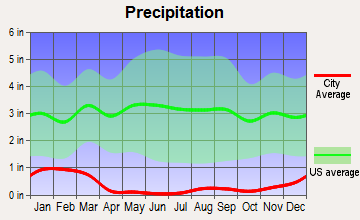
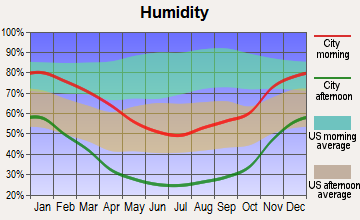
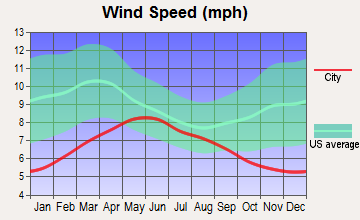
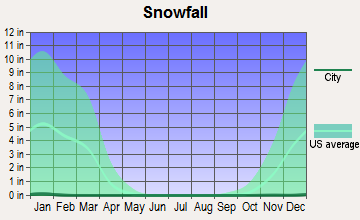
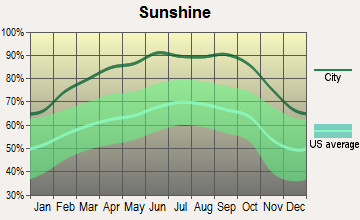
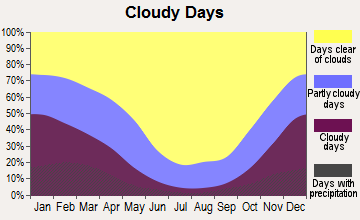
Average climate in Red Mountain-Trona, California
Based on data reported by over 4,000 weather stations
(lower is better)

Air Quality Index (AQI) level in 2022 was 107. This is significantly worse than average.
| City: | 107 |
| U.S.: | 73 |

Nitrogen Dioxide (NO2) [ppb] level in 2022 was 3.61. This is significantly better than average. Closest monitor was 13.0 miles away from the city center.
| City: | 3.61 |
| U.S.: | 5.11 |

Sulfur Dioxide (SO2) [ppb] level in 2021 was 0.809. This is significantly better than average. Closest monitor was 13.0 miles away from the city center.
| City: | 0.809 |
| U.S.: | 1.515 |

Ozone [ppb] level in 2022 was 37.5. This is about average. Closest monitor was 13.0 miles away from the city center.
| City: | 37.5 |
| U.S.: | 33.3 |

Particulate Matter (PM10) [µg/m3] level in 2022 was 23.7. This is worse than average. Closest monitor was 12.6 miles away from the city center.
| City: | 23.7 |
| U.S.: | 19.2 |

Particulate Matter (PM2.5) [µg/m3] level in 2022 was 4.23. This is significantly better than average. Closest monitor was 12.6 miles away from the city center.
| City: | 4.23 |
| U.S.: | 8.11 |
Earthquake activity:
Red Mountain-Trona-area historical earthquake activity is significantly above California state average. It is 8259% greater than the overall U.S. average.On 7/21/1952 at 11:52:14, a magnitude 7.7 (7.7 UK, Class: Major, Intensity: VIII - XII) earthquake occurred 96.2 miles away from the city center, causing $50,000,000 total damage
On 6/28/1992 at 11:57:34, a magnitude 7.6 (6.2 MB, 7.6 MS, 7.3 MW, Depth: 0.7 mi) earthquake occurred 110.0 miles away from Red Mountain-Trona center, causing 3 deaths (1 shaking deaths, 2 other deaths) and 400 injuries, causing $100,000,000 total damage and $40,000,000 insured losses
On 10/16/1999 at 09:46:44, a magnitude 7.4 (6.3 MB, 7.4 MS, 7.2 MW, 7.3 ML) earthquake occurred 93.7 miles away from the city center
On 11/4/1927 at 13:51:53, a magnitude 7.5 (7.5 UK) earthquake occurred 207.3 miles away from the city center
On 6/28/1992 at 15:05:30, a magnitude 6.9 (6.3 MB, 6.7 MS, 6.5 MW, 6.9 ME, Depth: 3.1 mi, Class: Strong, Intensity: VII - IX) earthquake occurred 96.5 miles away from the city center
On 5/19/1940 at 04:36:40, a magnitude 7.2 (7.2 UK) earthquake occurred 191.6 miles away from Red Mountain-Trona center, causing $33,000,000 total damage
Magnitude types: body-wave magnitude (MB), energy magnitude (ME), local magnitude (ML), surface-wave magnitude (MS), moment magnitude (MW)
Natural disasters:
The number of natural disasters in San Bernardino County (46) is a lot greater than the US average (15).Major Disasters (Presidential) Declared: 27
Emergencies Declared: 2
Causes of natural disasters: Fires: 24, Floods: 18, Storms: 9, Winter Storms: 6, Landslides: 5, Mudslides: 4, Heavy Rains: 2, Earthquake: 1, Flash Flood: 1, Freeze: 1, Hurricane: 1, Snow: 1, Tornado: 1, Tropical Storm: 1, Wind: 1, Other: 1 (Note: some incidents may be assigned to more than one category).
Hospitals and medical centers near Red Mountain-Trona:
- INDIAN WELLS VALLEY (Dialysis Facility, about 11 miles away; RIDGECREST, CA)
- RIDGECREST REGIONAL HOSPITAL Acute Care Hospitals (about 13 miles away; RIDGECREST, CA)
- INDIAN WELLS VALLEY SURGERY CENTER (Hospital, about 13 miles away; RIDGECREST, CA)
- RIDGECREST HEALTHCARE CENTER (Nursing Home, about 13 miles away; RIDGECREST, CA)
- RIDGECREST REGIONAL HOSPITAL HOME HEALTH AGENCY (Home Health Center, about 14 miles away; RIDGECREST, CA)
- SANDERSON'S HOME HEALTH AGENCY (Home Health Center, about 14 miles away; RIDGECREST, CA)
Colleges/universities with over 2000 students nearest to Red Mountain-Trona:
- Cerro Coso Community College (about 13 miles; Ridgecrest, CA; Full-time enrollment: 2,420)
- Barstow Community College (about 55 miles; Barstow, CA; FT enrollment: 2,120)
- Antelope Valley College (about 76 miles; Lancaster, CA; FT enrollment: 9,206)
- Victor Valley College (about 78 miles; Victorville, CA; FT enrollment: 7,630)
- Bakersfield College (about 87 miles; Bakersfield, CA; FT enrollment: 10,325)
- Porterville College (about 94 miles; Porterville, CA; FT enrollment: 2,560)
- California State University-Bakersfield (about 95 miles; Bakersfield, CA; FT enrollment: 7,564)
Points of interest:
Notable locations in Red Mountain-Trona: Landmark Letter (A), P K Ranch (B), Stone Corral (C), Summit Diggings (D), The Y (E), Browns Ranch (F), Trona Water Pipeline (G), Searles Valley Minerals Fire Department West End Station (H), Bureau of Land Management - Salt Wells Fire Station (I), San Bernardino County Fire Department Station 57 Trona (J), Searles Valley Minerals Fire Department (K), Randsburg Wash Headquarters (L), Trona Branch San Bernardino County Library (M), Harada House (N). Display/hide their locations on the map
Lakes and reservoirs: Little Dry Lake (A), Searles Lake (B). Display/hide their locations on the map
Streams, rivers, and creeks: Teagle Wash (A). Display/hide its location on the map
| This place: | 2.5 people |
| California: | 2.9 people |
| This place: | 45.4% |
| Whole state: | 69.4% |
| This place: | 6.2% |
| Whole state: | 5.9% |
Likely homosexual households (counted as self-reported same-sex unmarried-partner households)
- Lesbian couples: 0.1% of all households
- Gay men: 0.1% of all households
| This place: | 18.9% |
| Whole state: | 14.2% |
| This place: | 4.7% |
| Whole state: | 6.3% |
For population 15 years and over in Red Mountain-Trona:

- Never married: 19.7%
- Now married: 58.6%
- Separated: 4.4%
- Widowed: 6.3%
- Divorced: 15.3%
For population 25 years and over in Red Mountain-Trona:
- High school or higher: 81.4%
- Bachelor's degree or higher: 9.1%
- Graduate or professional degree: 2.3%
- Unemployed: 6.7%
- Mean travel time to work (commute): 15.7 minutes


| Here: | 9.2 |
| California average: | 16.1 |
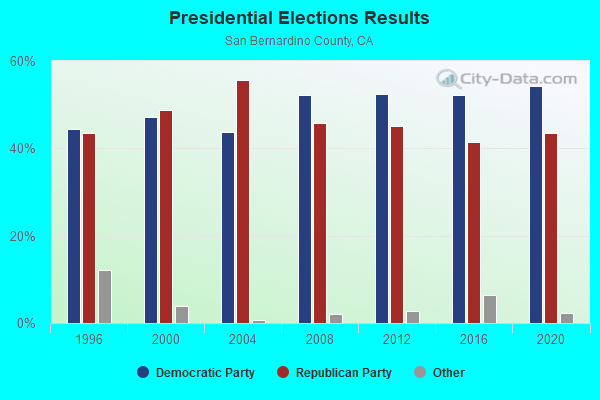
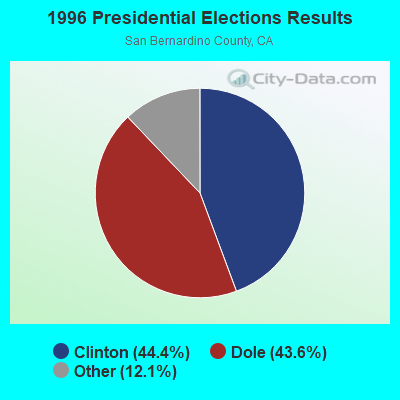
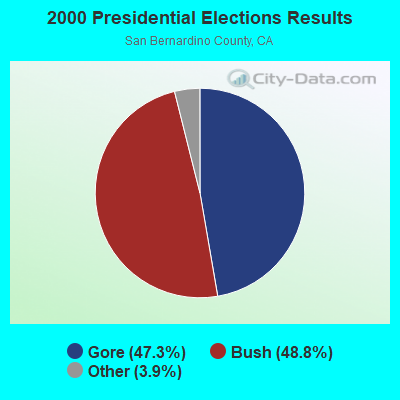
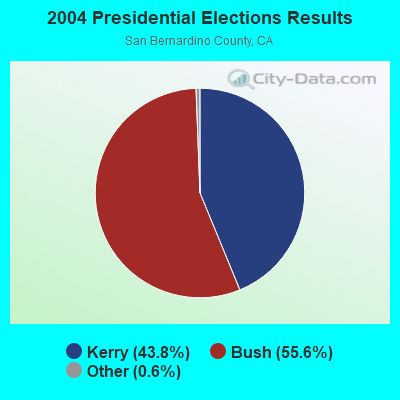
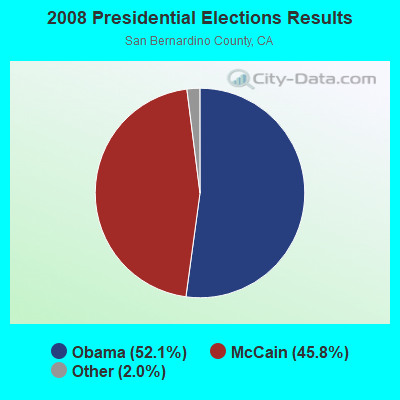
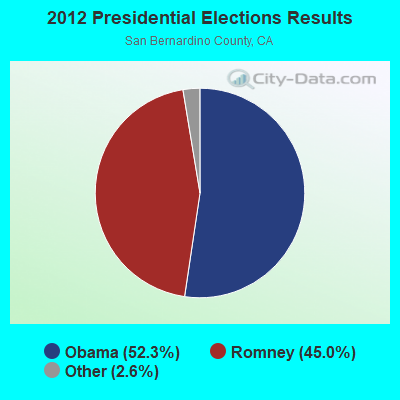
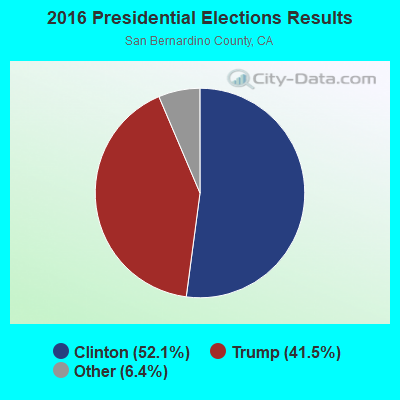
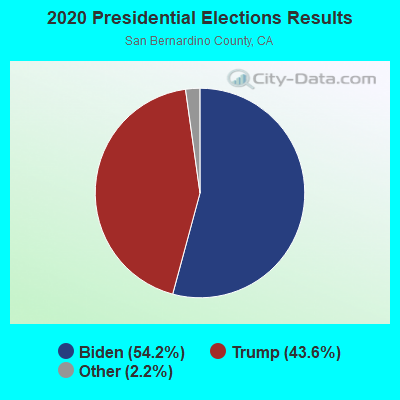
Graphs represent county-level data. Detailed 2008 Election Results
Religion statistics for Red Mountain-Trona, CA (based on San Bernardino County data)
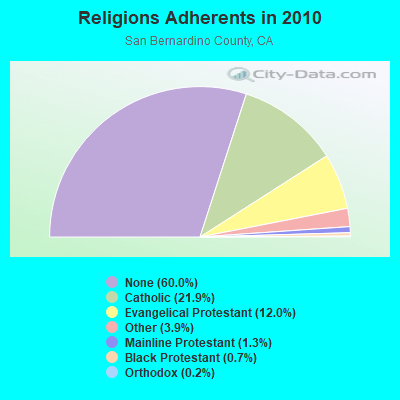
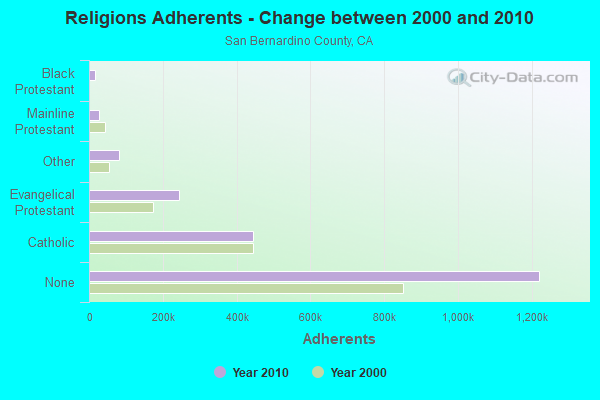
| Religion | Adherents | Congregations |
|---|---|---|
| Catholic | 445,334 | 55 |
| Evangelical Protestant | 243,524 | 832 |
| Other | 80,047 | 205 |
| Mainline Protestant | 26,062 | 135 |
| Black Protestant | 14,969 | 37 |
| Orthodox | 3,868 | 10 |
| None | 1,221,406 | - |
Food Environment Statistics:
| This county: | 1.50 / 10,000 pop. |
| State: | 2.14 / 10,000 pop. |
| San Bernardino County: | 0.05 / 10,000 pop. |
| California: | 0.04 / 10,000 pop. |
| Here: | 0.57 / 10,000 pop. |
| State: | 0.62 / 10,000 pop. |
| San Bernardino County: | 1.60 / 10,000 pop. |
| State: | 1.49 / 10,000 pop. |
| San Bernardino County: | 4.69 / 10,000 pop. |
| State: | 7.42 / 10,000 pop. |
| This county: | 7.4% |
| State: | 7.3% |
| This county: | 27.1% |
| California: | 21.3% |
| San Bernardino County: | 16.2% |
| California: | 17.9% |
6.45% of this county's 2021 resident taxpayers lived in other counties in 2020 ($54,954 average adjusted gross income)
| Here: | 6.45% |
| California average: | 5.19% |
0.03% of residents moved from foreign countries ($259 average AGI)
San Bernardino County: 0.03% California average: 0.03%
Top counties from which taxpayers relocated into this county between 2020 and 2021:
| from Los Angeles County, CA | |
| from Riverside County, CA | |
| from Orange County, CA |
6.46% of this county's 2020 resident taxpayers moved to other counties in 2021 ($59,647 average adjusted gross income)
| Here: | 6.46% |
| California average: | 6.14% |
0.03% of residents moved to foreign countries ($253 average AGI)
San Bernardino County: 0.03% California average: 0.02%
Top counties to which taxpayers relocated from this county between 2020 and 2021:
| to Riverside County, CA | |
| to Los Angeles County, CA | |
| to Orange County, CA |
Strongest AM radio stations in Red Mountain-Trona:
- KIRN (670 AM; 35 kW; SIMI VALLEY, CA; Owner: LOTUS OXNARD CORP.)
- KLAC (570 AM; 50 kW; LOS ANGELES, CA; Owner: AMFM RADIO LICENSES, L.L.C.)
- KWDJ (1360 AM; 1 kW; RIDGECREST, CA)
- KSPN (710 AM; 50 kW; LOS ANGELES, CA; Owner: KABC-AM RADIO, INC.)
- KFI (640 AM; 50 kW; LOS ANGELES, CA; Owner: CAPSTAR TX LIMITED PARTNERSHIP)
- KMJ (580 AM; 50 kW; FRESNO, CA; Owner: INFINITY RADIO OPERATIONS INC.)
- KPLS (830 AM; 50 kW; ORANGE, CA; Owner: CRN LICENSES, LLC)
- KDIS (1110 AM; 50 kW; PASADENA, CA; Owner: ABC,INC.)
- KFWB (980 AM; 50 kW; LOS ANGELES, CA; Owner: INFINITY BROADCASTING OPERATIONS, INC.)
- KTNQ (1020 AM; 50 kW; LOS ANGELES, CA; Owner: KTNQ-AM LICENSE CORP.)
- KERI (1180 AM; 50 kW; WASCO-GREENACRES, CA; Owner: KWSO, INC.)
- KLOA (1240 AM; 1 kW; RIDGECREST, CA; Owner: ADELMAN COMMUNICATIONS INC)
- KWRU (940 AM; 50 kW; FRESNO, CA)
Strongest FM radio stations in Red Mountain-Trona:
- KZIQ-FM (92.7 FM; RIDGECREST, CA; Owner: JAMES KNUDSEN & DONNA KNUDSEN)
- KLOA-FM (104.9 FM; RIDGECREST, CA; Owner: ADELMAN COMMUNICATIONS, INC.)
- KRAJ (100.9 FM; JOHANNESBURG, CA; Owner: ADELMAN BROADCASTING INC.)
- KGBM (89.7 FM; RANDSBURG, CA; Owner: EDUCATIONAL MEDIA FOUNDATION)
- K266AH (101.1 FM; BENA, CA; Owner: CALVARY CHAPEL OF TWIN FALLS, INC.)
- KTQX (90.1 FM; BAKERSFIELD, CA; Owner: RADIO BILINGUE, INC.)
- KRXV (98.1 FM; YERMO, CA; Owner: KHWY, INC.)
- KJAT (105.3 FM; YERMO, CA; Owner: CITICASTERS LICENSES, L.P.)
- K218DU (90.9 FM; RIDGECREST, CA; Owner: CALVARY CHAPEL OF TWIN FALLS, INC.)
- KCEL (106.9 FM; CALIFORNIA CITY, CA; Owner: KCEL RADIO, LLC)
TV broadcast stations around Red Mountain-Trona:
- KTRO-LP (Channel 50; LANCASTER, CA; Owner: ROBERT D. ADELMAN)

- 89.0%Utility gas
- 5.5%Electricity
- 3.1%Wood
- 2.5%Bottled, tank, or LP gas

- 96.9%Utility gas
- 3.1%Electricity
Red Mountain-Trona compared to California state average:
- Median house value significantly below state average.
- Unemployed percentage below state average.
- Black race population percentage significantly below state average.
- Hispanic race population percentage below state average.
- Median age above state average.
- Foreign-born population percentage significantly below state average.
- Renting percentage significantly below state average.
- Length of stay since moving in significantly above state average.
- Number of rooms per house significantly below state average.
- House age significantly below state average.
- Number of college students below state average.
- Percentage of population with a bachelor's degree or higher significantly below state average.
Red Mountain-Trona on our top lists:
- #96 on the list of "Top 100 cities with largest land areas"
- #5 on the list of "Top 101 counties with the highest Nitrogen Dioxide air pollution readings in 2012 (ppm)"
- #5 on the list of "Top 101 counties with the highest ground withdrawal of fresh water for public supply"
- #10 on the list of "Top 101 counties with the most Evangelical Protestant congregations"
- #14 on the list of "Top 101 counties with the highest total withdrawal of fresh water for public supply"
- #15 on the list of "Top 101 counties with the most Evangelical Protestant adherents (pop. 50,000+)"