Shafter, California
Submit your own pictures of this city and show them to the world
- OSM Map
- General Map
- Google Map
- MSN Map
Population change since 2000: +67.1%
| Males: 10,529 | |
| Females: 10,753 |
| Median resident age: | 27.7 years |
| California median age: | 37.9 years |
Zip codes: 93263.
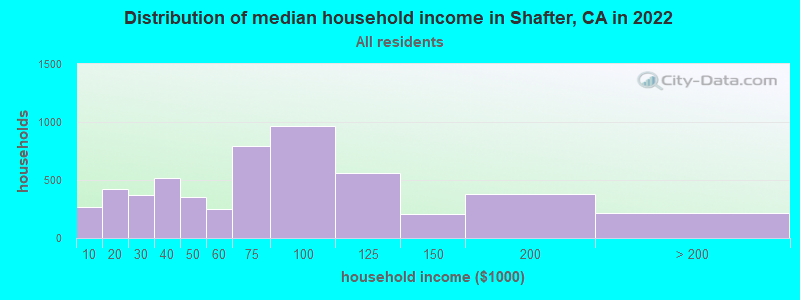
| Shafter: | $68,862 |
| CA: | $91,551 |
Estimated per capita income in 2022: $21,145 (it was $10,961 in 2000)
Shafter city income, earnings, and wages data
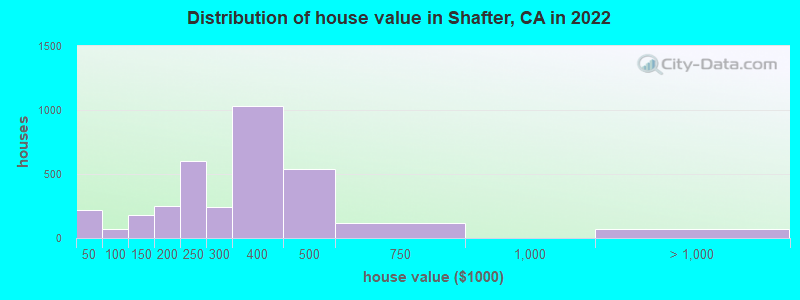
Estimated median house or condo value in 2022: $290,092 (it was $77,900 in 2000)
| Shafter: | $290,092 |
| CA: | $715,900 |
Mean prices in 2022: all housing units: $326,043; detached houses: $297,060; townhouses or other attached units: $422,697; mobile homes: over $1,000,000
Median gross rent in 2022: $1,184.
(13.8% for White Non-Hispanic residents, 52.4% for Black residents, 23.4% for Hispanic or Latino residents, 22.4% for other race residents, 17.6% for two or more races residents)
Detailed information about poverty and poor residents in Shafter, CA
Compare current foreclosures near Shafter, CA:
| Photo | Address | Area | Beds / Baths | Price | Details |
|---|---|---|---|---|---|

|
#1
Elliott St
Shafter, CA 93263
|
1,680 sq. feet
|
2 baths 3 beds |
show details | |

|
#2
Juniper Knoll Way
Shafter, CA 93263
|
1,400 sq. feet
|
2 baths 3 beds |
show details | |

|
#3
Curtis Ave
Shafter, CA 93263
|
1,086 sq. feet
|
1 baths 3 beds |
show details | |

|
#4
Minter Ave
Shafter, CA 93263
|
2,239 sq. feet
|
2 baths 4 beds |
show details | |

|
#5
Klassen St
Shafter, CA 93263
|
1,368 sq. feet
|
1 baths 3 beds |
show details | |

|
#6
Hitchcock Ave
Shafter, CA 93263
|
1,284 sq. feet
|
2 baths 3 beds |
show details | |

|
#7
Hitchcock Ave
Shafter, CA 93263
|
1,594 sq. feet
|
2 baths 4 beds |
show details | |

|
#8
Vasquez Ave
Shafter, CA 93263
|
1,284 sq. feet
|
2 baths 3 beds |
show details | |

|
#9
Holley Ridge Ln
Shafter, CA 93263
|
- sq. feet
|
- baths - beds |
show details | |

|
#10
Laurelwood Ct
Shafter, CA 93263
|
- sq. feet
|
- baths - beds |
show details |
| Photo | Address | Area | Beds / Baths | Price | Details |
|---|---|---|---|---|---|

|
#11
Timber Shade Way
Shafter, CA 93263
|
- sq. feet
|
- baths - beds |
show details | |

|
#12
Oak Garden Ln
Shafter, CA 93263
|
- sq. feet
|
- baths - beds |
show details | |

|
#13
Jeffries St
Shafter, CA 93263
|
- sq. feet
|
- baths - beds |
show details | |

|
#14
Kern St Apt 2
Shafter, CA 93263
|
- sq. feet
|
- baths - beds |
show details | |

|
#15
Davin Park Dr
Bakersfield, CA 93308
|
3,345 sq. feet
|
3 baths 4 beds |
show details | |

|
#16
Sioux Pl
Bakersfield, CA 93312
|
1,552 sq. feet
|
2 baths 4 beds |
show details | |

|
#17
Kickapoo Ct
Bakersfield, CA 93312
|
1,550 sq. feet
|
2 baths 4 beds |
show details | |

|
#18
Via Lugano
Bakersfield, CA 93312
|
2,377 sq. feet
|
3 baths 3 beds |
show details | |

|
#19
La France Dr
Bakersfield, CA 93304
|
1,200 sq. feet
|
1 baths 3 beds |
show details | |

|
#20
Truxtun Ave
Bakersfield, CA 93301
|
1,655 sq. feet
|
1 baths 3 beds |
show details |
| Photo | Address | Area | Beds / Baths | Price | Details |
|---|---|---|---|---|---|

|
#21
Jefferson St
Bakersfield, CA 93305
|
1,383 sq. feet
|
1 baths 2 beds |
show details | |

|
#22
Lomita Verde Dr
Bakersfield, CA 93305
|
1,314 sq. feet
|
1 baths 3 beds |
show details | |

|
#23
Grand Central Ave
Bakersfield, CA 93311
|
1,562 sq. feet
|
2 baths 3 beds |
show details | |

|
#24
Mccray St
Bakersfield, CA 93308
|
1,264 sq. feet
|
2 baths 3 beds |
show details | |

|
#25
Myrtle St
Bakersfield, CA 93304
|
1,116 sq. feet
|
1 baths 3 beds |
show details | |

|
#26
Carol Sue Ct
Bakersfield, CA 93308
|
1,890 sq. feet
|
2 baths 4 beds |
show details | |

|
#27
Eastbourne Way
Bakersfield, CA 93309
|
- sq. feet
|
2 baths 3 beds |
show details | |

|
#28
Quarter Ave
Bakersfield, CA 93309
|
1,263 sq. feet
|
2 baths 2 beds |
show details | |

|
#29
Elbury Ave
Bakersfield, CA 93311
|
2,614 sq. feet
|
2 baths 4 beds |
show details | |

|
#30
Castaic Ave
Bakersfield, CA 93308
|
- sq. feet
|
2 baths 3 beds |
show details |
| Photo | Address | Area | Beds / Baths | Price | Details |
|---|---|---|---|---|---|

|
#31
Thunderbird St
Bakersfield, CA 93309
|
1,197 sq. feet
|
1 baths 1 beds |
show details | |

|
#32
Berkeley St
Bakersfield, CA 93305
|
1,136 sq. feet
|
2 baths 4 beds |
show details | |

|
#33
Woodglen Dr
Bakersfield, CA 93311
|
1,612 sq. feet
|
3 baths 3 beds |
show details | |

|
#34
Charlana Dr
Bakersfield, CA 93308
|
885 sq. feet
|
1 baths 2 beds |
show details | |

|
#35
9th St
Bakersfield, CA 93304
|
1,536 sq. feet
|
1 baths 2 beds |
show details | |

|
#36
Hesketh Dr
Bakersfield, CA 93309
|
1,901 sq. feet
|
2 baths 3 beds |
show details | |

|
#37
Timberpointe Dr
Bakersfield, CA 93312
|
2,877 sq. feet
|
3 baths 5 beds |
show details | |

|
#38
Tretorn Ave
Bakersfield, CA 93313
|
1,645 sq. feet
|
2 baths 3 beds |
show details | |

|
#39
Adidas Ave
Bakersfield, CA 93313
|
1,581 sq. feet
|
2 baths 3 beds |
show details | |

|
#40
Bernard St
Bakersfield, CA 93305
|
984 sq. feet
|
1 baths 2 beds |
show details |
| Photo | Address | Area | Beds / Baths | Price | Details |
|---|---|---|---|---|---|

|
#41
Caswell Ave
Bakersfield, CA 93309
|
1,784 sq. feet
|
2 baths 4 beds |
show details | |

|
#42
S I St
Bakersfield, CA 93304
|
1,187 sq. feet
|
4 baths 6 beds |
show details | |

|
#43
New Stine Rd Apt 11
Bakersfield, CA 93309
|
1,537 sq. feet
|
2 baths 2 beds |
show details | |

|
#44
Candy St
Bakersfield, CA 93309
|
1,192 sq. feet
|
2 baths 3 beds |
show details | |

|
#45
Vista Del Valle Dr
Bakersfield, CA 93311
|
2,148 sq. feet
|
2 baths 4 beds |
show details | |

|
#46
Caswell Ave
Bakersfield, CA 93309
|
1,876 sq. feet
|
2 baths 4 beds |
show details | |

|
#47
Bralorne Ct
Bakersfield, CA 93309
|
1,698 sq. feet
|
2 baths 3 beds |
show details | |

|
#48
Marsha St
Bakersfield, CA 93309
|
1,051 sq. feet
|
1 baths 3 beds |
show details | |

|
#49
A St
Bakersfield, CA 93301
|
1,413 sq. feet
|
1 baths 2 beds |
show details | |

|
Check over 1 million property listings on Foreclosure.com!
|
browse all offers | |||


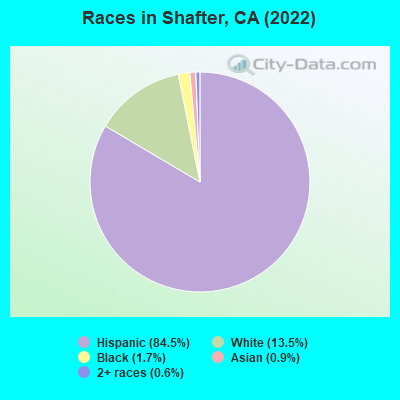
- 17,20084.5%Hispanic
- 2,75113.5%White alone
- 3501.7%Black alone
- 1840.9%Asian alone
- 1320.6%Two or more races
- 140.07%American Indian alone
- 40.02%Native Hawaiian and Other
Pacific Islander alone
According to our research of California and other state lists, there were 23 registered sex offenders living in Shafter, California as of April 27, 2024.
The ratio of all residents to sex offenders in Shafter is 786 to 1.
The ratio of registered sex offenders to all residents in this city is near the state average.
Type |
2009 |
2010 |
2011 |
2012 |
2013 |
2014 |
2015 |
2016 |
2017 |
2018 |
2019 |
2020 |
2022 |
|---|---|---|---|---|---|---|---|---|---|---|---|---|---|
| Murders (per 100,000) | 3 (18.5) | 0 (0.0) | 2 (11.6) | 0 (0.0) | 1 (5.8) | 1 (5.8) | 1 (5.7) | 1 (5.4) | 0 (0.0) | 0 (0.0) | 0 (0.0) | 0 (0.0) | 0 (0.0) |
| Rapes (per 100,000) | 5 (30.9) | 7 (41.2) | 3 (17.5) | 5 (28.8) | 7 (40.8) | 7 (40.6) | 6 (33.9) | 7 (37.6) | 7 (36.3) | 6 (30.0) | 3 (14.7) | 3 (14.4) | 6 (28.2) |
| Robberies (per 100,000) | 18 (111.3) | 11 (64.8) | 11 (64.0) | 13 (74.8) | 13 (75.9) | 13 (75.4) | 11 (62.2) | 6 (32.2) | 11 (57.0) | 8 (40.0) | 9 (44.0) | 16 (76.9) | 10 (46.9) |
| Assaults (per 100,000) | 47 (290.6) | 25 (147.2) | 25 (145.5) | 31 (178.3) | 37 (215.9) | 25 (145.1) | 45 (254.4) | 28 (150.5) | 25 (129.6) | 30 (150.1) | 41 (200.4) | 29 (139.4) | 68 (319.2) |
| Burglaries (per 100,000) | 241 (1,490) | 178 (1,048) | 162 (942.5) | 193 (1,110) | 209 (1,219) | 145 (841.3) | 180 (1,018) | 174 (935.1) | 117 (606.7) | 138 (690.5) | 127 (620.8) | 129 (620.2) | 86 (403.7) |
| Thefts (per 100,000) | 317 (1,960) | 285 (1,678) | 263 (1,530) | 296 (1,702) | 251 (1,464) | 223 (1,294) | 296 (1,673) | 249 (1,338) | 242 (1,255) | 285 (1,426) | 298 (1,457) | 231 (1,111) | 299 (1,403) |
| Auto thefts (per 100,000) | 104 (643.0) | 86 (506.2) | 83 (482.9) | 87 (500.3) | 85 (495.9) | 94 (545.4) | 142 (802.7) | 144 (773.9) | 114 (591.2) | 121 (605.4) | 88 (430.2) | 105 (504.8) | 115 (539.8) |
| Arson (per 100,000) | 18 (111.3) | 16 (94.2) | 19 (110.5) | 12 (69.0) | 8 (46.7) | 10 (58.0) | 14 (79.1) | 8 (43.0) | 11 (57.0) | 12 (60.0) | 8 (39.1) | 13 (62.5) | 5 (23.5) |
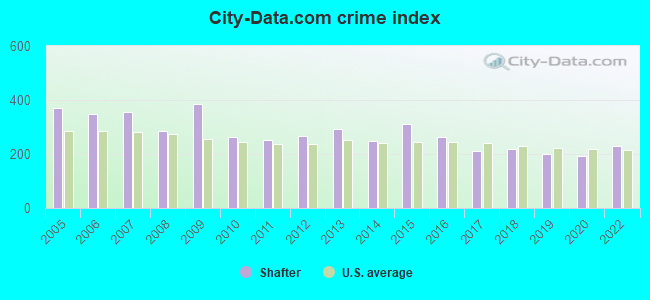
| City-Data.com crime index | 387.5 | 262.8 | 251.3 | 266.9 | 293.9 | 250.0 | 310.3 | 261.5 | 212.0 | 219.9 | 201.2 | 190.7 | 228.0 |
The City-Data.com crime index weighs serious crimes and violent crimes more heavily. Higher means more crime, U.S. average is 246.1. It adjusts for the number of visitors and daily workers commuting into cities.
Crime rate in Shafter detailed stats: murders, rapes, robberies, assaults, burglaries, thefts, arson
Full-time law enforcement employees in 2021, including police officers: 43 (30 officers - 26 male; 4 female).
| Officers per 1,000 residents here: | 1.42 |
| California average: | 2.30 |
 Recent articles from our blog. Our writers, many of them Ph.D. graduates or candidates, create easy-to-read articles on a wide variety of topics.


 | California High Speed Rail - Boondoggle or Boon? (125 replies) |
| Measure of America 2021: 9 Million Californians Live in 62 Elite Enclaves (20 replies) |
| Sacramento vs. Bakersfield (110 replies) |
| How about Bakersfield livability? (36 replies) |
| Can middle class people really survive in the Bay Area? (110 replies) |
| Tell Me About Central Valley? (21 replies) |
Latest news from Shafter, CA collected exclusively by city-data.com from local newspapers, TV, and radio stations
Ancestries: Arab (2.6%), American (1.8%), German (1.4%).
Current Local Time: PST time zone
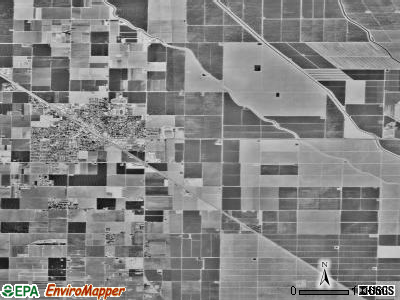
Land area: 18.0 square miles.
Population density: 1,184 people per square mile (low).
5,125 residents are foreign born (24.5% Latin America).
| This city: | 25.2% |
| California: | 26.5% |
Median real estate property taxes paid for housing units with mortgages in 2022: $2,642 (0.7%)
Median real estate property taxes paid for housing units with no mortgage in 2022: $1,423 (0.6%)
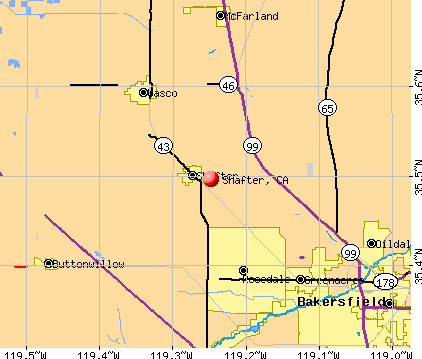
Nearest city with pop. 50,000+: Bakersfield, CA  (15.5 miles , pop. 247,057).
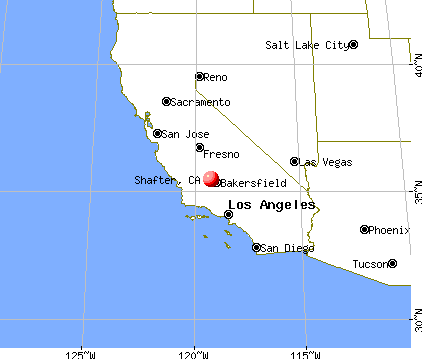
Nearest city with pop. 1,000,000+: Los Angeles, CA (109.4 miles , pop. 3,694,820).
Nearest cities:
), ), ), ), ), ), Latitude: 35.50 N, Longitude: 119.25 W
Daytime population change due to commuting: +1,447 (+7.1%)
Workers who live and work in this city: 2,036 (25.0%)
Area code: 661
Property values in Shafter, CA
Shafter, California accommodation & food services, waste management - Economy and Business Data
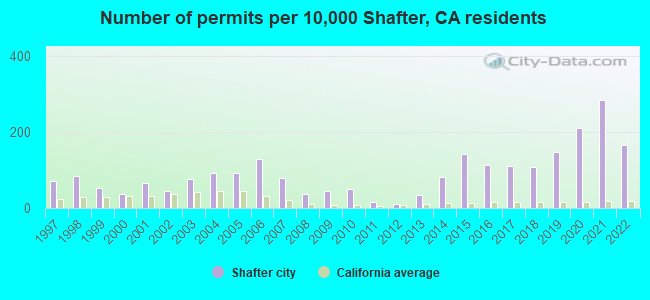
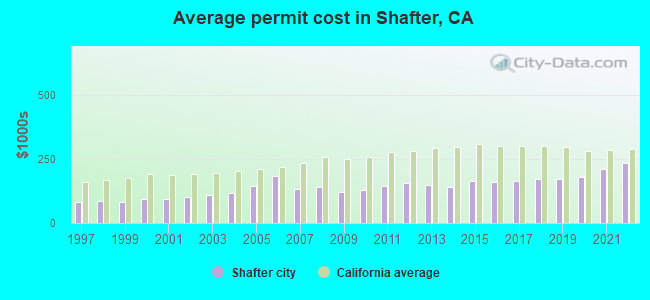
Single-family new house construction building permits:
- 2022: 211 buildings, average cost: $232,700
- 2021: 363 buildings, average cost: $209,600
- 2020: 270 buildings, average cost: $180,400
- 2019: 190 buildings, average cost: $174,200
- 2018: 137 buildings, average cost: $173,400
- 2017: 143 buildings, average cost: $162,800
- 2016: 144 buildings, average cost: $159,600
- 2015: 181 buildings, average cost: $164,600
- 2014: 105 buildings, average cost: $141,000
- 2013: 45 buildings, average cost: $147,300
- 2012: 13 buildings, average cost: $156,800
- 2011: 22 buildings, average cost: $144,200
- 2010: 65 buildings, average cost: $131,000
- 2009: 59 buildings, average cost: $121,100
- 2008: 49 buildings, average cost: $141,300
- 2007: 101 buildings, average cost: $132,800
- 2006: 165 buildings, average cost: $184,600
- 2005: 119 buildings, average cost: $142,500
- 2004: 119 buildings, average cost: $118,700
- 2003: 97 buildings, average cost: $107,700
- 2002: 58 buildings, average cost: $102,500
- 2001: 83 buildings, average cost: $93,600
- 2000: 48 buildings, average cost: $93,200
- 1999: 68 buildings, average cost: $81,400
- 1998: 107 buildings, average cost: $88,300
- 1997: 89 buildings, average cost: $84,400
| Here: | 8.7% |
| California: | 5.1% |
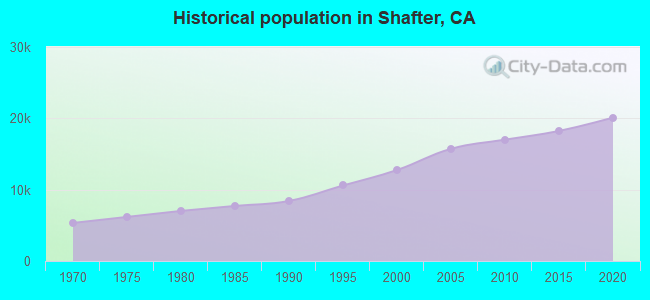
Population change in the 1990s: +3,120 (+32.4%).
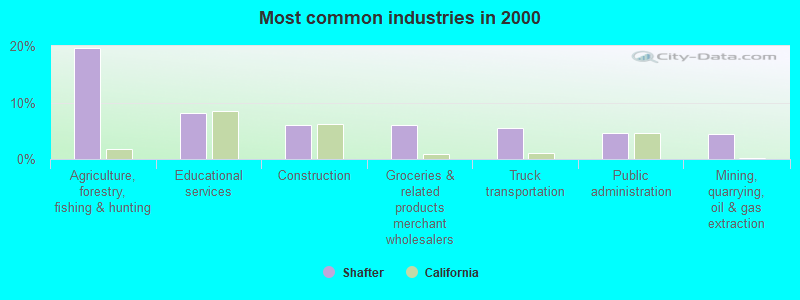
- Agriculture, forestry, fishing & hunting (19.6%)
- Educational services (8.1%)
- Construction (6.0%)
- Groceries & related products merchant wholesalers (5.9%)
- Truck transportation (5.5%)
- Public administration (4.5%)
- Mining, quarrying, oil & gas extraction (4.5%)
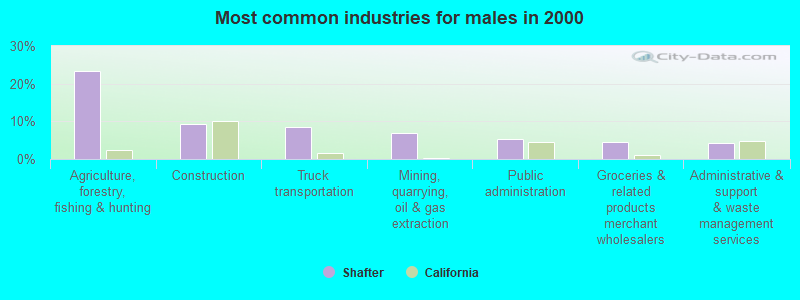
- Agriculture, forestry, fishing & hunting (23.3%)
- Construction (9.2%)
- Truck transportation (8.5%)
- Mining, quarrying, oil & gas extraction (6.8%)
- Public administration (5.3%)
- Groceries & related products merchant wholesalers (4.4%)
- Administrative & support & waste management services (4.3%)
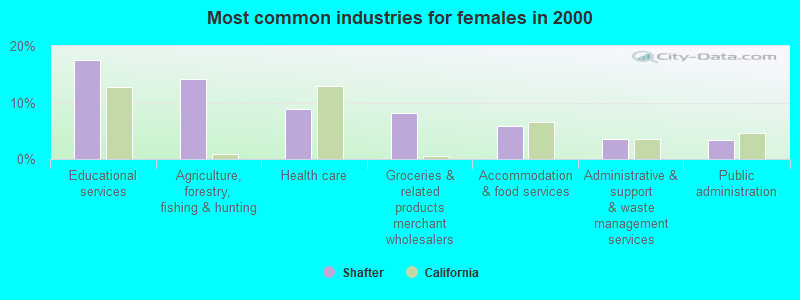
- Educational services (17.5%)
- Agriculture, forestry, fishing & hunting (14.2%)
- Health care (8.9%)
- Groceries & related products merchant wholesalers (8.2%)
- Accommodation & food services (5.8%)
- Administrative & support & waste management services (3.5%)
- Public administration (3.4%)
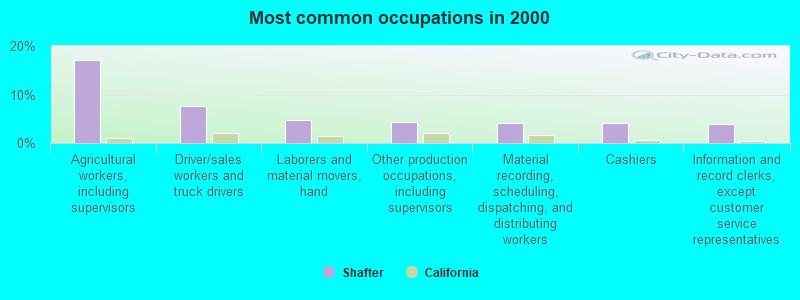
- Agricultural workers, including supervisors (17.1%)
- Driver/sales workers and truck drivers (7.6%)
- Laborers and material movers, hand (4.8%)
- Other production occupations, including supervisors (4.3%)
- Material recording, scheduling, dispatching, and distributing workers (4.2%)
- Cashiers (4.1%)
- Information and record clerks, except customer service representatives (3.9%)
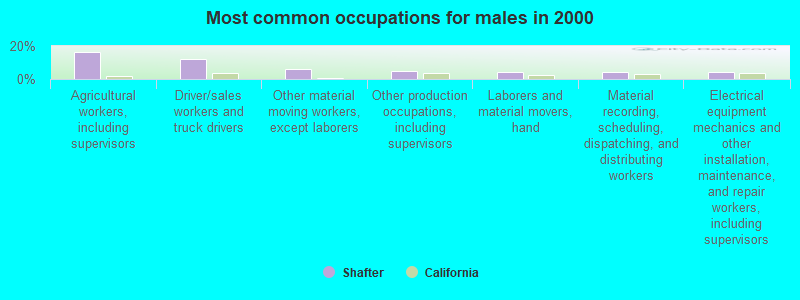
- Agricultural workers, including supervisors (16.2%)
- Driver/sales workers and truck drivers (12.0%)
- Other material moving workers, except laborers (6.2%)
- Other production occupations, including supervisors (4.7%)
- Laborers and material movers, hand (4.3%)
- Material recording, scheduling, dispatching, and distributing workers (4.1%)
- Electrical equipment mechanics and other installation, maintenance, and repair workers, including supervisors (4.0%)
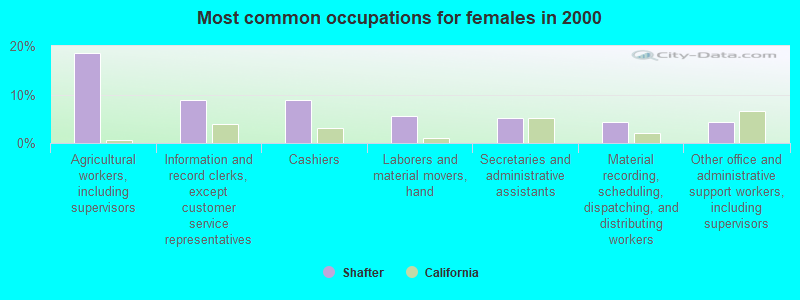
- Agricultural workers, including supervisors (18.5%)
- Information and record clerks, except customer service representatives (8.9%)
- Cashiers (8.8%)
- Laborers and material movers, hand (5.6%)
- Secretaries and administrative assistants (5.1%)
- Material recording, scheduling, dispatching, and distributing workers (4.4%)
- Other office and administrative support workers, including supervisors (4.4%)
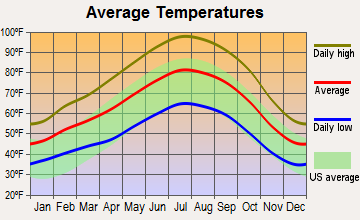
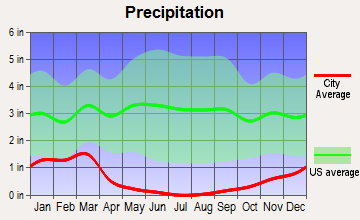
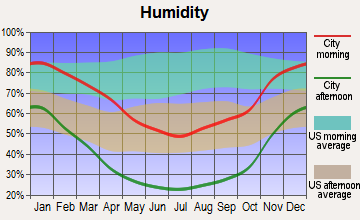
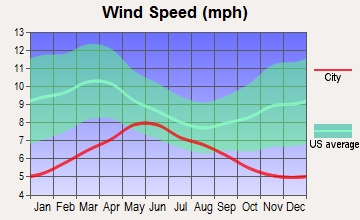
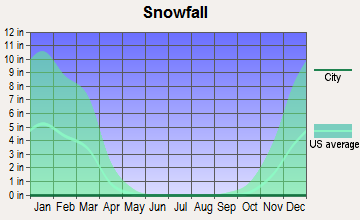
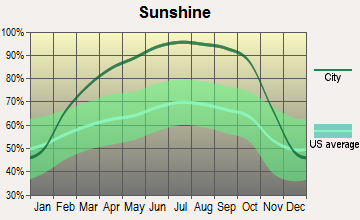
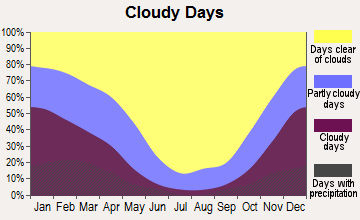
Average climate in Shafter, California
Based on data reported by over 4,000 weather stations
|
|

(lower is better)
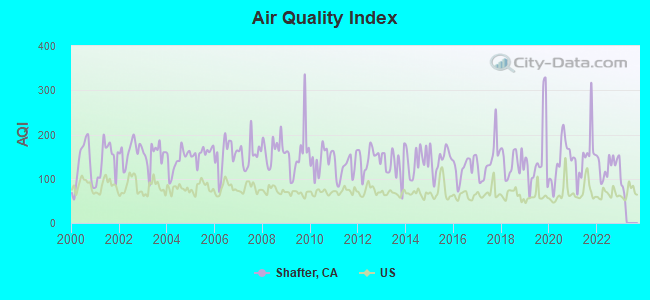
Air Quality Index (AQI) level in 2022 was 130. This is significantly worse than average.
| City: | 130 |
| U.S.: | 73 |
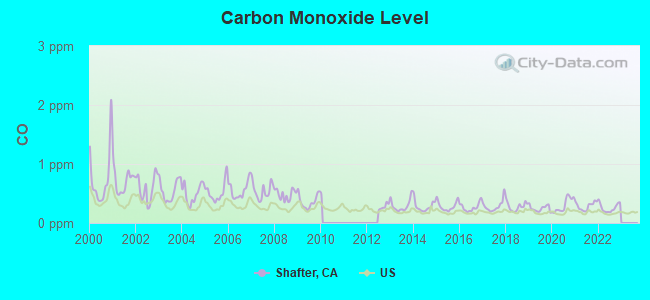
Carbon Monoxide (CO) [ppm] level in 2022 was 0.259. This is about average. Closest monitor was 13.6 miles away from the city center.
| City: | 0.259 |
| U.S.: | 0.251 |
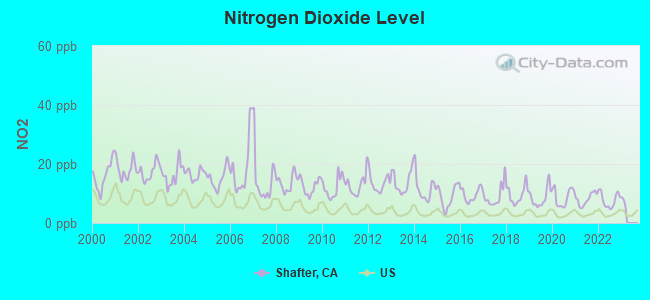
Nitrogen Dioxide (NO2) [ppb] level in 2022 was 7.81. This is significantly worse than average. Closest monitor was 1.5 miles away from the city center.
| City: | 7.81 |
| U.S.: | 5.11 |

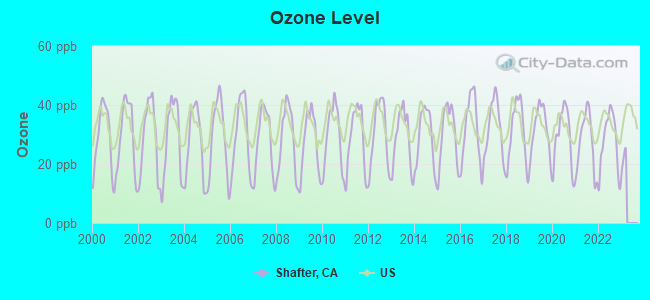
Ozone [ppb] level in 2022 was 27.5. This is better than average. Closest monitor was 1.5 miles away from the city center.
| City: | 27.5 |
| U.S.: | 33.3 |
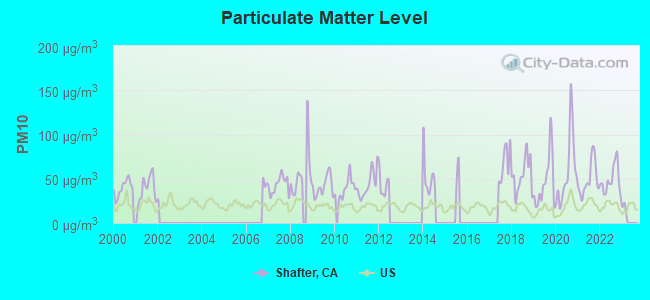
Particulate Matter (PM10) [µg/m3] level in 2022 was 48.7. This is significantly worse than average. Closest monitor was 13.6 miles away from the city center.
| City: | 48.7 |
| U.S.: | 19.2 |
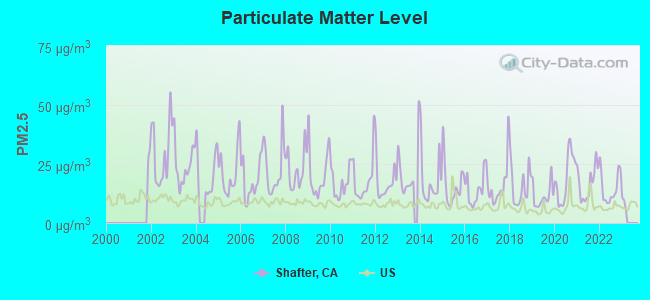
Particulate Matter (PM2.5) [µg/m3] level in 2022 was 15.0. This is significantly worse than average. Closest monitor was 14.2 miles away from the city center.
| City: | 15.0 |
| U.S.: | 8.1 |
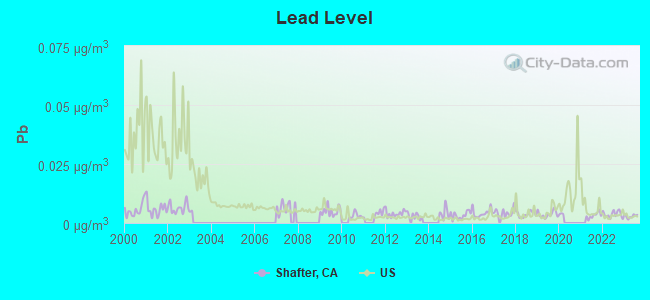
Lead (Pb) [µg/m3] level in 2023 was 0.00287. This is significantly better than average. Closest monitor was 13.5 miles away from the city center.
| City: | 0.00287 |
| U.S.: | 0.00931 |
Earthquake activity:
Shafter-area historical earthquake activity is significantly above California state average. It is 8105% greater than the overall U.S. average.On 7/21/1952 at 11:52:14, a magnitude 7.7 (7.7 UK, Class: Major, Intensity: VIII - XII) earthquake occurred 37.0 miles away from Shafter center, causing $50,000,000 total damage
On 11/4/1927 at 13:51:53, a magnitude 7.5 (7.5 UK) earthquake occurred 108.5 miles away from Shafter center
On 6/28/1992 at 11:57:34, a magnitude 7.6 (6.2 MB, 7.6 MS, 7.3 MW, Depth: 0.7 mi) earthquake occurred 178.9 miles away from Shafter center, causing 3 deaths (1 shaking deaths, 2 other deaths) and 400 injuries, causing $100,000,000 total damage and $40,000,000 insured losses
On 4/18/1906 at 13:12:21, a magnitude 7.9 (7.9 UK) earthquake occurred 270.6 miles away from Shafter center, causing $524,000,000 total damage
On 10/16/1999 at 09:46:44, a magnitude 7.4 (6.3 MB, 7.4 MS, 7.2 MW, 7.3 ML) earthquake occurred 173.2 miles away from Shafter center
On 1/17/1994 at 12:30:55, a magnitude 6.8 (6.4 MB, 6.8 MS, 6.7 MW, Depth: 11.4 mi, Class: Strong, Intensity: VII - IX) earthquake occurred 100.2 miles away from the city center, causing 60 deaths (60 shaking deaths) and 7000 injuries
Magnitude types: body-wave magnitude (MB), local magnitude (ML), surface-wave magnitude (MS), moment magnitude (MW)
Natural disasters:
The number of natural disasters in Kern County (29) is a lot greater than the US average (15).Major Disasters (Presidential) Declared: 14
Emergencies Declared: 3
Causes of natural disasters: Fires: 12, Floods: 12, Storms: 7, Winter Storms: 5, Mudslides: 4, Landslides: 3, Freezes: 2, Drought: 1, Heavy Rain: 1, Hurricane: 1, Snow: 1, Tornado: 1, Wind: 1, Other: 1 (Note: some incidents may be assigned to more than one category).

Hospitals and medical centers in Shafter:
Other hospitals and medical centers near Shafter:
- GRIFFITH PLACE (Hospital, about 9 miles away; WASCO, CA)
- NORTH KERN HOSPITAL (Hospital, about 9 miles away; WASCO, CA)
- ODYSSEY HEALTHCARE OF BAKERSFIELD (Hospital, about 11 miles away; BAKERSFIELD, CA)
- PEGASUS DIALYSIS, LLC (Dialysis Facility, about 12 miles away; BAKERSFIELD, CA)
- OPTIMAL HOME HEALTH (Home Health Center, about 12 miles away; BAKERSFIELD, CA)
- GOOD SAMARITAN HOSPITAL Acute Care Hospitals (about 14 miles away; BAKERSFIELD, CA)
- BAKERSFIELD HEART HOSPITAL Acute Care Hospitals (about 14 miles away; BAKERSFIELD, CA)
Airports located in Shafter:
- Shafter-Minter Field Airport (MIT) (Runways: 3, Itinerant Ops: 25,000, Local Ops: 20,000)
Amtrak stations near Shafter:
- 9 miles: WASCO (700 G ST.) . Services: fully wheelchair accessible.
- 16 miles: BAKERSFIELD (1501 F ST.) . Services: ticket office, partially wheelchair accessible, enclosed waiting area, public restrooms, public payphones, vending machines, free short-term parking, free long-term parking, call for car rental service, call for taxi service, public transit connection.
Colleges/universities with over 2000 students nearest to Shafter:
- California State University-Bakersfield (about 13 miles; Bakersfield, CA; Full-time enrollment: 7,564)
- Bakersfield College (about 17 miles; Bakersfield, CA; FT enrollment: 10,325)
- Taft College (about 27 miles; Taft, CA; FT enrollment: 2,121)
- Porterville College (about 41 miles; Porterville, CA; FT enrollment: 2,560)
- College of the Sequoias (about 58 miles; Visalia, CA; FT enrollment: 6,982)
- San Joaquin Valley College-Visalia (about 59 miles; Visalia, CA; FT enrollment: 2,386)
- West Hills College-Lemoore (about 64 miles; Lemoore, CA; FT enrollment: 2,314)
Public high schools in Shafter:
- SHAFTER HIGH (Students: 1,030, Location: 526 MANNEL AVE., Grades: 9-12)
- CENTRAL VALLEY HIGH (CONTINUATION) (Students: 3, Location: 526 MANNEL AVE., Grades: 9-12)
Private high school in Shafter:
Public elementary/middle schools in Shafter:
- RICHLAND JUNIOR HIGH (Students: 630, Location: 331 SHAFTER AVE., Grades: 7-8)
- GOLDEN OAK ELEMENTARY (Students: 530, Location: 190 S. WALL, Grades: KG-6)
- MAPLE ELEMENTARY (Students: 212, Location: 29161 FRESNO AVE., Grades: KG-8)
- REDWOOD ELEMENTARY (Location: 331 N. SHAFTER AVE., Grades: KG-6)
- SEQUOIA ELEMENTARY (Location: 500 E. FRESNO AVE., Grades: KG-6)
Private elementary/middle school in Shafter:
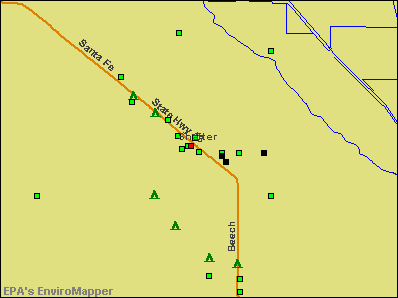
Points of interest:
Notable locations in Shafter: Shafter High School Farm (A), Kern County Fire Department Station 32 Shafter (B), Shafter Branch Kern County Library (C), Richland School District Office (D), Depot Museum (E). Display/hide their locations on the map
Churches in Shafter include: Bible Truth Tabernacle (A), Church of Christ (B), Congregational Church of Shafter (C), Ebenezer Reformed Church (D), First Assembly of God Church (E), First Southern Baptist Church (F), Kingdom Hall of Jehovahs Witnesses (G), Mennonite Brethren Church (H), Saint Marks Episcopal Church (I). Display/hide their locations on the map
Parks in Shafter include: Mannel Park (1), Kirchenmann Park (2), Richland Park (3), Rodriguez Park (4). Display/hide their locations on the map
Birthplace of: Dean Florez - Politician.
| This city: | 3.9 people |
| California: | 2.9 people |
| This city: | 86.2% |
| Whole state: | 68.7% |
| This city: | 9.0% |
| Whole state: | 7.2% |
Likely homosexual households (counted as self-reported same-sex unmarried-partner households)
- Lesbian couples: 0.4% of all households
- Gay men: 0.4% of all households
People in group quarters in Shafter in 2010:
- 517 people in correctional residential facilities
- 86 people in residential treatment centers for adults
- 48 people in group homes intended for adults
- 14 people in workers' group living quarters and job corps centers
People in group quarters in Shafter in 2000:
- 461 people in local jails and other confinement facilities (including police lockups)
- 80 people in nursing homes
- 53 people in agriculture workers' dormitories on farms
- 28 people in homes for the physically handicapped
- 25 people in homes for the mentally retarded
Banks with branches in Shafter (2011 data):
- Mission Bank: Shafter Branch at 1110 E. Lerdo Highway, branch established on 2006/06/12. Info updated 2006/11/03: Bank assets: $246.4 mil, Deposits: $217.0 mil, headquarters in Bakersfield, CA, positive income, Commercial Lending Specialization, 3 total offices, Holding Company: Mission Bancorp
- Bank of America, National Association: Shafter Branch at 261 Central Avenue, branch established on 1924/05/05. Info updated 2009/11/18: Bank assets: $1,451,969.3 mil, Deposits: $1,077,176.8 mil, headquarters in Charlotte, NC, positive income, 5782 total offices, Holding Company: Bank Of America Corporation
- Westamerica Bank: Shafter Branch at 600 James Street, branch established on 1958/10/27. Info updated 2011/06/21: Bank assets: $4,998.1 mil, Deposits: $4,253.2 mil, headquarters in San Rafael, CA, positive income, Commercial Lending Specialization, 98 total offices, Holding Company: Westamerica Bancorporation
For population 15 years and over in Shafter:
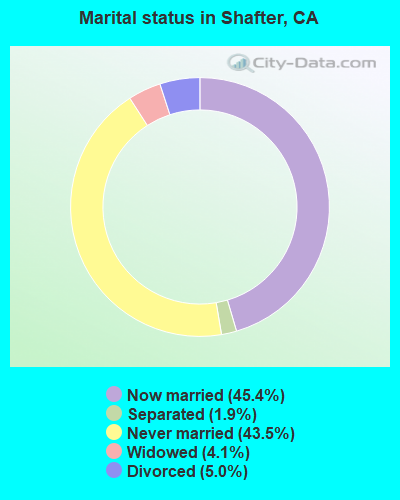
- Never married: 43.5%
- Now married: 45.4%
- Separated: 1.9%
- Widowed: 4.1%
- Divorced: 5.0%
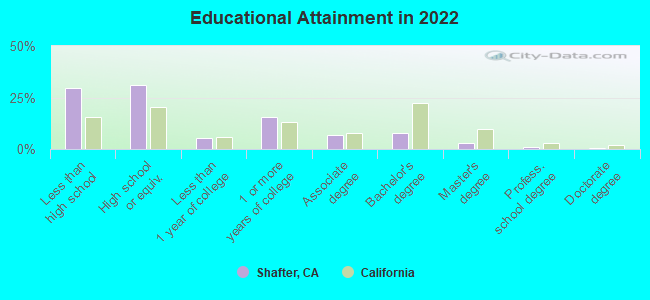
For population 25 years and over in Shafter:
- High school or higher: 67.8%
- Bachelor's degree or higher: 11.1%
- Graduate or professional degree: 3.7%
- Unemployed: 21.1%
- Mean travel time to work (commute): 21.7 minutes

| Here: | 19.5 |
| California average: | 15.5 |

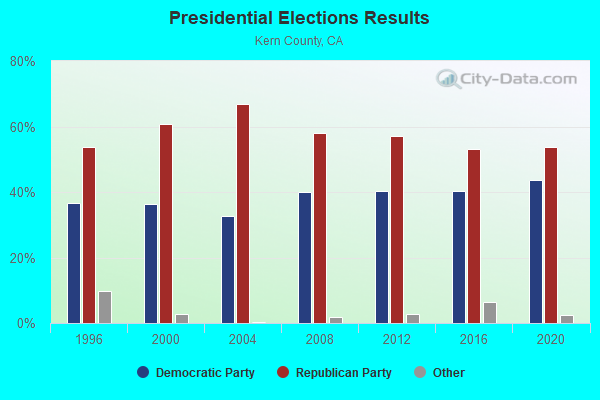
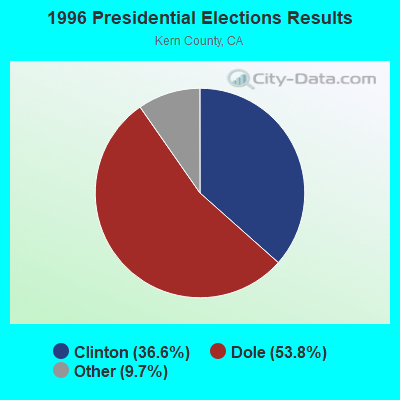
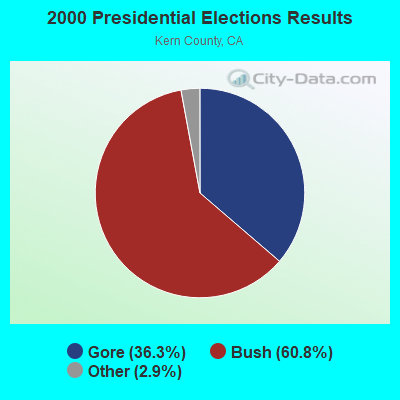
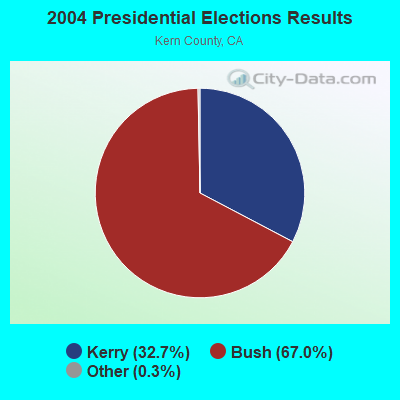
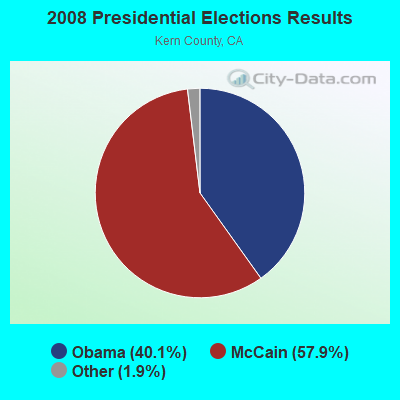
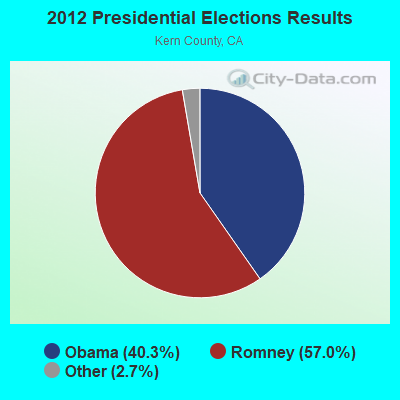
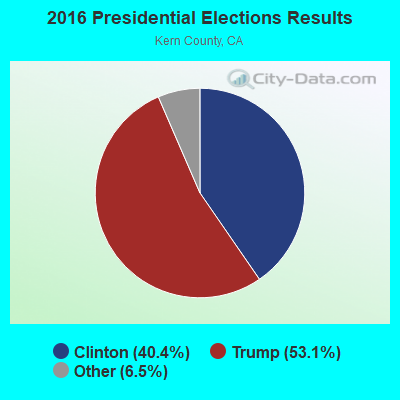
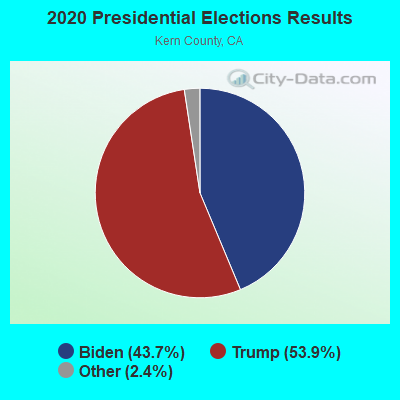
Graphs represent county-level data. Detailed 2008 Election Results
Religion statistics for Shafter, CA (based on Kern County data)
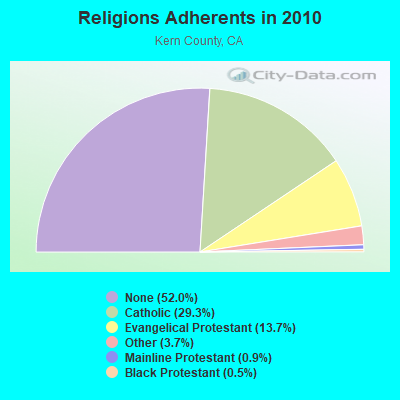
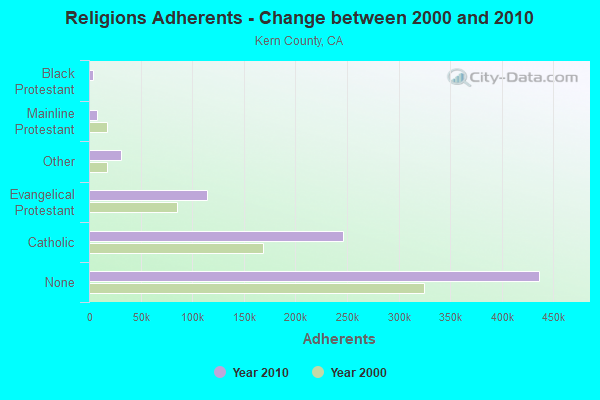
| Religion | Adherents | Congregations |
|---|---|---|
| Catholic | 245,836 | 30 |
| Evangelical Protestant | 114,724 | 436 |
| Other | 30,687 | 83 |
| Mainline Protestant | 7,459 | 38 |
| Black Protestant | 4,026 | 25 |
| Orthodox | 450 | 3 |
| None | 436,449 | - |
Food Environment Statistics:
| Kern County: | 2.41 / 10,000 pop. |
| State: | 2.14 / 10,000 pop. |
| Kern County: | 0.04 / 10,000 pop. |
| State: | 0.04 / 10,000 pop. |
| Kern County: | 0.80 / 10,000 pop. |
| California: | 0.62 / 10,000 pop. |
| Kern County: | 2.10 / 10,000 pop. |
| California: | 1.49 / 10,000 pop. |
| This county: | 4.60 / 10,000 pop. |
| State: | 7.42 / 10,000 pop. |
| Here: | 8.0% |
| California: | 7.3% |
| Here: | 29.4% |
| California: | 21.3% |
| Kern County: | 15.9% |
| California: | 17.9% |
Health and Nutrition:
| This city: | 46.0% |
| California: | 49.4% |
| This city: | 45.2% |
| California: | 48.0% |
| Shafter: | 28.3 |
| California: | 28.1 |
| Here: | 23.2% |
| California: | 20.2% |
| Shafter: | 9.9% |
| State: | 11.2% |
| This city: | 6.7 |
| State: | 6.8 |
| Shafter: | 30.5% |
| California: | 31.5% |
| Shafter: | 53.8% |
| California: | 56.4% |
| Shafter: | 81.0% |
| California: | 80.9% |
More about Health and Nutrition of Shafter, CA Residents
| Local government employment and payroll (March 2022) | |||||
| Function | Full-time employees | Monthly full-time payroll | Average yearly full-time wage | Part-time employees | Monthly part-time payroll |
|---|---|---|---|---|---|
| Police Protection - Officers | 32 | $276,112 | $103,542 | 0 | $0 |
| Other Government Administration | 22 | $101,302 | $55,256 | 0 | $0 |
| Streets and Highways | 12 | $100,696 | $100,696 | 0 | $0 |
| Other and Unallocable | 11 | $101,489 | $110,715 | 15 | $9,753 |
| Financial Administration | 10 | $74,774 | $89,729 | 0 | $0 |
| Police - Other | 9 | $47,655 | $63,540 | 0 | $0 |
| Water Supply | 5 | $30,100 | $72,240 | 0 | $0 |
| Parks and Recreation | 4 | $17,512 | $52,536 | 1 | $83 |
| Solid Waste Management | 4 | $22,143 | $66,429 | 0 | $0 |
| Health | 3 | $27,628 | $110,512 | 0 | $0 |
| Transit | 1 | $7,547 | $90,564 | 3 | $9,232 |
| Totals for Government | 113 | $806,957 | $85,695 | 19 | $19,068 |
Shafter government finances - Expenditure in 2017 (per resident):
- Construction - Central Staff Services: $9,428,000 ($443.00)
Regular Highways: $908,000 ($42.67)
Housing and Community Development: $899,000 ($42.24)
Sewerage: $590,000 ($27.72)
Parks and Recreation: $373,000 ($17.53)
- Current Operations - Correctional Institutions: $16,117,000 ($757.31)
Central Staff Services: $11,656,000 ($547.69)
Police Protection: $5,308,000 ($249.41)
Water Utilities: $2,845,000 ($133.68)
Regular Highways: $1,681,000 ($78.99)
Protective Inspection and Regulation - Other: $1,278,000 ($60.05)
Sewerage: $1,241,000 ($58.31)
Solid Waste Management: $1,115,000 ($52.39)
Parks and Recreation: $957,000 ($44.97)
Transit Utilities: $772,000 ($36.27)
Financial Administration: $602,000 ($28.29)
Health - Other: $455,000 ($21.38)
Local Fire Protection: $292,000 ($13.72)
General - Other: $217,000 ($10.20)
Housing and Community Development: $4,000 ($0.19)
- General - Interest on Debt: $123,000 ($5.78)
- Other Capital Outlay - General - Other: $2,104,000 ($98.86)
Police Protection: $106,000 ($4.98)
Central Staff Services: $40,000 ($1.88)
Water Utilities: $15,000 ($0.70)
Solid Waste Management: $15,000 ($0.70)
- Total Salaries and Wages: $113,000 ($5.31)
- Transit Utilities - Interest on Debt: $7,000 ($0.33)
Shafter government finances - Revenue in 2017 (per resident):
- Charges - Other: $21,053,000 ($989.24)
Sewerage: $1,641,000 ($77.11)
Solid Waste Management: $1,163,000 ($54.65)
Parks and Recreation: $7,000 ($0.33)
- Federal Intergovernmental - Other: $479,000 ($22.51)
Transit Utilities: $111,000 ($5.22)
- Local Intergovernmental - Transit Utilities: $152,000 ($7.14)
- Miscellaneous - Special Assessments: $2,058,000 ($96.70)
Interest Earnings: $874,000 ($41.07)
Rents: $287,000 ($13.49)
General Revenue - Other: $67,000 ($3.15)
Fines and Forfeits: $58,000 ($2.73)
Sale of Property: $31,000 ($1.46)
- Revenue - Water Utilities: $3,233,000 ($151.91)
Transit Utilities: $112,000 ($5.26)
- State Intergovernmental - Highways: $326,000 ($15.32)
Other: $209,000 ($9.82)
Transit Utilities: $181,000 ($8.50)
General Local Government Support: $11,000 ($0.52)
- Tax - General Sales and Gross Receipts: $15,540,000 ($730.19)
Property: $3,588,000 ($168.59)
Other License: $788,000 ($37.03)
Public Utilities Sales: $432,000 ($20.30)
Occupation and Business License - Other: $55,000 ($2.58)
Documentary and Stock Transfer: $49,000 ($2.30)
Shafter government finances - Debt in 2017 (per resident):
- Long Term Debt - Beginning Outstanding - Unspecified Public Purpose: $2,090,000 ($98.21)
Outstanding Unspecified Public Purpose: $1,723,000 ($80.96)
Retired Unspecified Public Purpose: $367,000 ($17.24)
Shafter government finances - Cash and Securities in 2017 (per resident):
- Bond Funds - Cash and Securities: $13,627,000 ($640.31)
- Other Funds - Cash and Securities: $66,519,000 ($3125.60)
4.83% of this county's 2021 resident taxpayers lived in other counties in 2020 ($47,246 average adjusted gross income)
| Here: | 4.83% |
| California average: | 5.19% |
0.03% of residents moved from foreign countries ($334 average AGI)
Kern County: 0.03% California average: 0.03%
Top counties from which taxpayers relocated into this county between 2020 and 2021:
| from Los Angeles County, CA | |
| from San Bernardino County, CA | |
| from Tulare County, CA |
4.56% of this county's 2020 resident taxpayers moved to other counties in 2021 ($61,654 average adjusted gross income)
| Here: | 4.56% |
| California average: | 6.14% |
0.03% of residents moved to foreign countries ($342 average AGI)
Kern County: 0.03% California average: 0.02%
Top counties to which taxpayers relocated from this county between 2020 and 2021:
| to Los Angeles County, CA | |
| to Tulare County, CA | |
| to San Diego County, CA |
| Businesses in Shafter, CA | ||||
| Name | Count | Name | Count | |
|---|---|---|---|---|
| Ace Hardware | 1 | Little Caesars Pizza | 1 | |
| AutoZone | 1 | McDonald's | 1 | |
| Chevrolet | 1 | Rite Aid | 1 | |
| FedEx | 1 | SONIC Drive-In | 1 | |
| GNC | 1 | Subway | 2 | |
| H&R Block | 1 | U-Haul | 1 | |
Strongest AM radio stations in Shafter:
- KERI (1180 AM; 50 kW; WASCO-GREENACRES, CA; Owner: KWSO, INC.)
- KNZR (1560 AM; 25 kW; BAKERSFIELD, CA; Owner: BUCKLEY BROADCASTING CORP. OF CALIF.)
- KUZZ (550 AM; 5 kW; BAKERSFIELD, CA; Owner: OWENS ONE COMPANY)
- KGET (970 AM; 5 kW; BAKERSFIELD, CA; Owner: CLEVELAND RADIO LICENSES, LLC)
- KAFY (1100 AM; 4 kW; BAKERSFIELD, CA; Owner: KAFY, INC.)
- KGDP (660 AM; 50 kW; ORCUTT, CA; Owner: RADIO REPRESENTATIVES, INC.)
- KMJ (580 AM; 50 kW; FRESNO, CA; Owner: INFINITY RADIO OPERATIONS INC.)
- KWRU (940 AM; 50 kW; FRESNO, CA)
- KCHJ (1010 AM; 5 kW; DELANO, CA; Owner: ILLINOIS LOTUS CORP.)
- KIRN (670 AM; 35 kW; SIMI VALLEY, CA; Owner: LOTUS OXNARD CORP.)
- KMAP (1050 AM; 10 kW; FRAZIER PARK, CA; Owner: KMAP, INC.)
- KSPN (710 AM; 50 kW; LOS ANGELES, CA; Owner: KABC-AM RADIO, INC.)
- KLAC (570 AM; 50 kW; LOS ANGELES, CA; Owner: AMFM RADIO LICENSES, L.L.C.)
Strongest FM radio stations in Shafter:
- KSMJ (97.7 FM; SHAFTER, CA; Owner: BUCKLEY BROADCASTING CORPORATION OF CALIFORNIA)
- KIWI (102.9 FM; MCFARLAND, CA; Owner: ILLINOIS LOTUS CORP.)
- KRFR (104.3 FM; SHAFTER, CA; Owner: AMERICAN GENERAL MEDIA OF TEXAS, INC)
- KAXL (88.3 FM; GREENACRES, CA; Owner: SKYRIDE UNLIMITED, INCORPORATED)
- K266AH (101.1 FM; BENA, CA; Owner: CALVARY CHAPEL OF TWIN FALLS, INC.)
- KTQX (90.1 FM; BAKERSFIELD, CA; Owner: RADIO BILINGUE, INC.)
- KKBB (99.3 FM; BAKERSFIELD, CA; Owner: BUCKLEY COMMUNICATIONS, INC.)
- KDFO-FM (98.5 FM; DELANO, CA; Owner: CLEAR CHANNEL BROADCASTING LICENSES, INC.)
- KKDJ (105.3 FM; DELANO, CA; Owner: CLEAR CHANNEL BROADCASTING LICENSES, INC.)
- KGZO (90.9 FM; SHAFTER, CA; Owner: THE ASSOCIATION FOR COMMUNITY EDUCATION, INC.)
- KMYX-FM (92.5 FM; ARVIN, CA; Owner: FARMWORKER EDUC. RADIO NETWORK, INC.)
- K293AG (106.5 FM; TAFT, CA; Owner: CENTRO CRISTIANO DE FE, INC.)
- KFRB (91.3 FM; BAKERSFIELD, CA; Owner: FAMILY STATIONS, INC.)
- KUZZ-FM (107.9 FM; BAKERSFIELD, CA; Owner: OWENS ONE COMPANY, INC)
- KLLY (95.3 FM; OILDALE, CA; Owner: BUCKLEY B/CTING CORP. OF CALIFORNIA)
- KISV (94.1 FM; BAKERSFIELD, CA; Owner: AMERICAN GENERAL MEDIA CORP.)
- KGFM (101.5 FM; BAKERSFIELD, CA; Owner: LAGNIAPPE BROADCASTING, INC.)
- KPSL-FM (92.1 FM; BAKERSFIELD, CA; Owner: ILLINOIS LOTUS CORP.)
- KZPO (103.3 FM; LINDSAY, CA; Owner: LINDSAY BROADCASTING)
- KMQA (100.5 FM; EAST PORTERVILLE, CA; Owner: MOON BROADCASTING PORTERVILLE L.L.C.)
TV broadcast stations around Shafter:
- KPMC-LP (Channel 42; BAKERSFIELD, CA; Owner: GARY M. COCOLA FAMILY TRUST)
- KTRO-LP (Channel 50; LANCASTER, CA; Owner: ROBERT D. ADELMAN)
- K08MM (Channel 8; BAKERSFIELD, CA; Owner: THREE ANGELS BROADCASTING NETWORK)
- K25FT (Channel 25; BAKERSFIELD, CA; Owner: THREE ANGELS BROADCASTING NETWORK, INC.)
- K67FS (Channel 67; BAKERSFIELD, CA; Owner: COMMUNITY TV OF SOUTHERN CALIFORNIA)
- K50CL (Channel 50; McKITTRICK, CA; Owner: KERN EDUCATIONAL TELECOMMUNICATIONS)
- National Bridge Inventory (NBI) Statistics
- 28Number of bridges
- 256ft / 77.9mTotal length
- 741,653Total average daily traffic
- 184,956Total average daily truck traffic

- New bridges - historical statistics
- 11910-1919
- 11930-1939
- 11940-1949
- 61950-1959
- 121960-1969
- 11970-1979
- 11980-1989
- 52010-2019
FCC Registered Broadcast Land Mobile Towers: 16 (See the full list of FCC Registered Broadcast Land Mobile Towers in Shafter, CA)
FCC Registered Microwave Towers: 22 (See the full list of FCC Registered Microwave Towers in this town)
FCC Registered Paging Towers: 1 (See the full list of FCC Registered Paging Towers)
FCC Registered Maritime Coast & Aviation Ground Towers: 1 (See the full list of FCC Registered Maritime Coast & Aviation Ground Towers)
FCC Registered Amateur Radio Licenses: 27 (See the full list of FCC Registered Amateur Radio Licenses in Shafter)
FAA Registered Aircraft: 43 (See the full list of FAA Registered Aircraft in Shafter)
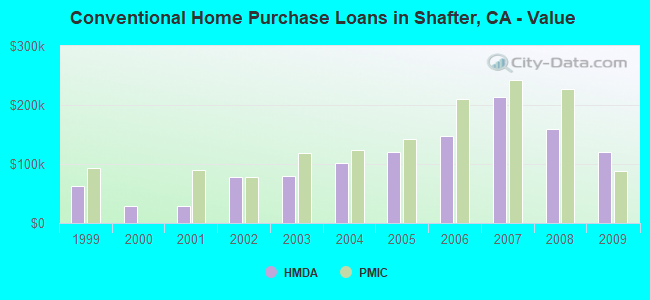
| Home Mortgage Disclosure Act Aggregated Statistics For Year 2009 (Based on 2 full and 2 partial tracts) | ||||||||||||
| A) FHA, FSA/RHS & VA Home Purchase Loans | B) Conventional Home Purchase Loans | C) Refinancings | D) Home Improvement Loans | F) Non-occupant Loans on < 5 Family Dwellings (A B C & D) | G) Loans On Manufactured Home Dwelling (A B C & D) | |||||||
|---|---|---|---|---|---|---|---|---|---|---|---|---|
| Number | Average Value | Number | Average Value | Number | Average Value | Number | Average Value | Number | Average Value | Number | Average Value | |
| LOANS ORIGINATED | 66 | $157,781 | 23 | $119,974 | 51 | $157,149 | 4 | $89,570 | 12 | $103,666 | 0 | $0 |
| APPLICATIONS APPROVED, NOT ACCEPTED | 8 | $168,999 | 1 | $252,000 | 6 | $144,230 | 1 | $43,000 | 0 | $0 | 0 | $0 |
| APPLICATIONS DENIED | 6 | $194,160 | 5 | $72,700 | 39 | $153,406 | 4 | $63,022 | 5 | $77,018 | 1 | $54,230 |
| APPLICATIONS WITHDRAWN | 11 | $125,934 | 3 | $60,073 | 17 | $182,129 | 0 | $0 | 4 | $78,740 | 0 | $0 |
| FILES CLOSED FOR INCOMPLETENESS | 0 | $0 | 2 | $87,000 | 3 | $212,820 | 0 | $0 | 1 | $94,000 | 0 | $0 |
Detailed HMDA statistics for the following Tracts: 0039.00 , 0040.00, 0041.01, 0041.02
| Private Mortgage Insurance Companies Aggregated Statistics For Year 2009 (Based on 1 full and 1 partial tracts) | ||||||
| A) Conventional Home Purchase Loans | B) Refinancings | C) Non-occupant Loans on < 5 Family Dwellings (A & B) | ||||
|---|---|---|---|---|---|---|
| Number | Average Value | Number | Average Value | Number | Average Value | |
| LOANS ORIGINATED | 4 | $88,362 | 1 | $230,000 | 1 | $85,000 |
| APPLICATIONS APPROVED, NOT ACCEPTED | 0 | $0 | 0 | $0 | 0 | $0 |
| APPLICATIONS DENIED | 0 | $0 | 0 | $0 | 0 | $0 |
| APPLICATIONS WITHDRAWN | 0 | $0 | 0 | $0 | 0 | $0 |
| FILES CLOSED FOR INCOMPLETENESS | 0 | $0 | 0 | $0 | 0 | $0 |
Detailed PMIC statistics for the following Tracts: 0039.00 , 0040.00, 0041.01, 0041.02

2002 - 2018 National Fire Incident Reporting System (NFIRS) incidents
- Fire incident types reported to NFIRS in Shafter, CA
- 32441.4%Outside Fires
- 29637.8%Structure Fires
- 15619.9%Mobile Property/Vehicle Fires
- 70.9%Other
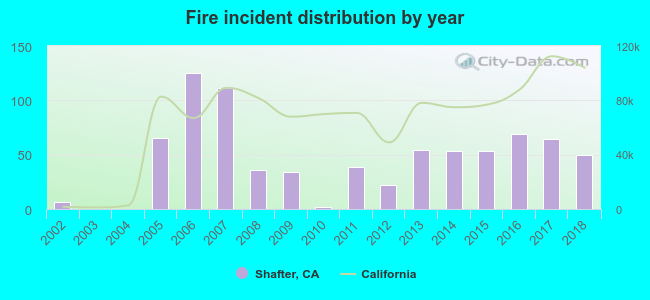 According to the data from the years 2002 - 2018 the average number of fire incidents per year is 46. The highest number of fire incidents - 125 took place in 2006, and the least - 0 in 2003. The data has a growing trend.
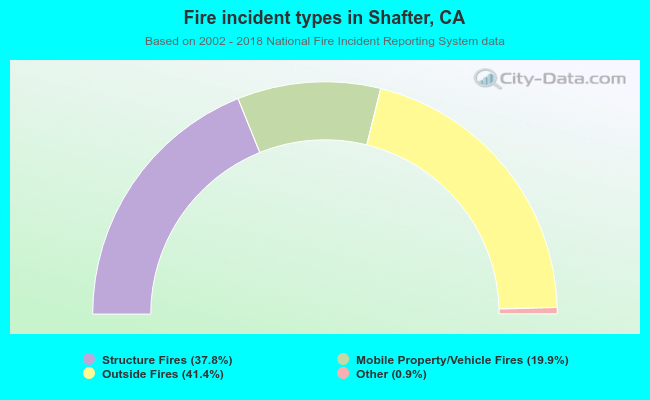 When looking into fire subcategories, the most incidents belonged to: Outside Fires (41.4%), and Structure Fires (37.8%).
| Most common first names in Shafter, CA among deceased individuals | ||
| Name | Count | Lived (average) |
|---|---|---|
| John | 62 | 73.5 years |
| William | 53 | 79.2 years |
| James | 51 | 71.6 years |
| Mary | 41 | 79.6 years |
| Charles | 37 | 71.5 years |
| Robert | 36 | 71.8 years |
| Henry | 32 | 75.6 years |
| Elizabeth | 28 | 82.5 years |
| Maria | 24 | 68.6 years |
| George | 24 | 77.5 years |
| Most common last names in Shafter, CA among deceased individuals | ||
| Last name | Count | Lived (average) |
|---|---|---|
| Jones | 29 | 71.6 years |
| Smith | 23 | 77.7 years |
| Martinez | 20 | 67.2 years |
| Johnson | 19 | 77.3 years |
| Wilson | 18 | 71.2 years |
| Rodriguez | 17 | 74.3 years |
| Davis | 16 | 74.3 years |
| Neufeld | 16 | 80.9 years |
| Mettler | 16 | 85.4 years |
| Williams | 16 | 72.3 years |
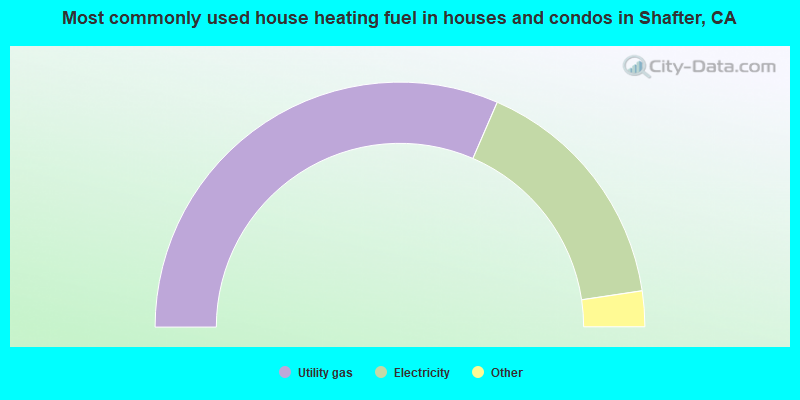
- 63.0%Utility gas
- 32.3%Electricity
- 2.2%Bottled, tank, or LP gas
- 1.4%Solar energy
- 0.8%No fuel used
- 0.2%Other fuel
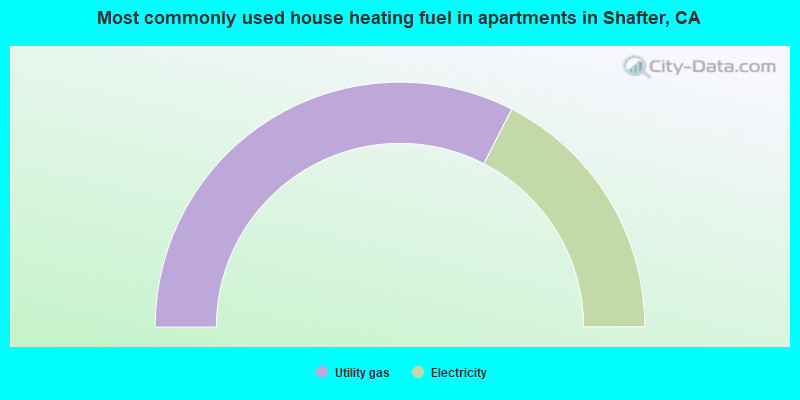
- 65.1%Utility gas
- 34.9%Electricity
Shafter compared to California state average:
- Median house value significantly below state average.
- Black race population percentage below state average.
- Hispanic race population percentage significantly above state average.
- Median age below state average.
- Foreign-born population percentage above state average.
- Length of stay since moving in above state average.
- House age below state average.
- Institutionalized population percentage above state average.
- Percentage of population with a bachelor's degree or higher significantly below state average.
Shafter on our top lists:
- #27 on the list of "Top 101 cities with largest percentage of females in occupations: farming, fishing, and forestry occupations (population 5,000+)"
- #29 on the list of "Top 101 cities with largest percentage of females in industries: agriculture, forestry, fishing and hunting (population 5,000+)"
- #38 on the list of "Top 101 cities with largest percentage of males in industries: agriculture, forestry, fishing and hunting (population 5,000+)"
- #39 on the list of "Top 101 cities with largest percentage of males in occupations: farming, fishing, and forestry occupations (population 5,000+)"
- #93 on the list of "Top 101 cities with the largest percentage of people in homes for the physically handicapped (population 1,000+)"
- #6 on the list of "Top 101 counties with the highest Particulate Matter (PM10) Annual air pollution readings in 2012 (µg/m3)"
- #13 on the list of "Top 101 counties with the highest carbon monoxide air pollution readings in 2012 (ppm)"
- #13 on the list of "Top 101 counties with the highest lead air pollution readings in 2012 (µg/m3)"
- #13 on the list of "Top 101 counties with the lowest lead air pollution readings in 2012 (µg/m3)"
- #17 on the list of "Top 101 counties with the highest ground withdrawal of fresh water for public supply"

|
|
Total of 6 patent applications in 2008-2024.