West Valley, Washington
Submit your own pictures of this place and show them to the world
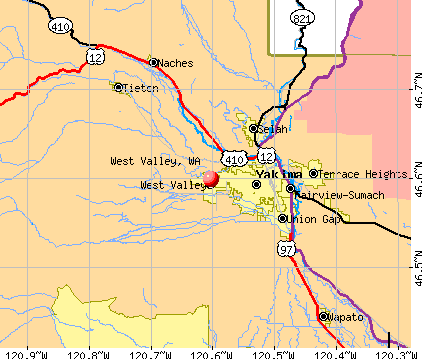
- OSM Map
- General Map
- Google Map
- MSN Map
| Males: 5,262 | |
| Females: 5,620 |
| Median resident age: | 36.2 years |
| Washington median age: | 35.3 years |
Zip codes: 98908.
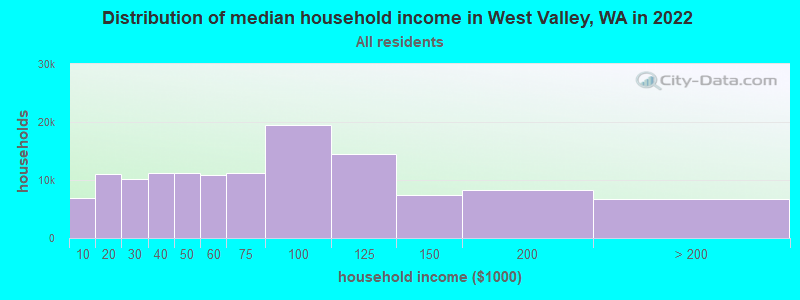
| West Valley: | $93,889 |
| WA: | $91,306 |
Estimated per capita income in 2022: $46,394 (it was $25,765 in 2000)
West Valley CDP income, earnings, and wages data
Estimated median house or condo value in 2022: $407,463 (it was $145,600 in 2000)
| West Valley: | $407,463 |
| WA: | $569,500 |
Mean prices in 2022: all housing units: $340,866; detached houses: $376,208; townhouses or other attached units: $295,606; in 2-unit structures: $230,643; in 3-to-4-unit structures: $310,384; in 5-or-more-unit structures: $255,508; mobile homes: $163,663; occupied boats, rvs, vans, etc.: $91,300
Detailed information about poverty and poor residents in West Valley, WA


- 8,93585.6%White alone
- 9108.7%Hispanic
- 2072.0%Asian alone
- 2021.9%Two or more races
- 800.8%Black alone
- 780.7%American Indian alone
- 110.1%Native Hawaiian and Other
Pacific Islander alone - 100.10%Other race alone
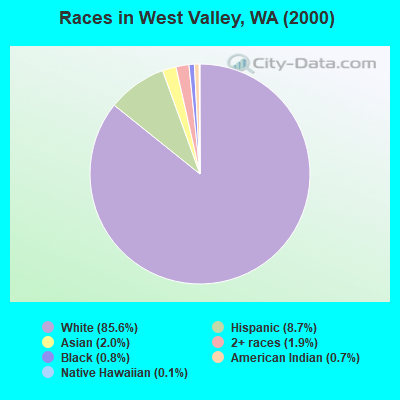
Races in West Valley detailed stats: ancestries, foreign born residents, place of birth
 Recent articles from our blog. Our writers, many of them Ph.D. graduates or candidates, create easy-to-read articles on a wide variety of topics.


 | Considering a Move to Spokane from Salt Lake City (55 replies) |
| Spokane Area Neighborhoods (51 replies) |
| West Valley vs. Terrace Heights vs. Selah (4 replies) |
| "No Tax on Jobs"---Seattle businesses strike back against head tax (7 replies) |
| Seattle or Salt Lake City (16 replies) |
| Moving to either Tri Cities or Yakima please help (16 replies) |
Latest news from West Valley, WA collected exclusively by city-data.com from local newspapers, TV, and radio stations
Ancestries: German (24.5%), English (11.1%), Irish (10.4%), United States (7.1%), Norwegian (6.0%), French (5.0%).
Current Local Time: PST time zone
Land area: 7.20 square miles.
Population density: 1,511 people per square mile (low).
419 residents are foreign born (1.6% Asia, 1.1% Latin America, 0.7% Europe, 0.6% North America).
| This place: | 4.0% |
| Washington: | 10.4% |
| West Valley CDP: | 1.3% ($1,869) |
| Washington: | 1.2% ($1,915) |
Nearest city with pop. 50,000+: Yakima, WA  (3.5 miles , pop. 71,845).
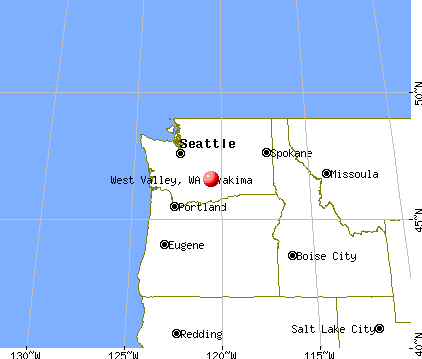
Nearest city with pop. 200,000+: East Seattle, WA (101.8 miles , pop. 480,100).
Nearest city with pop. 1,000,000+: Los Angeles, CA (873.3 miles , pop. 3,694,820).
Nearest cities:
), ), ), ), Latitude: 46.60 N, Longitude: 120.60 W
Daytime population change due to commuting: -3,971 (-38.1%)
Workers who live and work in this place: 445 (8.7%)
Area code commonly used in this area: 509
| Here: | 7.8% |
| Washington: | 4.6% |
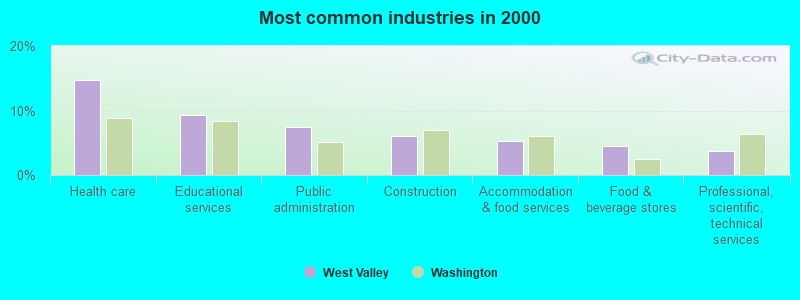
- Health care (14.7%)
- Educational services (9.3%)
- Public administration (7.4%)
- Construction (6.0%)
- Accommodation & food services (5.3%)
- Food & beverage stores (4.5%)
- Professional, scientific, technical services (3.7%)
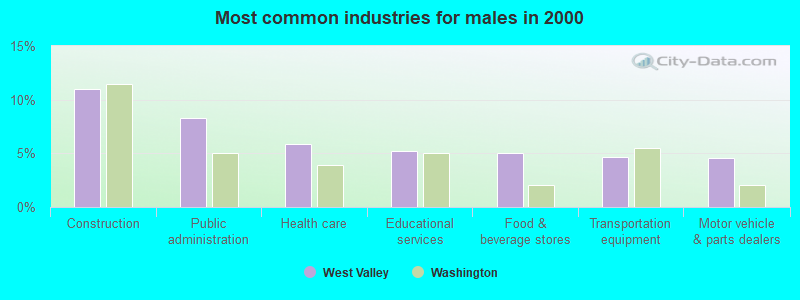
- Construction (11.0%)
- Public administration (8.3%)
- Health care (5.9%)
- Educational services (5.2%)
- Food & beverage stores (5.0%)
- Transportation equipment (4.7%)
- Motor vehicle & parts dealers (4.6%)
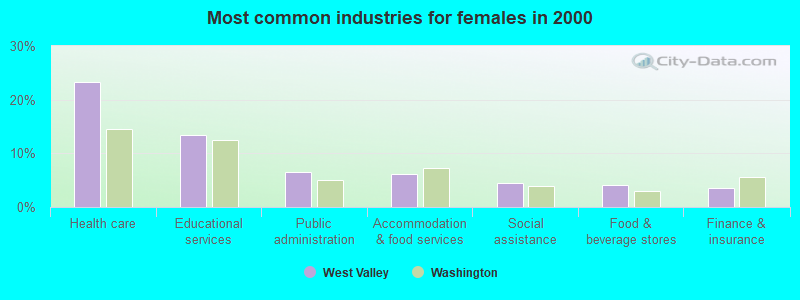
- Health care (23.2%)
- Educational services (13.3%)
- Public administration (6.5%)
- Accommodation & food services (6.2%)
- Social assistance (4.6%)
- Food & beverage stores (4.0%)
- Finance & insurance (3.6%)
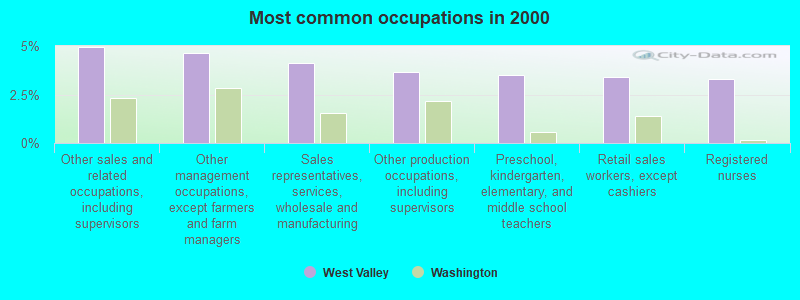
- Other sales and related occupations, including supervisors (5.0%)
- Other management occupations, except farmers and farm managers (4.7%)
- Sales representatives, services, wholesale and manufacturing (4.1%)
- Other production occupations, including supervisors (3.6%)
- Preschool, kindergarten, elementary, and middle school teachers (3.5%)
- Retail sales workers, except cashiers (3.4%)
- Registered nurses (3.3%)
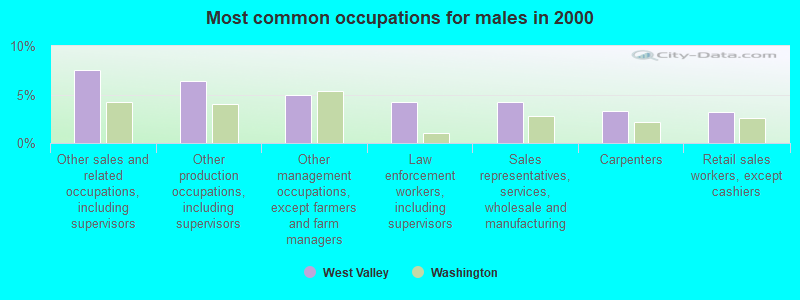
- Other sales and related occupations, including supervisors (7.5%)
- Other production occupations, including supervisors (6.4%)
- Other management occupations, except farmers and farm managers (5.0%)
- Law enforcement workers, including supervisors (4.3%)
- Sales representatives, services, wholesale and manufacturing (4.2%)
- Carpenters (3.3%)
- Retail sales workers, except cashiers (3.2%)
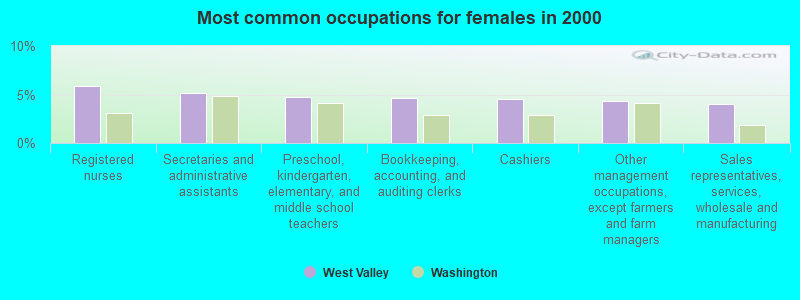
- Registered nurses (5.9%)
- Secretaries and administrative assistants (5.2%)
- Preschool, kindergarten, elementary, and middle school teachers (4.7%)
- Bookkeeping, accounting, and auditing clerks (4.7%)
- Cashiers (4.5%)
- Other management occupations, except farmers and farm managers (4.4%)
- Sales representatives, services, wholesale and manufacturing (4.0%)
Average climate in West Valley, Washington
Based on data reported by over 4,000 weather stations


(lower is better)
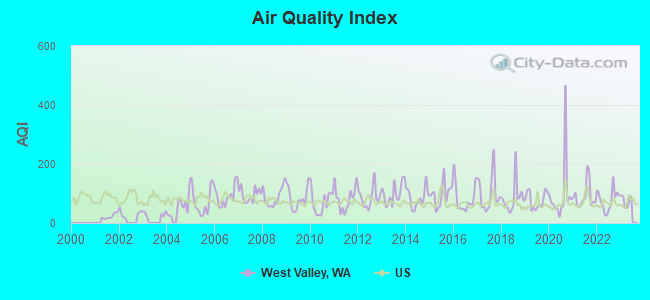
Air Quality Index (AQI) level in 2022 was 78.2. This is about average.
| City: | 78.2 |
| U.S.: | 72.6 |
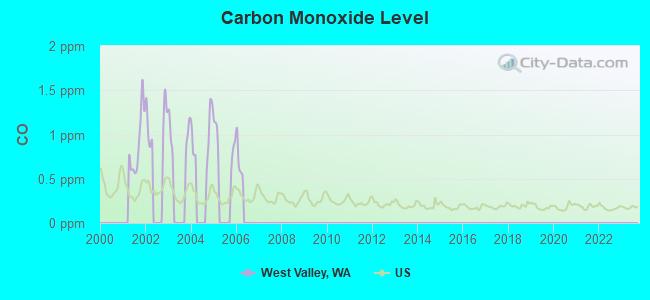
Carbon Monoxide (CO) [ppm] level in 2004 was 0.984. This is significantly worse than average. Closest monitor was 4.6 miles away from the city center.
| City: | 0.984 |
| U.S.: | 0.251 |
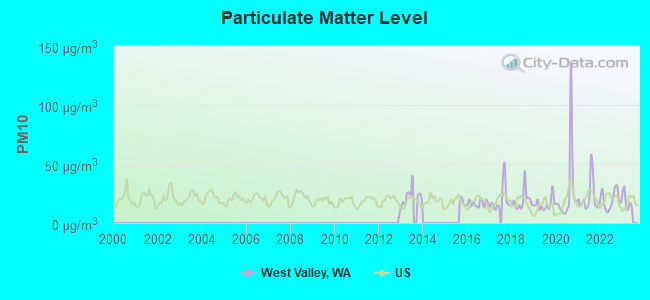
Particulate Matter (PM10) [µg/m3] level in 2022 was 19.7. This is about average. Closest monitor was 3.5 miles away from the city center.
| City: | 19.7 |
| U.S.: | 19.2 |
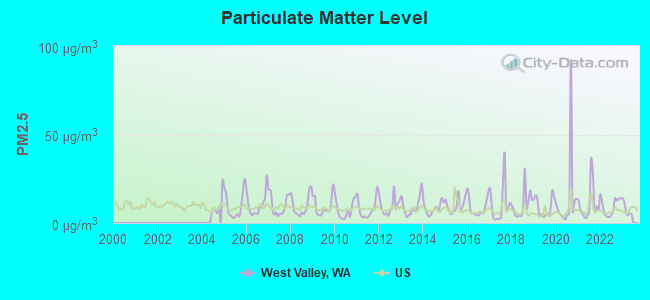
Particulate Matter (PM2.5) [µg/m3] level in 2022 was 9.24. This is about average. Closest monitor was 3.7 miles away from the city center.
| City: | 9.24 |
| U.S.: | 8.11 |
Earthquake activity:
West Valley-area historical earthquake activity is significantly above Washington state average. It is 1415% greater than the overall U.S. average.On 4/13/1949 at 19:55:42, a magnitude 7.0 (7.0 UK, Class: Major, Intensity: VIII - XII) earthquake occurred 100.3 miles away from the city center, causing $80,000,000 total damage
On 2/28/2001 at 18:54:32, a magnitude 6.8 (6.5 MB, 6.6 MS, 6.8 MW, Class: Strong, Intensity: VII - IX) earthquake occurred 99.5 miles away from the city center, causing $2,000,000,000 total damage and $305,000,000 insured losses
On 2/28/2001 at 18:54:32, a magnitude 6.8 (6.8 MD, Depth: 32.2 mi) earthquake occurred 107.4 miles away from the city center
On 4/29/1965 at 15:28:43, a magnitude 6.6 (6.6 UK) earthquake occurred 95.6 miles away from West Valley center, causing $28,000,000 total damage
On 10/28/1983 at 14:06:06, a magnitude 7.3 (6.2 MB, 7.3 MS, 7.0 MW) earthquake occurred 373.7 miles away from the city center, causing 2 deaths (2 shaking deaths) and 3 injuries, causing $15,000,000 total damage
On 10/3/1915 at 06:52:48, a magnitude 7.6 (7.6 UK) earthquake occurred 449.5 miles away from West Valley center
Magnitude types: body-wave magnitude (MB), duration magnitude (MD), surface-wave magnitude (MS), moment magnitude (MW)
Natural disasters:
The number of natural disasters in Yakima County (23) is greater than the US average (15).Major Disasters (Presidential) Declared: 14
Emergencies Declared: 3
Causes of natural disasters: Floods: 10, Fires: 8, Storms: 6, Mudslides: 3, Heavy Rains: 2, Snows: 2, Winter Storms: 2, Drought: 1, Earthquake: 1, Hurricane: 1, Landslide: 1, Volcanic Eruption: 1, Wind: 1, Other: 1 (Note: some incidents may be assigned to more than one category).
Hospitals and medical centers near West Valley:
- WILLOW SPRINGS CARE, INC (Nursing Home, about 3 miles away; YAKIMA, WA)
- CRESCENT HEALTH CARE, INC (Nursing Home, about 3 miles away; YAKIMA, WA)
- SUMMITVIEW HEALTHCARE CENTER (Nursing Home, about 3 miles away; YAKIMA, WA)
- MEMORIAL HOME CARE SVS (Home Health Center, about 3 miles away; YAKIMA, WA)
- LANDMARK CARE CENTER (Nursing Home, about 3 miles away; YAKIMA, WA)
- EASTERN STAR NURSING HOME-YAKIMA (Nursing Home, about 3 miles away; YAKIMA, WA)
- COMMUNITY HOSPITAL (Hospital, about 3 miles away; YAKIMA, WA)
Colleges/universities with over 2000 students nearest to West Valley:
- Yakima Valley Community College (about 4 miles; Yakima, WA; Full-time enrollment: 3,632)
- Central Washington University (about 29 miles; Ellensburg, WA; FT enrollment: 10,960)
- Wenatchee Valley College (about 59 miles; Wenatchee, WA; FT enrollment: 2,951)
- Columbia Basin College (about 75 miles; Pasco, WA; FT enrollment: 5,111)
- Pierce College at Puyallup (about 88 miles; Puyallup, WA; FT enrollment: 2,529)
- Green River Community College (about 90 miles; Auburn, WA; FT enrollment: 7,425)
- Pacific Lutheran University (about 95 miles; Tacoma, WA; FT enrollment: 3,548)
Points of interest:
Notable locations in West Valley: Meadow Brook (A), Congdon (B), Congdon Orchards (C), Yakima Fire Department Station 92 (D). Display/hide their locations on the map
Shopping Center: Meadowbrook Mall (1). Display/hide its location on the map
| This place: | 2.7 people |
| Washington: | 2.5 people |
| This place: | 78.2% |
| Whole state: | 66.5% |
| This place: | 4.5% |
| Whole state: | 6.1% |
Likely homosexual households (counted as self-reported same-sex unmarried-partner households)
- Lesbian couples: 0.3% of all households
- Gay men: 0.2% of all households
| This place: | 5.1% |
| Whole state: | 10.6% |
| This place: | 2.8% |
| Whole state: | 4.6% |
For population 15 years and over in West Valley:
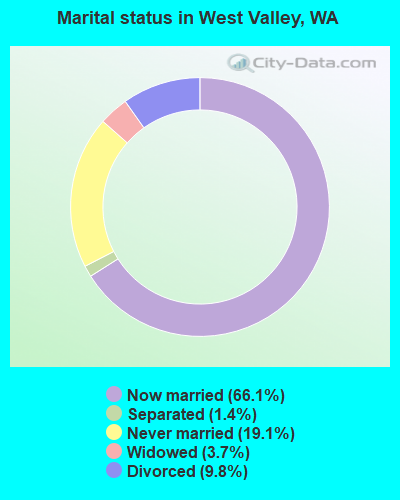
- Never married: 19.1%
- Now married: 66.1%
- Separated: 1.4%
- Widowed: 3.7%
- Divorced: 9.8%
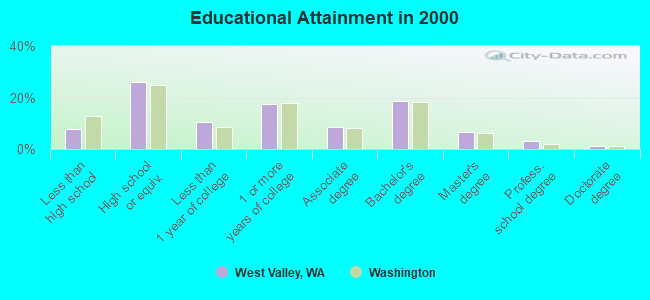
For population 25 years and over in West Valley:
- High school or higher: 92.1%
- Bachelor's degree or higher: 29.4%
- Graduate or professional degree: 10.8%
- Unemployed: 3.7%
- Mean travel time to work (commute): 17.3 minutes
| Here: | 9.6 |
| Washington average: | 11.3 |
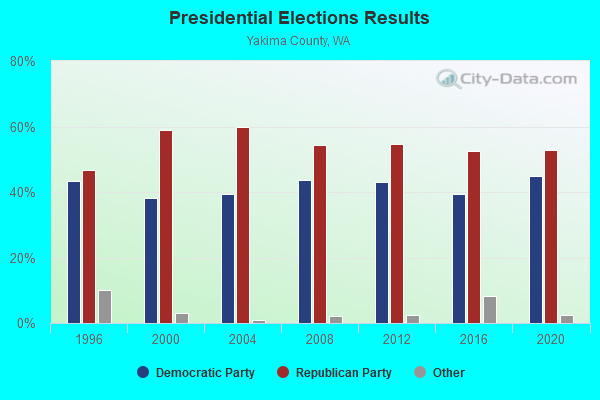
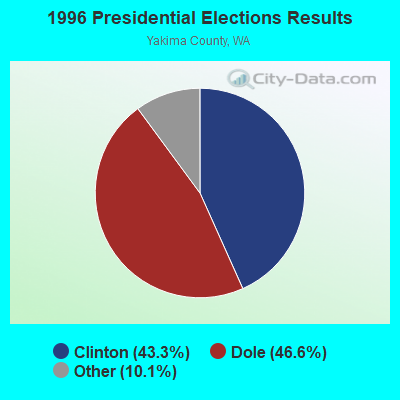
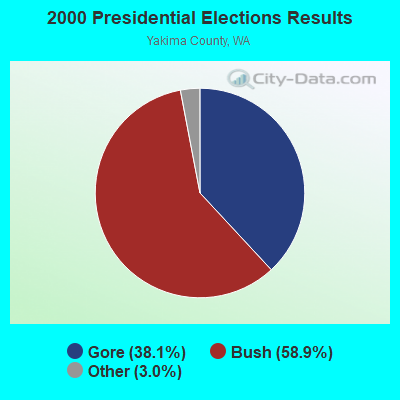
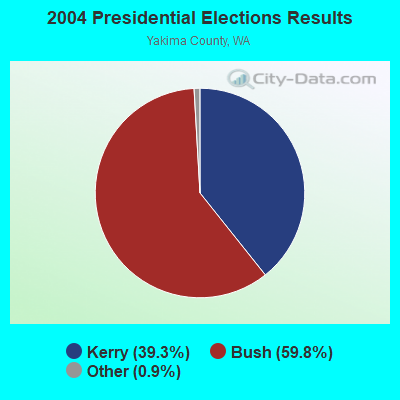

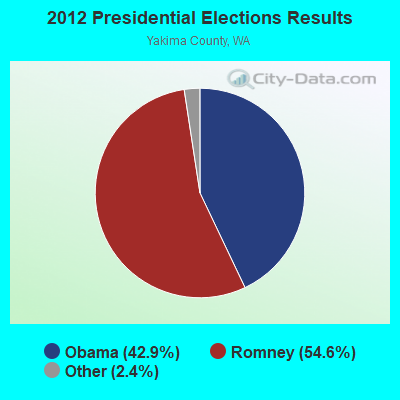
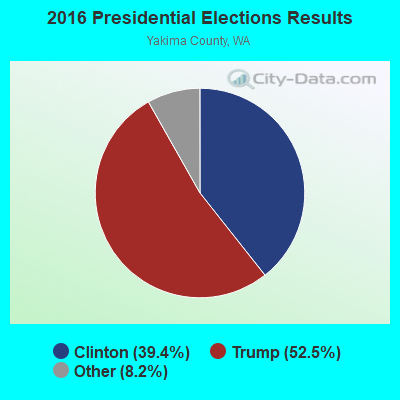
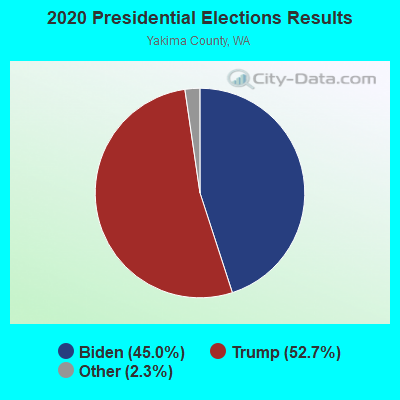
Graphs represent county-level data. Detailed 2008 Election Results
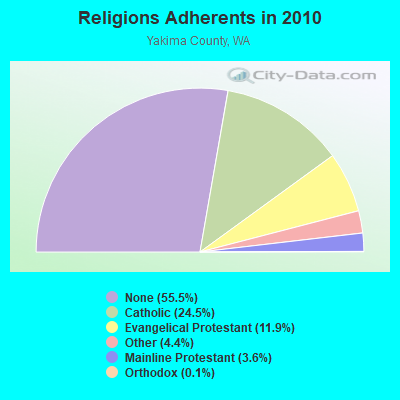
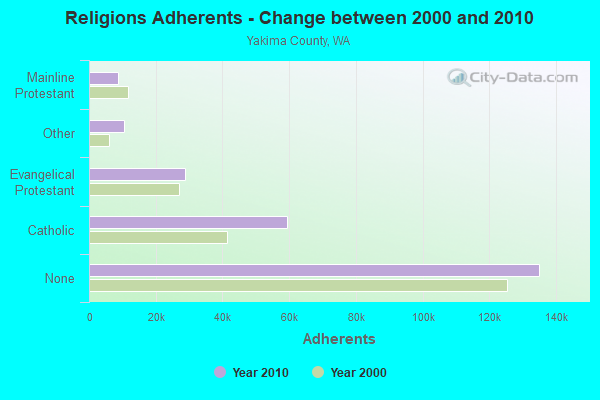
Religion statistics for West Valley, WA (based on Yakima County data)
| Religion | Adherents | Congregations |
|---|---|---|
| Catholic | 59,500 | 16 |
| Evangelical Protestant | 28,841 | 175 |
| Other | 10,606 | 36 |
| Mainline Protestant | 8,802 | 48 |
| Orthodox | 250 | 1 |
| Black Protestant | 197 | 2 |
| None | 135,035 | - |
Food Environment Statistics:
| Here: | 2.24 / 10,000 pop. |
| Washington: | 2.06 / 10,000 pop. |
| Here: | 0.30 / 10,000 pop. |
| State: | 0.19 / 10,000 pop. |
| Yakima County: | 0.99 / 10,000 pop. |
| Washington: | 1.18 / 10,000 pop. |
| Yakima County: | 3.45 / 10,000 pop. |
| State: | 2.67 / 10,000 pop. |
| This county: | 5.17 / 10,000 pop. |
| Washington: | 8.26 / 10,000 pop. |
| This county: | 9.2% |
| Washington: | 7.7% |
| Here: | 29.2% |
| Washington: | 25.7% |
| Here: | 17.6% |
| Washington: | 13.9% |
Strongest AM radio stations in West Valley:
- KJOX (980 AM; 5 kW; SELAH, WA; Owner: NEW NORTHWEST BROADCASTERS, LLC)
- KYAK (930 AM; 10 kW; YAKIMA, WA)
- KIT (1280 AM; 5 kW; YAKIMA, WA; Owner: CITICASTERS LICENSES, L.P.)
- KYXE (1020 AM; 5 kW; SELAH, WA; Owner: BUTTERFIELD BROADCASTING CORPORATION)
- KBBO (1390 AM; 5 kW; YAKIMA, WA; Owner: NEW NORTHWEST BROADCASTERS, LLC)
- KUTI (1460 AM; 5 kW; YAKIMA, WA; Owner: CITICASTERS LICENSES, L.P.)
- KTBI (810 AM; daytime; 50 kW; EPHRATA, WA; Owner: TACOMA BROADCASTERS, INCORPORATED)
- KZTS (1210 AM; 10 kW; SUNNYSIDE, WA; Owner: BUTTERFIELD BROADCASTING CORPORATION)
- KIRO (710 AM; 50 kW; SEATTLE, WA; Owner: ENTERCOM SEATTLE LICENSE, LLC)
- KTTH (770 AM; 50 kW; SEATTLE, WA; Owner: ENTERCOM SEATTLE LICENSE, LLC)
- KJR (950 AM; 50 kW; SEATTLE, WA)
- KIXI (880 AM; 50 kW; MERCER ISLAND/SEATTL, WA; Owner: BELLEVUE RADIO, INC.)
- KGNW (820 AM; 50 kW; BURIEN-SEATTLE, WA; Owner: INSPIRATION MEDIA, INC.)
Strongest FM radio stations in West Valley:
- KSOH (89.5 FM; WAPATO, WA; Owner: LIFETALK RADIO, INC.)
- K218CX (91.5 FM; YAKIMA, WA; Owner: CALVARY CHAPEL OF TWIN FALLS, INC.)
- KDNA (91.9 FM; YAKIMA, WA; Owner: NORTHWEST COMMUNITIES EDUC., CENTER)
- KNWY (90.3 FM; YAKIMA, WA; Owner: WASHINGTON STATE UNIVERSITY)
- KATS (94.5 FM; YAKIMA, WA; Owner: CITICASTERS LICENSES, L.P.)
- KFFM (107.3 FM; YAKIMA, WA; Owner: CITICASTERS LICENSES, L.P.)
- KXDD (104.1 FM; YAKIMA, WA; Owner: NEW NORTHWEST BROADCASTERS, LLC)
- KHHK (99.7 FM; YAKIMA, WA; Owner: NEW NORTHWEST BROADCASTERS, LLC)
- KRSE (105.7 FM; YAKIMA, WA; Owner: NEW NORTHWEST BROADCASTERS, LLC)
- KZTA (96.9 FM; NACHES, WA; Owner: BUTTERFIELD BROADCASTING CORP)
- K201AS (88.1 FM; YAKIMA, WA; Owner: WEST VALLEY TRANSLATOR ASSOCIATION)
- KYPL (91.1 FM; YAKIMA, WA; Owner: GROWING CHRISTIAN FOUNDATION)
- KDBL (92.9 FM; TOPPENISH, WA; Owner: CITICASTERS LICENSES, L.P.)
- KXLE-FM (95.3 FM; ELLENSBURG, WA; Owner: KXLE, INC.)
- KQBE (103.1 FM; ELLENSBURG, WA; Owner: PEAK COMMUNICATIONS, INC.)
- KQSN (99.3 FM; NACHES, WA; Owner: CAPSTAR TX LIMITED PARTNERSHIP)
- K232CV (94.3 FM; ELLENSBURG, WA; Owner: CITICASTERS LICENSES, L.P.)
- K204DH (88.7 FM; HANFORD, WA; Owner: CALVARY CHAPEL OF TWIN FALLS, INC.)
- KPQ-FM (102.1 FM; WENATCHEE, WA; Owner: WESCOAST BROADCASTING COMPANY)
- KNWR (90.7 FM; ELLENSBURG, WA; Owner: WASHINGTON STATE UNIVERSITY)
TV broadcast stations around West Valley:
- KAPP (Channel 35; YAKIMA, WA; Owner: APPLE VALLEY BROADCASTING, INC.)
- KYVE (Channel 47; YAKIMA, WA; Owner: KCTS TELEVISION)
- KIMA-TV (Channel 29; YAKIMA, WA; Owner: FISHER BROADCASTING - WASHINGTON TV, L.L.C.)
- KNDO (Channel 23; YAKIMA, WA; Owner: KHQ, INCORPORATED)
- KAZW-LP (Channel 14; YAKIMA, WA; Owner: CASA OF WASHINGTON, LLC)
- K58DL (Channel 58; YAKIMA-TOPPENISH, WA; Owner: THREE ANGELS B/CING NETWORK, INC.)
- KKFQ-CA (Channel 2; YAKIMA, WA; Owner: WATCHTV, INC.)
- K56EG (Channel 56; YAKIMA, ETC., WA; Owner: RON BEVINS)
- K43GY (Channel 43; YAKIMA, ETC., WA; Owner: RON BEVINS)
- K60EB (Channel 60; YAKIMA, WA; Owner: RON BEVINS)
- National Bridge Inventory (NBI) Statistics
- 1Number of bridges
- 7ft / 1.6mTotal length
- $1,823,000Total costs
- 21,075Total average daily traffic
- 2,529Total average daily truck traffic
- 27,650Total future (year 2039) average daily traffic
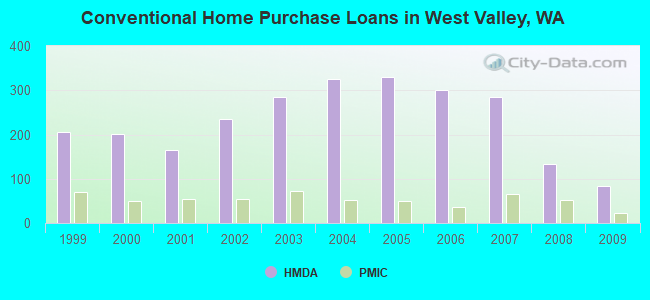
| Home Mortgage Disclosure Act Aggregated Statistics For Year 2009 (Based on 2 partial tracts) | ||||||||||||||
| A) FHA, FSA/RHS & VA Home Purchase Loans | B) Conventional Home Purchase Loans | C) Refinancings | D) Home Improvement Loans | E) Loans on Dwellings For 5+ Families | F) Non-occupant Loans on < 5 Family Dwellings (A B C & D) | G) Loans On Manufactured Home Dwelling (A B C & D) | ||||||||
|---|---|---|---|---|---|---|---|---|---|---|---|---|---|---|
| Number | Average Value | Number | Average Value | Number | Average Value | Number | Average Value | Number | Average Value | Number | Average Value | Number | Average Value | |
| LOANS ORIGINATED | 78 | $191,449 | 83 | $184,720 | 335 | $179,606 | 28 | $86,802 | 2 | $237,630 | 26 | $175,745 | 7 | $104,609 |
| APPLICATIONS APPROVED, NOT ACCEPTED | 2 | $174,225 | 3 | $121,013 | 33 | $205,712 | 2 | $176,220 | 0 | $0 | 1 | $198,930 | 1 | $15,580 |
| APPLICATIONS DENIED | 2 | $235,085 | 9 | $135,323 | 77 | $197,601 | 15 | $92,551 | 0 | $0 | 6 | $191,937 | 3 | $53,913 |
| APPLICATIONS WITHDRAWN | 6 | $178,988 | 5 | $144,422 | 72 | $210,987 | 5 | $109,750 | 0 | $0 | 6 | $160,543 | 3 | $101,927 |
| FILES CLOSED FOR INCOMPLETENESS | 1 | $121,630 | 1 | $199,250 | 21 | $232,570 | 1 | $15,020 | 0 | $0 | 1 | $182,730 | 1 | $8,260 |
Detailed HMDA statistics for the following Tracts: 0004.00 , 0009.00
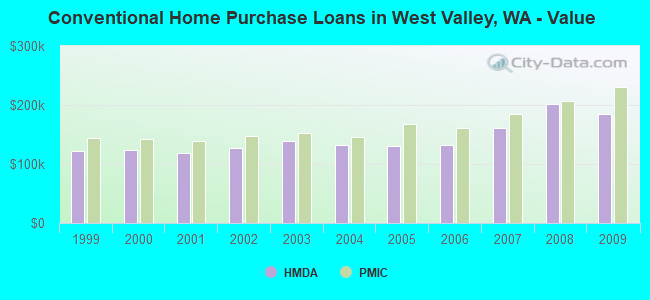
| Private Mortgage Insurance Companies Aggregated Statistics For Year 2009 (Based on 2 partial tracts) | ||||
| A) Conventional Home Purchase Loans | B) Refinancings | |||
|---|---|---|---|---|
| Number | Average Value | Number | Average Value | |
| LOANS ORIGINATED | 23 | $229,807 | 14 | $222,249 |
| APPLICATIONS APPROVED, NOT ACCEPTED | 2 | $346,220 | 8 | $211,850 |
| APPLICATIONS DENIED | 6 | $193,580 | 9 | $215,674 |
| APPLICATIONS WITHDRAWN | 3 | $245,433 | 1 | $153,160 |
| FILES CLOSED FOR INCOMPLETENESS | 0 | $0 | 0 | $0 |
Detailed PMIC statistics for the following Tracts: 0004.00 , 0009.00
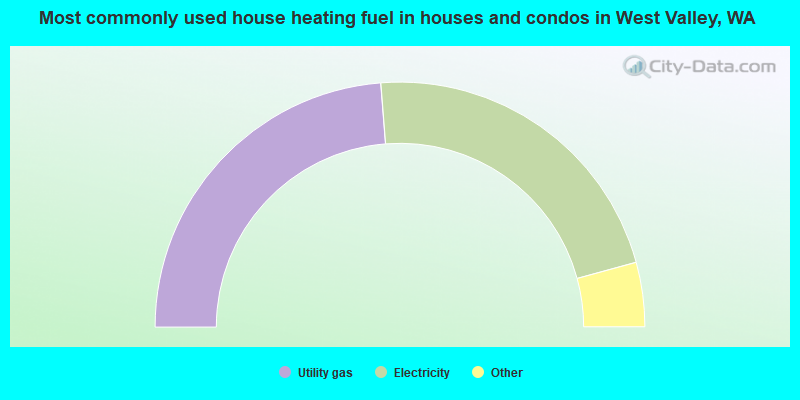
- 47.5%Utility gas
- 44.0%Electricity
- 3.0%Fuel oil, kerosene, etc.
- 2.4%Wood
- 2.0%Bottled, tank, or LP gas
- 0.7%Other fuel
- 0.4%No fuel used
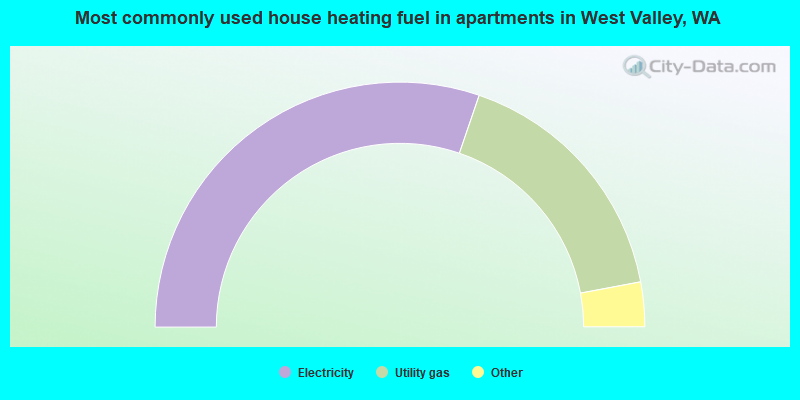
- 60.5%Electricity
- 33.6%Utility gas
- 3.1%Bottled, tank, or LP gas
- 2.2%Wood
- 0.6%Fuel oil, kerosene, etc.
West Valley compared to Washington state average:
- Unemployed percentage significantly below state average.
- Black race population percentage significantly below state average.
- Foreign-born population percentage significantly below state average.
- Renting percentage significantly below state average.
- Length of stay since moving in significantly above state average.
- Number of rooms per house significantly below state average.
- House age significantly below state average.
West Valley on our top lists:
- #14 on the list of "Top 101 cities with largest percentage of females in industries: machinery, equipment, and supplies merchant wholesalers (population 5,000+)"
- #15 on the list of "Top 101 cities with largest percentage of males in occupations: other health diagnosing and treating practitioners and technical occupations (population 5,000+)"
- #24 on the list of "Top 101 cities with largest percentage of females in industries: building material and garden equipment and supplies dealers (population 5,000+)"
- #25 on the list of "Top 101 cities with largest percentage of males in industries: groceries and related products merchant wholesalers (population 5,000+)"
- #27 on the list of "Top 101 cities with largest percentage of females in industries: beverage and tobacco products (population 5,000+)"
- #31 on the list of "Top 101 cities with largest percentage of males in industries: drugs, sundries, and chemical and allied products merchant wholesalers (population 5,000+)"
- #32 on the list of "Top 101 cities with largest percentage of males in industries: food and beverage stores (population 5,000+)"
- #35 on the list of "Top 101 cities with largest percentage of males in occupations: other sales and related workers including supervisors (population 5,000+)"
- #35 on the list of "Top 101 cities with largest percentage of females in industries: groceries and related products merchant wholesalers (population 5,000+)"
- #42 on the list of "Top 101 cities with largest percentage of males in industries: motor vehicle and parts dealers (population 5,000+)"
- #43 on the list of "Top 101 cities with largest percentage of females in industries: health care (population 5,000+)"
- #46 on the list of "Top 101 cities with largest percentage of females in occupations: other construction workers and helpers (population 5,000+)"
- #49 on the list of "Top 101 cities with largest percentage of females in occupations: plant and system operators (population 5,000+)"
- #49 on the list of "Top 101 cities with largest percentage of females in occupations: sales representatives, services, wholesale and manufacturing (population 5,000+)"
- #53 on the list of "Top 101 cities with largest percentage of females in industries: electrical and electronic goods merchant wholesalers (population 5,000+)"
- #71 on the list of "Top 101 cities with largest percentage of females in industries: warehousing and storage (population 5,000+)"
- #72 on the list of "Top 101 cities with largest percentage of females in occupations: special education teachers (population 5,000+)"
- #72 on the list of "Top 101 cities with largest percentage of females in industries: jewelry, luggage, and leather goods stores (population 5,000+)"
- #72 on the list of "Top 101 cities with largest percentage of males in industries: paper (population 5,000+)"
- #95 on the list of "Top 101 cities with largest percentage of males in industries: wood products (population 5,000+)"
- #18 on the list of "Top 101 counties with the highest number of births per 1000 residents 2007-2013"
- #33 on the list of "Top 101 counties with the lowest percentage of residents that visited a dentist within the past year"
- #35 on the list of "Top 101 counties with the lowest percentage of residents that drank alcohol in the past 30 days"
- #41 on the list of "Top 101 counties with the worst general health status score of residents (1-5), 3 years of data"
- #43 on the list of "Top 101 counties with the lowest percentage of residents relocating to other counties in 2011 (pop. 50,000+)"