Albuquerque, New Mexico, and Lubbock, Texas, are two diverse cities with unique attributes to consider when contemplating a move or just a visit. From their unique culinary scenes or sports team cultures to comparisons in cost of living, education, and weather, each location provides a distinctive feel and might appeal to various preferences. Let's delve in and gain a deeper understanding of these two contrasting yet captivating cities.
Distance between
Albuquerque, NM and
Lubbock, TX : 290.3 miles
Albuquerque's population is larger by 116%. Its population has grown by 113,992 people (25.4%) since 2000. The population of Lubbock has grown by 61,429 people (30.8%) during that time.
Both Albuquerque and Lubbock have crime rates higher than the national average. However, Albuquerque's rates are significantly higher, especially in terms of violent crimes, making Lubbock a safer choice overall. Neighborhoods and their safety vary widely within both cities, so it is prudent to research specific areas before deciding on a home. To get the most accurate information, it is always a good idea to check out local law enforcement websites for current crime statistics and trends.
City-data.com crime index counts serious crimes and violent crime more heavily. It adjusts for the number of visitors and daily workers commuting into cities. (higher means more crime, U.S. average = 301.1)
City-data.com crime index counts serious crimes and violent crime more heavily. It adjusts for the number of visitors and daily workers commuting into cities. (higher means more crime, U.S. average = 301.1)
Sex Offenders
According to our data, there are 848 registered sex offenders living in Albuquerque and 595 registered sex offenders living in . The ratio of residents to sex offenders in Albuquerque is 660 to 1; the ratio in Lubbock is 424 to 1. The number of registered sex offenders compared to the number of residents is a smaller in Albuquerque than in Lubbock.
Cost of Living
The cost of living in Albuquerque is slightly higher than that in Lubbock. While both cities are below the national average, Lubbock's lower housing costs make it more affordable. The average home cost in Albuquerque is higher than in Lubbock. Groceries, healthcare, and utilities are also cheaper in Lubbock.
Income Tax
Income tax is a key point of contrast. New Mexico imposes a state income tax, which affects Albuquerque residents. In contrast, Texas is one of the few states with no income tax, a strong consideration for those considering a move to Lubbock.
Property Tax
Comparing property tax, you'll find Lubbock, Texas, to have a higher rate than Albuquerque, New Mexico. This is critical to factor into expenses if you're considering purchasing a property.
Sales Tax
New Mexico, including Albuquerque, has a higher sales tax rate than Texas, impacting the cost of goods and services. While there is no sales tax in Lubbock at the state level, the city does levy a local sales tax. It is important to take this into account when comparing the cost of living in these two locations.
Income
Type
Albuquerque
Lubbock
Estimated median household income
$58,512
$54,747
Estimated per capita income
$35,738
$30,618
Cost of living index (U.S. average is 100)
93.6
83.8
If you make $50,000 in Lubbock, you will have to make $55,847 in Albuquerque to maintain the same standard of living.
Geographical Conditions
Albuquerque is known for its high desert landscape, featuring the Rio Grande and nearby Sandia Mountains, ideal for outdoor activities like hiking and biking. Lubbock is located in the High Plains region of Texas, known for its flat topography and cotton fields.
Albuquerque has an edge in terms of education, with several notable universities like the University of New Mexico and the Central New Mexico Community College. Lubbock is home to Texas Tech University, a reputable institution but lacks Albuquerque's range of educational institutions. Public school rankings are more favorable in Albuquerque.
Lubbock's economy is centered around agriculture, manufacturing, education, and healthcare, with a lower unemployment rate compared to Albuquerque. Albuquerque's economy is more diversified, with film and television production, research and development, tourism, and nuclear science. Both cities have a variety of job opportunities depending on your field of interest.
Biggest Employers
In Albuquerque, some of the biggest employers are Sandia National Laboratories, University of New Mexico, and Bernalillo County. In Lubbock, Texas Tech University, Covenant Health System, and United Supermarkets are among the largest employers.
There were 773 building permits issued in Albuquerque in 2012 (19 more than in 2011) compared to 2,454 building permits issued in Lubbock in 2012 (1825 more than in 2011).
In Albuquerque (Bernalillo County), 55.8% voted for Democrats and 39.4% for Republicans in 2012 Presidential Election. In Lubbock (Lubbock County), 28.8% voted for Democrats and 69.6% for Republicans.
Elections
Type
Democrats
Republicans
Other
Year
Albuquerque
Lubbock
Albuquerque
Lubbock
Albuquerque
Lubbock
2020
61.3%
33.2%
36.7%
65.4%
2.0%
1.3%
2016
52.4%
28.3%
34.6%
66.4%
13.0%
5.3%
2012
55.8%
28.8%
39.4%
69.6%
4.9%
1.5%
2008
60.2%
31.3%
38.8%
68.1%
1.0%
0.7%
2004
51.6%
24.2%
47.4%
75.4%
0.9%
0.4%
2000
48.8%
24.4%
46.8%
73.9%
4.4%
1.7%
1996
48.3%
30.6%
43.2%
63.5%
8.5%
5.9%
Breakdown of population affiliated with a religious congregation
Type
Adherents
Congregations
Religion
Albuquerque
Lubbock
Albuquerque
Lubbock
CATHOLIC CHURCH
26.5%
13.0%
10.7%
5.0%
SOUTHERN BAPTIST CONVENTION
2.6%
16.1%
11.4%
31.5%
EPISCOPAL CHURCH
0.7%
0.7%
1.9%
0.9%
CUMBERLAND PRESBYTERIAN CHURCH
0.4%
0.1%
0.2%
0.3%
EVANGELICAL LUTHERAN CHURCH IN AMERICA
0.4%
0.2%
1.9%
1.2%
SEVENTH DAY ADVENTIST CHURCH
0.4%
0.2%
1.9%
0.9%
LUTHERAN CHURCH
0.3%
0.3%
1.7%
0.9%
MUSLIM ESTIMATE
0.3%
1.8%
0.5%
0.6%
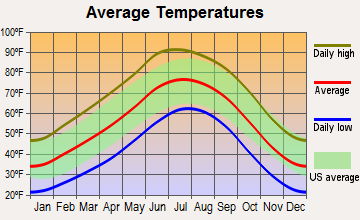
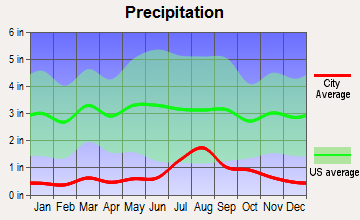
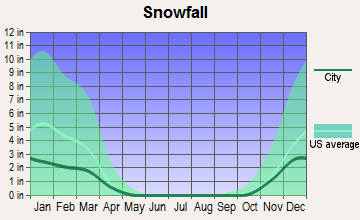
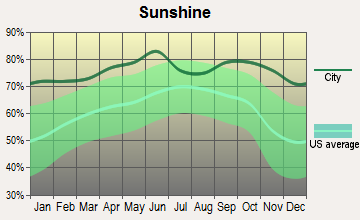
Weather
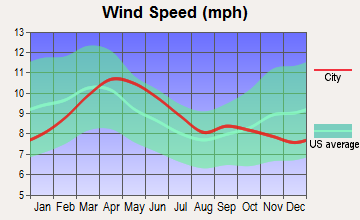
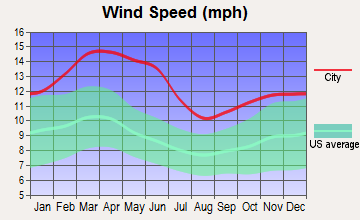
When comparing the weather, you'll find Albuquerque to have a more varied climate with hot Summers but also witnessing snow in the winter. It's also known for its high winds, especially during the spring season. Lubbock, on the other hand, has more of a steady climate, with hot, drier Summers and mild to moderately cold Winters. Both cities have a similar amount of sunny days per year.
Weather and climate
Type
Albuquerque
Lubbock
Temperature - Average
55.6°F
59.7°F
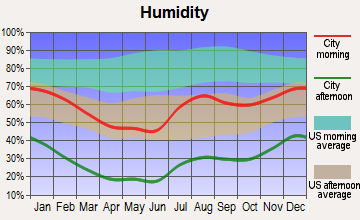
Humidity - Average morning or afternoon humidity
44.3%
64.4%
Humidity - Differences between morning and afternoon humidity
46%
42.3%
Humidity - Maximum monthly morning or afternoon humidity
63%
79.7%
Humidity - Minimum monthly morning or afternoon humidity
17%
37.4%
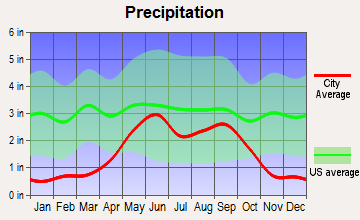
Precipitation - Yearly average
9.4 in
19 in
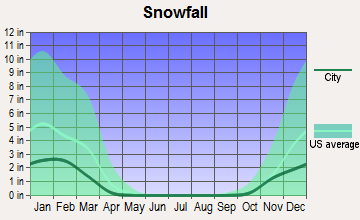
Snowfall - Yearly average
19.2 in
16.7 in
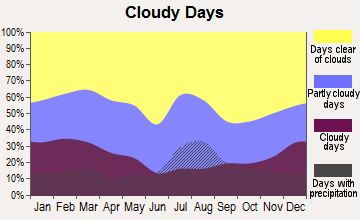
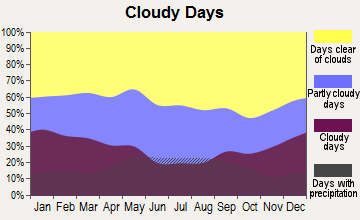
Clouds - Number of days clear of clouds
27.8%
26.6%
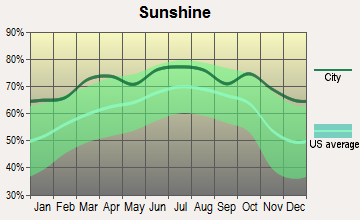
Sunshine amount - Average
82.7%
78.7%
Sunshine amount - Differences during a year
9%
16.7%
Sunshine amount - Maximum monthly
82%
80%
Sunshine amount - Minimum monthly
73%
63.3%
Wind speed - Average
8.9 mph
12.8 mph
Average climate in Albuquerque, New Mexico
Average climate in Lubbock, Texas
Air pollution
Type
AQI
CO
NO2
OZONE
PB
PM10
PM25
SO2
Year
Albuquerque
Lubbock
Albuquerque
Albuquerque
Albuquerque
Albuquerque
Albuquerque
Albuquerque
Lubbock
Albuquerque
2018
95
62
0.23
N/A
10.3
N/A
35.3
N/A
N/A
N/A
20.3
N/A
4.3
6.6
0.5
N/A
2017
82
56
0.24
N/A
10.4
N/A
33.5
N/A
N/A
N/A
18.4
N/A
5.7
6.3
0.4
N/A
2016
86
N/A
0.22
N/A
10.4
N/A
33.2
N/A
N/A
N/A
16.0
N/A
5.3
N/A
0.8
N/A
2015
84
N/A
0.23
N/A
11.2
N/A
30.8
N/A
N/A
N/A
16.0
N/A
6.1
N/A
0.7
N/A
2014
89
61
0.22
N/A
11.7
N/A
31.8
N/A
N/A
N/A
22.0
N/A
6.1
7.6
0.6
N/A
2013
91
68
0.22
N/A
11.8
N/A
34.1
N/A
N/A
N/A
21.8
N/A
5.7
7.5
0.8
N/A
2012
116
76
0.18
N/A
13.7
N/A
33.6
N/A
N/A
N/A
26.6
N/A
9.3
9.0
0.7
N/A
2011
130
81
0.21
N/A
13.5
N/A
34.0
N/A
N/A
N/A
28.6
N/A
9.9
9.1
0.4
N/A
2010
92
57
0.15
N/A
12.2
N/A
32.1
N/A
N/A
N/A
25.1
N/A
6.8
6.7
N/A
N/A
2009
81
59
0.16
N/A
12.5
N/A
30.4
N/A
N/A
N/A
26.2
N/A
6.9
7.0
N/A
N/A
2008
91
N/A
0.21
N/A
11.8
N/A
31.5
N/A
N/A
N/A
20.8
N/A
6.5
N/A
N/A
N/A
2007
112
N/A
0.29
N/A
13.0
N/A
31.4
N/A
N/A
N/A
19.7
N/A
6.7
N/A
N/A
N/A
2006
103
N/A
0.33
N/A
14.2
N/A
31.8
N/A
N/A
N/A
21.1
N/A
N/A
N/A
N/A
N/A
2005
85
N/A
0.32
N/A
13.9
N/A
29.7
N/A
N/A
N/A
20.0
N/A
N/A
N/A
N/A
N/A
2004
89
N/A
0.32
N/A
16.6
N/A
29.8
N/A
0.003
N/A
21.5
N/A
N/A
N/A
N/A
N/A
2003
115
N/A
0.37
N/A
17.6
N/A
31.9
N/A
0.004
N/A
25.1
N/A
N/A
N/A
N/A
N/A
2002
91
N/A
0.43
N/A
18.9
N/A
29.1
N/A
0.005
N/A
23.1
N/A
N/A
N/A
N/A
N/A
2001
81
N/A
0.67
N/A
17.2
N/A
29.4
N/A
N/A
N/A
20.9
N/A
N/A
N/A
N/A
N/A
2000
95
N/A
0.81
N/A
17.0
N/A
27.9
N/A
N/A
N/A
17.7
N/A
N/A
N/A
N/A
N/A
Natural disasters
Type
Albuquerque
Lubbock
Tornado activity compared to U.S. average
6.4%
166%
Earthquake activity compared to U.S. average
802.6%
535.5%
Natural disasters compared to U.S. average
9%
14%
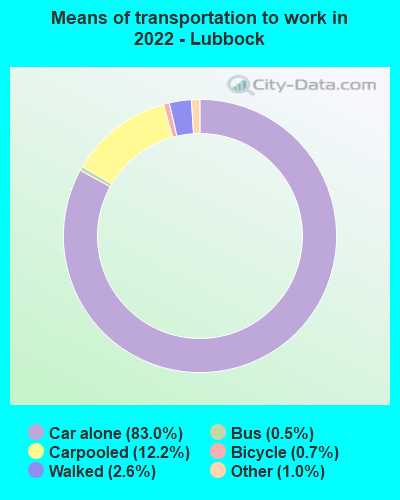
Transportation
In terms of transportation, Lubbock is more reliant on cars, with a higher percentage of people driving to work. Albuquerque offers more options for public transit, including a comprehensive bus network and an Amtrak station. Commuting times are comparable in both cities.
Transport
Type
Albuquerque
Lubbock
Amtrak stations
1
0
Amtrak stations nearby
1
0
FAA registered aircraft
1
293
FAA registered aircraft manufacturers and dealers
17
0
Means of transportation to work
Type
Albuquerque
Lubbock
Bicycle
0.9%
0.3%
Bus
0.8%
0.8%
Carpooled
9.6%
9.6%
Car alone
85.1%
86.4%
Motorcycle
0.2%
0.2%
Walked
2.3%
1.9%
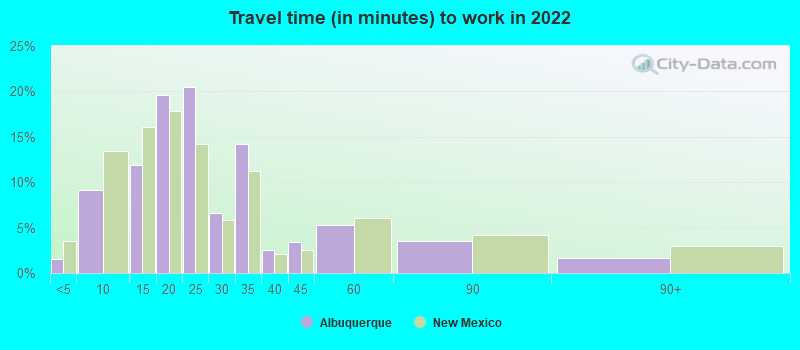
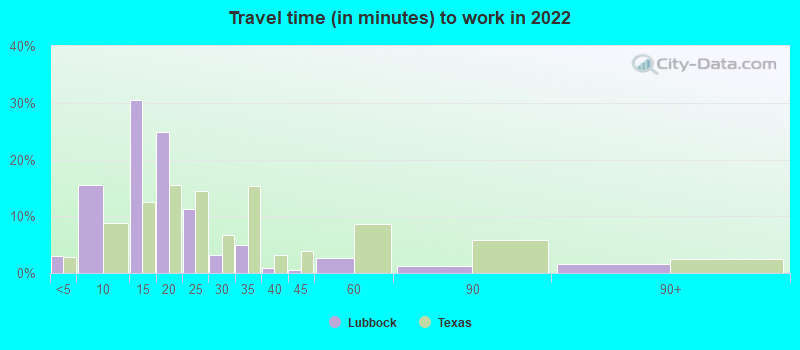
Average travel time to work
Type
Albuquerque
Lubbock
Average
24.5 min
18.2 min
Other means
20.8 min
18 min
Public transportation
37.8 min
31.3 min
Private vehicle occupancy
Type
Albuquerque
Lubbock
Average
1.1
1.2
Drove alone
91.6%
89.3%
In 2 person carpool
6.6%
7.9%
In 3 person carpool
1.2%
1%
In 4 person carpool
0.3%
0.6%
In 5-6 person carpool
0.1%
1.2%
In 7+ person carpool
0.2%
0.1%
How many people usually rode to work in the car, truck or van.
Real Estate
The real estate market in both cities is dynamic, with Albuquerque being slightly more expensive than Lubbock. The median home price in Albuquerque is higher than in Lubbock. However, both cities offer a variety of housing options, from downtown apartments to suburban homes.
Neighborhoods
Albuquerque is known for its diverse neighborhoods, each with its unique culture, such as the historic Old Town or the trendy Nob Hill. In contrast, Lubbock has more traditional neighborhoods like Tech Terrace and South Overton, which are known for their proximity to Texas Tech University and local amenities.
Houses and residents
Type
Albuquerque
Lubbock
Houses
256,814
113,800
Average household size (people)
2.4
2.5
Median year apartment built
1983
1985
Median year house/condo built
1984
1985
Length of stay in the house since moving in
12.6 years
12.4 years
Houses occupied
243,582 (94.8%)
104,426 (91.8%)
Houses occupied by owners
147,964 (60.7%)
53,722 (51.4%)
Houses occupied by renters
95,618 (39.3%)
50,704 (48.6%)
Median rent asked for vacant for-rent units
$893.82
$760.15
Median monthly housing costs
$1,021
$1,010
Median price asked for vacant for-sale houses and condos
$171,149
$431,965
Estimated median house or condo value
$251,500
$171,400
Median numbers of rooms
5.3
5.2
Median number of rooms in apartments
3.9
4
Median number of rooms in houses and condos
6.2
6.2
Median house price - detached houses
$290,578
$217,964
Median house price - in 2-unit structures
$636,758
$266,863
Median house price - in 3-to-4-unit structures
$274,794
$270,056
Median house price - in 5 or more unit structures
$224,872
$186,477
Median house price - mobile homes
$52,392
$60,138
Median house price - occupied boats, rvs, vans etc.
$35,209
$28,841
Median house price - Townhouses or other attached units
$209,825
$159,383
Median house price - All housing units
$271,083
$215,105
Median house age
38
37
Renting percentage
39.7%
45.4%
Housing density (houses/condos per square mile)
1,421.7
991.2
House value disparities
29.8%
37.4%
Household income disparities
45.9%
48.2%
Median household income for houses/condes with a mortgage
$87,851
$96,150
Median household income for apartments without a mortgage
$63,195
$60,175
Housing units without a mortgage
1,631 (1.6%)
244 (0.8%)
Housing units with both a second mortgage and home equity loan
3,560 (3.6%)
577 (1.9%)
Housing units with a mortgage
97,744 (98.4%)
29,683 (99.2%)
Housing units with a home equity loan
309 (0.3%)
0 (0%)
Housing units with a second mortgage
6,864 (6.9%)
705 (2.4%)
House/condo owner moved in on average (years ago)
11
9
House/condo renter moved in on average (years ago)
1
1
Housing units lacking complete kitchen facilities
1.1%
2.9%
Housing units lacking complete plumbing facilities
0.3%
1.9%
Housing units in structures
Housing units in structures
Albuquerque
Lubbock
One, detached
61.4%
64.8%
One, attached
6.6%
2.7%
Two
1.0%
3.6%
3 or 4
6.1%
5.0%
5 to 9
4.7%
6.5%
10 to 19
4.7%
5.4%
20 to 49
4.8%
2.8%
50 or more
6.3%
6.9%
Mobile homes
4.2%
2.2%
Boats, RVs, vans, etc.
0.0%
0.1%
Median real estate property taxes paid for housing units
Self-employed workers in own not incorporated business
14,060
8,411
State government workers
20,531
10,797
Unpaid family workers
359
523
Industries and Occupations
Albuquerque has diverse industries ranging from high tech like Intel and Sandia National Laboratories to retail and healthcare sectors. Lubbock's economy is more reliant on education, agriculture, and wholesale trade. Top occupations in Albuquerque include management, sales, and healthcare, while in Lubbock, they include education, sales, and management.
Healthcare options are robust in both cities. Albuquerque features many highly rated hospitals, including the University of New Mexico Hospital. Lubbock is home to the respected Texas Tech University Health Sciences Center.
Health (county statistics)
Type
Albuquerque
Lubbock
General health status score of residents in this county from 1 (poor) to 5 (excellent)
Both cities have a well-developed infrastructure. Lubbock has a more expansive road network, but Albuquerque has a more extensive public transit system, including buses, trains, and an international airport. Both cities have reliable internet connectivity, and Albuquerque is a recognized leader among "digital cities" for its use of technology in municipal government.
Infrastructure
Type
Albuquerque
Lubbock
Hospitals
36
36
TV stations
18
13
Arenas or stadiums
1
3
Bank branches located here
137
97
Bank institutions located here
24
22
Main business address for public companies
8
3
Drinking water stations with no reported violations in the past
7
3
Drinking water stations with reported violations in the past
HMDA - Conventional home purchase loans - Applications denied
Year
Albuquerque
Lubbock
1999
2,651
1,025
2000
1,303
673
2001
752
472
2002
693
402
2003
1,022
0
2004
1,729
542
2005
2,199
566
2006
2,639
565
2007
1,575
343
2008
654
161
2009
368
115
Culture and Food
Both cities have strong cultural roots. Albuquerque is known for its mix of Native American, Hispanic, and Anglo influences, reflected in its art, music, and food. Lubbock is deeply rooted in Texan culture and is recognized for its live music scene. In terms of food, Albuquerque is renowned for its New Mexican cuisine, while Lubbock is famous for its barbecue and Tex-Mex dishes.
Sports Teams
Sports enthusiasts will find plenty to cheer about in both cities. Albuquerque hosts the New Mexico United soccer team, and Albuquerque Isotopes, a minor league baseball team. Lubbock is home to the Texas Tech Red Raiders, and its sporting events are among the city's major attractions.


 Albuquerque, NM
 Lubbock, TX