Anaheim, CA and Corona, CA are neighboring cities in southern California that offer unique lifestyle benefits. They are both family-friendly cities with a high focus on safety, education, and community. However, living or simply visiting each can present distinct experiences influenced by factors such as cost of living, employment opportunities, weather, culture, and infrastructure. The choice between the two communities should be dependent on personal preferences and needs.
Distance between
Anaheim, CA and
Corona, CA : 18.6 miles
Anaheim's population is larger by 117%. Its population has grown by 17,926 people (5.5%) since 2000. The population of Corona has grown by 34,777 people (27.8%) during that time.
Safety in both Anaheim and Corona is a priority, and both cities have their dedicated police departments which work diligently to maintain community security. The crime rates can vary year-to-year, but statistically, Corona typically has a lower crime rate than Anaheim. However, this still means that Anaheim is safer than many cities across the country. Neighborhood watch programs and city-sponsored security initiatives are common in both cities.
City-data.com crime index counts serious crimes and violent crime more heavily. It adjusts for the number of visitors and daily workers commuting into cities. (higher means more crime, U.S. average = 301.1)
City-data.com crime index counts serious crimes and violent crime more heavily. It adjusts for the number of visitors and daily workers commuting into cities. (higher means more crime, U.S. average = 301.1)
Sex Offenders
According to our data, there are 383 registered sex offenders living in Anaheim and 152 registered sex offenders living in . The ratio of residents to sex offenders in Anaheim is 917 to 1; the ratio in Corona is 1,097 to 1. The number of registered sex offenders compared to the number of residents in Anaheim is near to than in Corona.
Cost of Living
The cost of living in Anaheim is generally higher than in Corona. This includes housing, groceries, and transportation costs. Higher living costs in Anaheim are partially offset by the relatively higher average income compared to Corona. Picking the city that aligns with your financial capacity and lifestyle demands is vital.
Income Tax
Both cities fall under the California state tax system, and thus, share the same state income tax rates which are progressive from 1% to 13.3%, depending on an individual's income.
Property Tax
Property taxes in both cities are calculated as a percentage of the home's value. Corona typically has a slightly lower property tax rate than Anaheim. However, these rates can fluctuate based on local tax levies.
Sales Tax
The total sales tax rate in Anaheim and Corona are at par, both currently at 7.75%. This includes the California state sales tax of 6%, coupled with county and city sales taxes.
Income
Type
Anaheim
Corona
Estimated median household income
$81,747
$92,606
Estimated per capita income
$32,827
$35,675
Cost of living index (U.S. average is 100)
88.5
83.2
If you make $50,000 in Corona, you will have to make $53,185 in Anaheim to maintain the same standard of living.
Geographical Conditions
Anaheim is located in the flat basin of Orange County, making it less prone to natural disasters like wildfires and landslides. Corona, dubbed as "The Circle City," is nestled against the Santa Ana Mountains, making it more susceptible to wildfires, but drawing nature lovers with its beautiful views and trails.
Both Anaheim and Corona provide a mix of public and private schools, with many of them receiving high ratings. Anaheim is home to several universities and colleges, including the prestigious Anaheim University. Corona, on the other hand, has a range of vocational and technical institutes. Therefore, education opportunities are abundant in both cities for families and individuals.
Anaheim’s economy is diverse with industries ranging from manufacturing to healthcare to entertainment. Disneyland Resort is one of the biggest employers in the city. Corona's economy is also diverse and has recently seen growth in sectors such as healthcare, retail, and education. However, Anaheim’s economy is larger, giving it a slightly higher employment rate than Corona.
Biggest Employers
In Anaheim, Disneyland Resort stands as the biggest employer, followed by companies like the Anaheim Regional Medical Center and L-3 Communications. Corona’s biggest employers include Corona Regional Medical Center, Fender Musical Instruments Corporation, and the Corona-Norco Unified School District.
There were 85 building permits issued in Anaheim in 2012 (44 more than in 2011) compared to 177 building permits issued in Corona in 2012 (122 more than in 2011).
In Anaheim (Orange County), 45.8% voted for Democrats and 52.0% for Republicans in 2012 Presidential Election. In Corona (Riverside County), 49.6% voted for Democrats and 48.0% for Republicans.
Elections
Type
Democrats
Republicans
Other
Year
Anaheim
Corona
Anaheim
Corona
Anaheim
Corona
2020
53.6%
53.0%
44.6%
45.0%
1.8%
2.0%
2016
50.9%
49.7%
42.4%
44.4%
6.7%
5.9%
2012
45.8%
49.6%
52.0%
48.0%
2.3%
2.4%
2008
47.8%
50.4%
50.3%
48.1%
1.9%
1.5%
2004
39.3%
41.3%
60.2%
58.2%
0.5%
0.6%
2000
40.4%
45.0%
55.9%
51.6%
3.7%
3.4%
1996
37.9%
43.0%
51.7%
45.6%
10.5%
11.3%
Breakdown of population affiliated with a religious congregation
Type
Adherents
Congregations
Religion
Anaheim
Corona
Anaheim
Corona
CATHOLIC CHURCH
26.5%
27.5%
4.4%
4.5%
SOUTHERN BAPTIST CONVENTION
2.3%
1.2%
8.8%
11.2%
MUSLIM ESTIMATE
0.8%
0.5%
1.3%
0.7%
LUTHERAN CHURCH
0.6%
0.3%
2.0%
1.8%
EPISCOPAL CHURCH
0.4%
0.2%
1.4%
1.4%
EVANGELICAL LUTHERAN CHURCH IN AMERICA
0.4%
0.3%
2.3%
1.5%
SEVENTH DAY ADVENTIST CHURCH
0.4%
0.9%
1.3%
3.4%
REFORMED CHURCH IN AMERICA
0.3%
0.3%
0.2%
0.7%
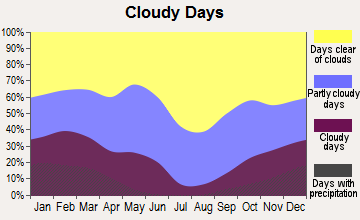
Weather
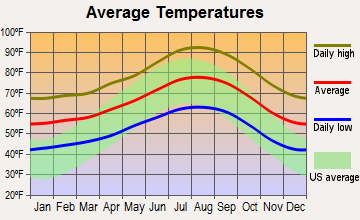
Anaheim and Corona, being in Southern California, share a Mediterranean climate. There are mild, wet winters and hot, dry summers with plenty of sunshine. Anaheim tends to have slightly milder temperatures than Corona due to its proximity to the Pacific Ocean. Regardless, the difference is often minimal and both cities enjoy beautiful, sunny weather most of the year.
Weather and climate
Type
Anaheim
Corona
Temperature - Average
64.9°F
65.5°F
Humidity - Average morning or afternoon humidity
69.6%
67.4%
Humidity - Differences between morning and afternoon humidity
25.9%
22.4%
Humidity - Maximum monthly morning or afternoon humidity
77.9%
74.5%
Humidity - Minimum monthly morning or afternoon humidity
52%
52.1%
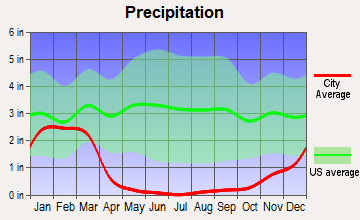
Precipitation - Yearly average
12 in
10.6 in
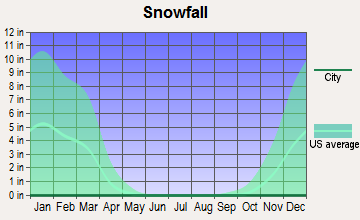
Snowfall - Yearly average
0 in
0 in
Clouds - Number of days clear of clouds
26.6%
27.2%
Sunshine amount - Average
78.4%
78.3%
Sunshine amount - Differences during a year
22%
21.7%
Sunshine amount - Maximum monthly
84.9%
84.5%
Sunshine amount - Minimum monthly
63%
62.8%
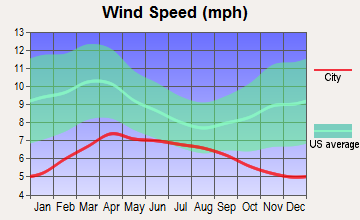
Wind speed - Average
5.7 mph
4.8 mph
Average climate in Anaheim, California
Average climate in Corona, California
Air pollution
Type
AQI
CO
NO2
OZONE
PB
PM10
PM25
SO2
Year
Anaheim
Corona
Anaheim
Corona
Anaheim
Corona
Anaheim
Corona
Anaheim
Corona
Anaheim
Corona
Anaheim
Corona
Anaheim
Corona
2018
139
152
0.36
0.32
13.7
14.3
26.8
29.7
0.007
0.006
27.5
39.7
12.1
13.6
0.7
0.4
2017
145
153
0.50
0.33
14.8
14.4
26.7
31.0
0.007
0.004
26.7
42.6
13.5
14.8
0.6
0.3
2016
132
140
0.57
0.30
14.5
14.6
26.3
30.6
0.007
0.006
24.1
38.3
12.9
14.7
0.3
0.3
2015
142
148
0.45
0.28
14.7
14.6
26.0
30.5
0.007
0.004
25.0
38.0
14.8
15.8
0.3
0.3
2014
138
145
0.40
0.30
15.0
15.3
26.7
29.8
0.008
0.006
26.7
40.3
16.2
16.7
0.5
0.3
2013
138
145
0.47
0.30
14.8
15.8
25.3
28.4
0.005
0.006
28.3
39.3
13.9
15.8
0.5
0.3
2012
142
148
0.46
0.32
14.5
16.3
25.0
28.5
0.005
0.007
27.0
38.1
14.7
17.1
0.2
0.3
2011
138
147
0.42
0.34
15.9
16.8
26.7
29.3
0.007
0.006
27.4
36.8
16.0
18.3
0.8
0.4
2010
130
143
0.44
0.38
16.7
17.5
25.8
29.3
0.009
0.008
23.5
32.8
14.9
17.4
0.6
1.1
2009
151
156
0.41
0.36
18.0
19.1
26.0
28.6
0.010
0.009
24.4
33.5
15.4
18.2
1.1
1.3
2008
156
163
0.38
0.38
20.3
20.0
26.7
29.2
0.010
0.010
30.2
38.5
18.9
16.5
1.1
1.1
2007
135
138
0.38
0.50
19.5
22.1
26.2
27.7
0.012
0.012
N/A
N/A
N/A
N/A
0.8
1.5
2006
128
130
0.43
0.51
19.1
23.1
26.3
27.5
0.008
0.006
N/A
N/A
N/A
N/A
1.3
1.5
2005
128
134
0.45
0.51
20.7
24.2
31.3
26.0
0.013
0.012
N/A
N/A
N/A
N/A
1.3
2.7
2004
134
144
0.53
0.60
19.9
22.9
37.1
28.1
0.015
0.013
N/A
N/A
N/A
N/A
1.6
2.3
2003
143
145
0.69
0.66
23.7
26.4
23.8
26.9
0.025
0.017
N/A
N/A
N/A
N/A
1.1
1.6
2002
134
142
0.77
0.68
24.1
27.4
21.8
26.3
0.019
0.016
N/A
N/A
N/A
N/A
2.1
0.7
2001
143
149
0.94
0.81
28.4
28.7
24.5
25.2
0.035
0.029
N/A
N/A
N/A
N/A
1.7
1.1
2000
152
158
0.80
0.84
29.4
29.5
23.0
23.8
0.030
0.034
N/A
N/A
N/A
N/A
1.9
1.5
Natural disasters
Type
Anaheim
Corona
Tornado activity compared to U.S. average
19.3%
18.4%
Earthquake activity compared to U.S. average
7,039.7%
7,200.6%
Natural disasters compared to U.S. average
32%
46%
Transportation
Both cities are well-equipped for commuting with extensive roadways, train stations, and bus services. Anaheim provides more options for public transit including Amtrak and MetroLink services along with a bus network serviced by OCTA. Corona, while it has less public transit options, provides a good road connectivity and Metrolink train services.
Transport
Type
Anaheim
Corona
Amtrak stations
1
0
Amtrak stations nearby
3
3
FAA registered aircraft
136
177
FAA registered aircraft manufacturers and dealers
3
12
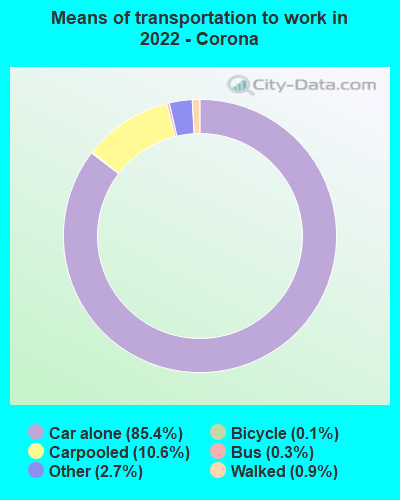
Means of transportation to work
Type
Anaheim
Corona
Bicycle
1%
0.1%
Bus
0.9%
0.6%
Carpooled
10.8%
10.5%
Car alone
83.4%
85.1%
Motorcycle
0.2%
0.3%
Railroad
0.2%
0.7%
Subway
0.3%
0%
Walked
1.6%
0.9%
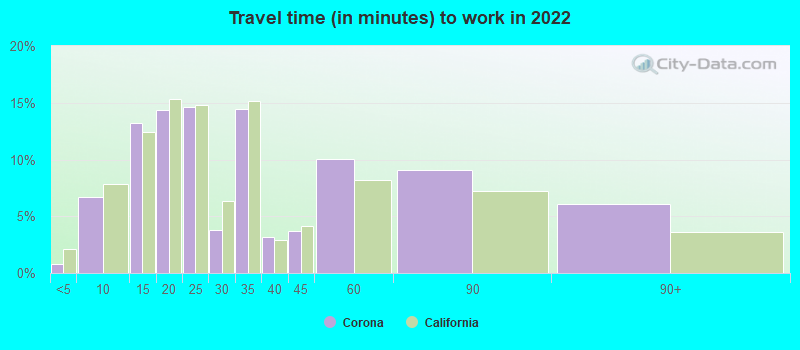
Average travel time to work
Type
Anaheim
Corona
Average
30.8 min
32 min
Other means
28.1 min
36.9 min
Public transportation
47.8 min
55.6 min
Private vehicle occupancy
Type
Anaheim
Corona
Average
1.2
1.1
Drove alone
85.3%
90.9%
In 2 person carpool
11.2%
6.3%
In 3 person carpool
1.8%
1.9%
In 4 person carpool
0.8%
0.3%
In 5-6 person carpool
0.9%
0.4%
In 7+ person carpool
0%
0.1%
How many people usually rode to work in the car, truck or van.
Real Estate
Anaheim offers a mix of residential properties from high-end to affordable homes. Corona, on the other hand, is known for its affordable housing options compared to much of the state, with a mix of condos, townhouses, and single-family homes.
Neighborhoods
Anaheim has vibrant neighborhoods with a diverse population. The Platinum Triangle is a sought-after neighborhood adjacent to Angel Stadium and the Disneyland Resort. Corona is known for its friendly communities like Eagle Glen and Sierra Del Oro, each offering its unique charm.
Houses and residents
Type
Anaheim
Corona
Houses
110,319
50,613
Average household size (people)
3.4
3.4
Median year apartment built
1975
1989
Median year house/condo built
1970
1990
Length of stay in the house since moving in
14.8 years
13.7 years
Houses occupied
105,608 (95.7%)
48,905 (96.6%)
Houses occupied by owners
51,684 (48.9%)
30,461 (62.3%)
Houses occupied by renters
53,924 (51.1%)
18,444 (37.7%)
Median rent asked for vacant for-rent units
$2,111
$608.14
Median monthly housing costs
$1,910
$1,918
Median price asked for vacant for-sale houses and condos
$1,256,069
$479,674
Estimated median house or condo value
$688,400
$620,600
Median numbers of rooms
4.7
6
Median number of rooms in apartments
3.6
4.1
Median number of rooms in houses and condos
6.1
6.9
Median house price - detached houses
$859,592
$667,347
Median house price - in 2-unit structures
$742,035
$310,376
Median house price - in 3-to-4-unit structures
$546,946
$293,658
Median house price - in 5 or more unit structures
$553,561
$279,322
Median house price - mobile homes
$114,904
$146,143
Median house price - Townhouses or other attached units
$619,623
$451,067
Median house price - All housing units
$782,600
$623,919
Median house age
48
31
Renting percentage
51.5%
32.8%
Housing density (houses/condos per square mile)
2,254.1
1,440
House value disparities
20.2%
19.4%
Household income disparities
43.6%
39.1%
Median household income for houses/condes with a mortgage
$125,169
$118,249
Median household income for apartments without a mortgage
$86,779
$91,037
Housing units without a mortgage
374 (1%)
252 (1.1%)
Housing units with both a second mortgage and home equity loan
2,222 (6%)
1,280 (5.5%)
Housing units with a mortgage
36,875 (99%)
23,204 (98.9%)
Housing units with a home equity loan
0 (0%)
0 (0%)
Housing units with a second mortgage
2,794 (7.5%)
1,808 (7.7%)
House/condo owner moved in on average (years ago)
14
12
House/condo renter moved in on average (years ago)
4
4
Housing units lacking complete kitchen facilities
4.5%
1.6%
Housing units lacking complete plumbing facilities
0.1%
0.4%
Housing units in structures
Housing units in structures
Anaheim
Corona
One, detached
42.7%
67.4%
One, attached
8.3%
5.6%
Two
2.3%
0.7%
3 or 4
7.6%
4.8%
5 to 9
6.8%
6.0%
10 to 19
5.5%
4.9%
20 to 49
6.8%
2.1%
50 or more
17.2%
5.2%
Mobile homes
2.6%
3.3%
Boats, RVs, vans, etc.
0.1%
0.0%
Median real estate property taxes paid for housing units
Self-employed workers in own not incorporated business
11,077
5,276
State government workers
5,046
1,082
Unpaid family workers
65
0
Industries and Occupations
In Anaheim, the largest industries include arts, entertainment, and recreation, healthcare, and retail trade while the highest paying industries are utilities, information, and management. Corona, on the other hand, hosts a thriving healthcare sector, followed by manufacturing, retail trade, and education.
Both Anaheim and Corona are served by numerous modern healthcare facilities. Anaheim Regional Medical Center and CHOC Children's serve Anaheim, while Corona Regional Medical Center is prominent in Corona. Both cities have a large number of medical specialists, clinics, and health facilities for comprehensive healthcare.
Health (county statistics)
Type
Anaheim
Corona
General health status score of residents in this county from 1 (poor) to 5 (excellent)
Both cities enjoy well-developed infrastructure for residents and visitors. Anaheim, being a bigger city, presents grander scale amenities, including the Anaheim Convention Center and Angel Stadium. Corona highlights its small-town appeal with local parks, community centers, and its well-maintained historic downtown area.
Infrastructure
Type
Anaheim
Corona
Hospitals
22
5
TV stations
6
4
Bank branches located here
46
41
Bank institutions located here
19
17
Main business address for public companies
7
2
Drinking water stations with no reported violations in the past
1
1
Drinking water stations with reported violations in the past
HMDA - Conventional home purchase loans - Applications denied
Year
Anaheim
Corona
1999
914
549
2000
679
33
2001
632
78
2002
735
82
2003
1,047
943
2004
1,456
1,378
2005
1,965
1,900
2006
1,999
2,272
2007
1,230
1,270
2008
599
567
2009
378
242
Culture and Food
Anaheim boasts a rich cultural scene with its mix of global cultures, translating to a diverse food scene. Corona also presents a multi-cultural environment, albeit on a smaller scale. Corona's Historic Downtown offers local eateries, cafes, and small businesses that highlight local culture.
Sports Teams
Anaheim is home to professional sports teams like the Anaheim Ducks (NHL) and the Los Angeles Angels (MLB). Downtown Anaheim and nearby stadiums offer avid sports fans a wide array of games to attend. Corona, although it doesn’t host any major professional sports team, provides lots of facilities for local sports and outdoor activities.


 Anaheim, CA
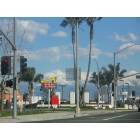
 Corona, CA