Anaheim and Tustin are both vibrant cities located in Orange County, California. Known for distinguished features like Disneyland in Anaheim and the strong public-school district in Tustin, these cities offer different atmospheres for both tourists and residents. Comparing the two, we’ll consider crime and safety, weather, living costs, education, economy, infrastructure and more. The aim is to give potential relocators a complete picture of each area.
Distance between
Anaheim, CA and
Tustin, CA : 8.0 miles
Anaheim's population is larger by 336%. Its population has grown by 17,926 people (5.5%) since 2000. The population of Tustin has grown by 11,926 people (17.7%) during that time.
While neither city is free from crime, Tustin maintains a safer environment overall compared to Anaheim. Anaheim has a crime rate higher than the national average, primarily due to being a high-tourist area with Disneyland and major sports arenas. Tustin, on the other hand, has a crime rate significantly lower than the national average providing a safer environment for residents and visitors.
City-data.com crime index counts serious crimes and violent crime more heavily. It adjusts for the number of visitors and daily workers commuting into cities. (higher means more crime, U.S. average = 301.1)
City-data.com crime index counts serious crimes and violent crime more heavily. It adjusts for the number of visitors and daily workers commuting into cities. (higher means more crime, U.S. average = 301.1)
Sex Offenders
According to our data, there are 550 registered sex offenders living in Anaheim and 52 registered sex offenders living in . The ratio of residents to sex offenders in Anaheim is 638 to 1; the ratio in Tustin is 1,547 to 1. The number of registered sex offenders compared to the number of residents is larger in Anaheim than in Tustin.
Cost of Living
Living in Anaheim is generally more expensive than Tustin, as it includes areas like Disneyland and encompasses a broader population base. That said, Tustin's cost of living is still above the national average due to its desirability, excellent school district and proximity to major work centers.
Income Tax
As in all of California, both Anaheim and Tustin residents are subject to state income tax, which varies from 1% to 13.3% based on income levels. There is no additional city income tax in either city.
Property Tax
Both Anaheim and Tustin have comparably high property tax rates, typically around 0.76% of a property's assessed fair market value. The rates can vary slightly between neighborhoods within each city.
Sales Tax
California’s statewide sales tax rate is 7.25%. Both Anaheim and Tustin impose an additional local sales tax. Anaheim city sales tax is 8.75% while Tustin's is at 7.75%.
Income
Type
Anaheim
Tustin
Estimated median household income
$81,747
$98,092
Estimated per capita income
$32,827
$45,734
Cost of living index (U.S. average is 100)
88.5
88.2
If you make $50,000 in Tustin, you will have to make $50,170 in Anaheim to maintain the same standard of living.
Geographical Conditions
Anaheim and Tustin share similar geographical attributes, with coastal plains and gentle rolling hills. Tustin, however, is closer to the Santa Ana Mountains and offers a bit more elevated terrain compared to Anaheim.
Tustin is home to an award-winning school district, highly rated by GreatSchools. The quality of education in Anaheim varies by neighborhood, with some schools performing exceptionally well. Notably, Anaheim offers more higher education opportunities with institutions like Anaheim University and North Orange County Community College District.
Anaheim's economy is largely driven by tourism, owing to sights like Disneyland Resort and Anaheim Convention Center, while Tustin’s economy relies on sectors like professional, scientific, and technical services. Anaheim has a higher unemployment rate compared to Tustin, but the average income in Anaheim is higher.
Biggest Employers
Disneyland Resort is Anaheim's largest employer, with other large organizations being the Anaheim Regional Medical Center and Angels Baseball LP. In Tustin, the major employers include the Tustin Unified School District, Rockwell Collins, and Ricoh Electronics.
There were 85 building permits issued in Anaheim in 2012 (44 more than in 2011) compared to 3 building permits issued in Tustin in 2012 (94 less than in 2011).
Weather
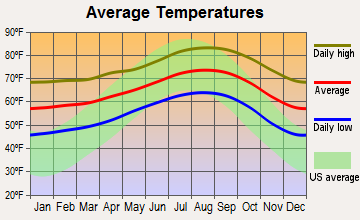
Both Anaheim and Tustin enjoy the same Mediterranean climate typical of Orange County, with warm summers and mild, wet winters. However, Anaheim, being slightly closer to the coast, might experience slightly cooler temperatures than Tustin. Both cities experience over 280 sunny days in a year, offering year-round outdoor opportunities.
Weather and climate
Type
Anaheim
Tustin
Temperature - Average
64.9°F
65°F
Humidity - Average morning or afternoon humidity
69.6%
69.6%
Humidity - Differences between morning and afternoon humidity
25.9%
25.8%
Humidity - Maximum monthly morning or afternoon humidity
77.9%
77.8%
Humidity - Minimum monthly morning or afternoon humidity
52%
52%
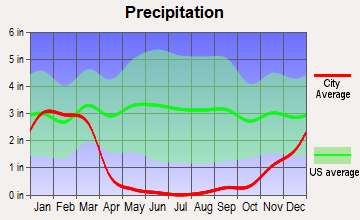
Precipitation - Yearly average
12 in
13.2 in
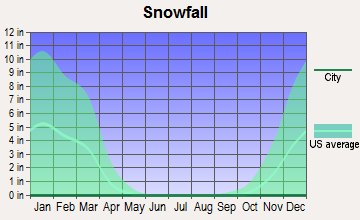
Snowfall - Yearly average
0 in
0 in
Clouds - Number of days clear of clouds
26.6%
26.6%
Sunshine amount - Average
78.4%
78.3%
Sunshine amount - Differences during a year
22%
21.9%
Sunshine amount - Maximum monthly
84.9%
84.7%
Sunshine amount - Minimum monthly
63%
62.8%
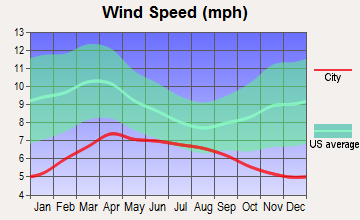
Wind speed - Average
5.7 mph
5.7 mph
Average climate in Anaheim, California
Average climate in Tustin, California
Air pollution
Type
AQI
CO
NO2
OZONE
PB
PM10
PM25
SO2
Year
Anaheim
Tustin
Anaheim
Tustin
Anaheim
Tustin
Anaheim
Tustin
Anaheim
Tustin
Anaheim
Tustin
Anaheim
Tustin
Anaheim
Tustin
2018
139
124
0.36
0.31
13.7
14.4
26.8
28.3
0.007
N/A
27.5
27.5
12.1
12.4
0.7
0.7
2017
145
129
0.50
0.33
14.8
14.3
26.7
29.8
0.007
N/A
26.7
26.7
13.5
13.6
0.6
0.5
2016
132
107
0.57
0.31
14.5
13.1
26.3
29.5
0.007
N/A
24.1
24.1
12.9
12.7
0.3
0.2
2015
142
128
0.45
0.28
14.7
13.9
26.0
29.6
0.007
N/A
25.0
25.0
14.8
14.6
0.3
0.2
2014
138
127
0.40
0.26
15.0
13.8
26.7
28.7
0.008
N/A
26.7
26.7
16.2
15.9
0.5
0.4
2013
138
123
0.47
0.32
14.8
14.5
25.3
27.6
0.005
0.003
28.3
28.9
13.9
14.0
0.5
0.3
2012
142
115
0.46
0.32
14.5
13.6
25.0
26.8
0.005
0.004
27.0
27.6
14.7
14.5
0.2
0.1
2011
138
120
0.42
0.30
15.9
15.5
26.7
27.3
0.007
0.006
27.4
27.5
16.0
15.9
0.8
0.7
2010
130
116
0.44
0.33
16.7
15.3
25.8
27.0
0.009
0.011
23.5
24.7
14.9
14.5
0.6
0.6
2009
151
136
0.41
0.33
18.0
16.7
26.0
28.0
0.010
0.009
24.4
25.9
15.4
14.8
1.1
1.1
2008
156
142
0.38
0.38
20.3
17.8
26.7
28.5
0.010
0.008
30.2
31.4
18.9
21.6
1.1
1.1
2007
135
121
0.38
0.36
19.5
17.6
26.2
27.3
0.012
0.010
N/A
N/A
N/A
N/A
0.8
0.8
2006
128
116
0.43
0.41
19.1
18.2
26.3
26.9
0.008
0.005
N/A
N/A
N/A
N/A
1.3
1.3
2005
128
117
0.45
0.41
20.7
19.0
31.3
27.9
0.013
0.011
N/A
N/A
N/A
N/A
1.3
1.3
2004
134
128
0.53
0.49
19.9
20.2
37.1
30.8
0.015
0.012
N/A
N/A
N/A
N/A
1.6
1.6
2003
143
139
0.69
0.62
23.7
23.2
23.8
27.8
0.025
0.046
N/A
N/A
N/A
N/A
1.1
1.1
2002
134
121
0.77
0.65
24.1
23.0
21.8
24.8
0.019
0.010
N/A
N/A
N/A
N/A
2.1
1.6
2001
143
119
0.94
0.75
28.4
23.5
24.5
24.7
0.035
0.011
N/A
N/A
N/A
N/A
1.7
1.4
2000
152
127
0.80
0.77
29.4
26.7
23.0
23.3
0.030
0.016
N/A
N/A
N/A
N/A
1.9
1.9
Natural disasters
Type
Anaheim
Tustin
Tornado activity compared to U.S. average
19.3%
19.1%
Earthquake activity compared to U.S. average
7,039.7%
6,959.7%
Natural disasters compared to U.S. average
32%
32%
Transportation
Both cities offer good public transit systems, but Anaheim offers more robust options due to its tourist attractions with the Anaheim Resort Transit (ART) and Metrolink services. Tustin provides OCTA bus services and Metrolink lines for commuting, along with bike-friendly routes throughout the city.
Transport
Type
Anaheim
Tustin
Amtrak stations
1
0
Amtrak stations nearby
3
3
FAA registered aircraft
136
53
FAA registered aircraft manufacturers and dealers
3
0
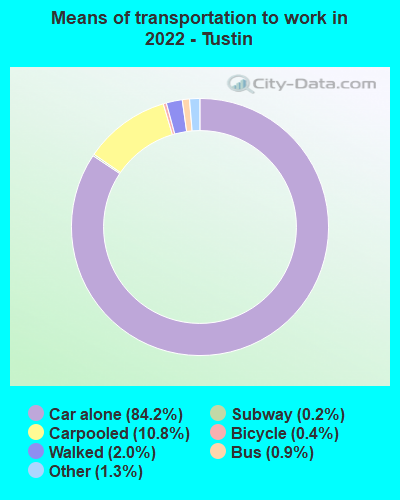
Means of transportation to work
Type
Anaheim
Tustin
Bicycle
1%
0.4%
Bus
0.9%
0.9%
Carpooled
10.8%
10.4%
Car alone
83.4%
85.5%
Motorcycle
0.2%
0.1%
Railroad
0.2%
0.3%
Subway
0.3%
0.2%
Walked
1.6%
1.5%
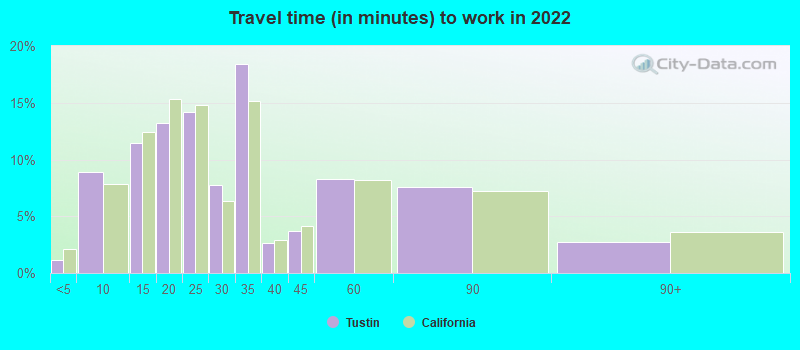
Average travel time to work
Type
Anaheim
Tustin
Average
30.8 min
28.6 min
Other means
28.1 min
23.4 min
Public transportation
47.8 min
49.3 min
Private vehicle occupancy
Type
Anaheim
Tustin
Average
1.2
1.2
Drove alone
85.3%
87.8%
In 2 person carpool
11.2%
8.6%
In 3 person carpool
1.8%
2.2%
In 4 person carpool
0.8%
0.7%
In 5-6 person carpool
0.9%
0.7%
How many people usually rode to work in the car, truck or van.
Real Estate
Real estate in Anaheim tends to be pricier due to tourist popularity and larger population. Tustin, while still expensive, offers a bit more affordability overall. While Tustin offers more suburban-style living, Anaheim offers a mix of urban and suburban home styles.
Neighborhoods
Anaheim has a diverse variety of neighborhoods from the chic, urban Anaheim Colony Historic District to tourist-heavy Disneyland area. Tustin offers quieter, more residential neighborhoods, such as Tustin Legacy and Tustin Ranch, known for their sense of community and suburban charm.
Houses and residents
Type
Anaheim
Tustin
Houses
110,319
27,550
Average household size (people)
3.4
3
Median year apartment built
1975
1978
Median year house/condo built
1970
1990
Length of stay in the house since moving in
14.8 years
13.3 years
Houses occupied
105,608 (95.7%)
26,762 (97.1%)
Houses occupied by owners
51,684 (48.9%)
13,530 (50.6%)
Houses occupied by renters
53,924 (51.1%)
13,232 (49.4%)
Median rent asked for vacant for-rent units
$2,111
$2,087
Median monthly housing costs
$1,910
$2,054
Median price asked for vacant for-sale houses and condos
$1,256,069
$253,305
Estimated median house or condo value
$688,400
$727,000
Median numbers of rooms
4.7
5
Median number of rooms in apartments
3.6
4.3
Median number of rooms in houses and condos
6.1
5.9
Median house price - detached houses
$859,592
Over $1,000,000
Median house price - in 3-to-4-unit structures
$546,946
$491,899
Median house price - in 5 or more unit structures
$553,561
$493,118
Median house price - mobile homes
$114,904
$209,238
Median house price - Townhouses or other attached units
$619,623
$538,007
Median house price - All housing units
$782,600
$823,060
Median house age
48
41
Renting percentage
51.5%
49.2%
Housing density (houses/condos per square mile)
2,254.1
2,416.7
House value disparities
20.2%
24%
Household income disparities
43.6%
40.9%
Median household income for houses/condes with a mortgage
$125,169
$141,706
Median household income for apartments without a mortgage
$86,779
$87,829
Housing units without a mortgage
374 (1%)
388 (4.3%)
Housing units with both a second mortgage and home equity loan
2,222 (6%)
930 (10.3%)
Housing units with a mortgage
36,875 (99%)
8,627 (95.7%)
Housing units with a home equity loan
0 (0%)
133 (1.5%)
Housing units with a second mortgage
2,794 (7.5%)
1,126 (12.5%)
House/condo owner moved in on average (years ago)
14
13
House/condo renter moved in on average (years ago)
4
2
Housing units lacking complete kitchen facilities
4.5%
2.6%
Housing units in structures
Housing units in structures
Anaheim
Tustin
One, detached
42.7%
36.6%
One, attached
8.3%
16.2%
Two
2.3%
1.0%
3 or 4
7.6%
8.3%
5 to 9
6.8%
4.7%
10 to 19
5.5%
6.1%
20 to 49
6.8%
7.7%
50 or more
17.2%
14.6%
Mobile homes
2.6%
4.8%
Boats, RVs, vans, etc.
0.1%
0.0%
Median real estate property taxes paid for housing units
Self-employed workers in own not incorporated business
11,077
2,567
State government workers
5,046
1,251
Unpaid family workers
65
0
Industries and Occupations
Tustin predominantly has jobs in information technology, healthcare, and retail which align well with the city’s key industries. Anaheim, however, has more diverse job opportunities due to its tourism-based economy, including hospitality, retail, service, and entertainment.
Health diagnosing and treating practitioners and other technical occupations
4.2%
11.0%
Building and grounds cleaning and maintenance occupations
4.2%
4.0%
Health technologists and technicians
3.6%
1.7%
Community and social service occupations
2.2%
1.8%
Material moving occupations
2.0%
1.7%
Computer and mathematical occupations
1.4%
2.3%
Arts, design, entertainment, sports, and media occupations
1.3%
1.6%
Life, physical, and social science occupations
1.3%
1.5%
Architecture and engineering occupations
0.9%
1.3%
Legal occupations
0.8%
2.6%
Transportation occupations
0.8%
1.2%
Health Care
Anaheim has comprehensive healthcare facilities, with large medical centers like Anaheim Regional Medical Center and Kaiser Permanente Anaheim Medical Center. Tustin has smaller healthcare facilities mainly centered around primary care and specialty clinics, but its residents can easily access large hospitals in nearby areas, including those in Anaheim.
Anaheim boasts better-established infrastructure due to its tourist industry, with features like the ARTIC transportation hub, Anaheim Convention Center, and Disneyland Resort. Tustin, although smaller, prides itself on good infrastructure too, with several parks, a modern library, and well-maintained public facilities.
HMDA - Conventional home purchase loans - Applications denied
Year
Anaheim
Tustin
1999
914
219
2000
679
91
2001
632
63
2002
735
67
2003
1,047
239
2004
1,456
389
2005
1,965
477
2006
1,999
448
2007
1,230
436
2008
599
164
2009
378
90
Culture and Food
Anaheim thrives in cultural diversity and offers a wide range of cuisines, thanks to its tourism industry. The city hosts annual events like Anaheim Fall Festival and Halloween Parade. Tustin, while quieter, provides a charming Old Town with boutique shops and art galleries, and it hosts popular events like the Tustin Tiller Days.
Sports Teams
Anaheim is home to major sports teams like the Anaheim Ducks (NHL) and Los Angeles Angels (MLB). Tustin, being a smaller city, doesn’t host any professional sports teams, but maintains active community sports programs in various age groups.


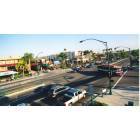
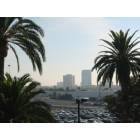


 Anaheim, CA
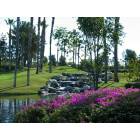
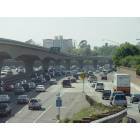
 Tustin, CA