Choosing between Arlington and Grand Prairie, two vibrant cities in Texas, can be quite a task. They are both unique in their own ways, with distinctive features and benefits. Both cities offer considerable opportunities for individuals contemplating resettlement or tourists exploring new locations. This analysis will cover various aspects of these cities to provide a holistic comparison, with a focus on crime and safety, weather, cost of living, education, work and economy, and many more attributes.
Distance between
Arlington, TX and
Grand Prairie, TX : 6.2 miles
Arlington's population is larger by 99%. Its population has grown by 59,817 people (18.0%) since 2000. The population of Grand Prairie has grown by 69,920 people (54.9%) during that time.
Arlington has a slightly higher crime rate relative to Grand Prairie. While neither city is crime-free, Arlington residents tend to report more incidents of both violent and property crimes. Grand Prairie, on the other hand, boasts lower crime rates than the national average, making it a safer pick between the two. It's advisable for tourists and new residents to involve themselves with local neighborhood watch programs and stay informed about their area's safety.
City-data.com crime index counts serious crimes and violent crime more heavily. It adjusts for the number of visitors and daily workers commuting into cities. (higher means more crime, U.S. average = 301.1)
City-data.com crime index counts serious crimes and violent crime more heavily. It adjusts for the number of visitors and daily workers commuting into cities. (higher means more crime, U.S. average = 301.1)
Sex Offenders
According to our data, there are 595 registered sex offenders living in Arlington and 258 registered sex offenders living in . The ratio of residents to sex offenders in Arlington is 660 to 1; the ratio in Grand Prairie is 739 to 1. The number of registered sex offenders compared to the number of residents in Arlington is near to than in Grand Prairie.
Cost of Living
In terms of affordability, Grand Prairie edges out Arlington. Though both cities have a lower cost of living than the national average, it's slightly cheaper to live in Grand Prairie, particularly concerning housing costs. For people looking to relocate or for tourists aiming for an extended stay, Grand Prairie might be the more economical choice.
Income Tax
Texas is one of the few states that do not levy state income tax. This advantage applies to both Arlington and Grand Prairie. This tax advantage can significantly boost residents' disposable income, contributing to the quality of life in both cities.
Property Tax
Property taxes in both cities are higher than the national average. Arlington's property tax rate is slightly higher than Grand Prairie's. Potential homeowners should take this into consideration when calculating the total cost of owning a home in either city.
Sales Tax
Both Arlington and Grand Prairie have the same sales tax rate of 8.25%, which is also the highest possible rate in Texas. The rate is the combined result of the Texas state rate of 6.25% and the cities' additional rates. This persisting uniformity makes the cities fare evenly when considered from a taxation perspective.
Income
Type
Arlington
Grand Prairie
Estimated median household income
$59,889
$68,473
Estimated per capita income
$31,722
$28,698
Cost of living index (U.S. average is 100)
95.9
94.9
If you make $50,000 in Grand Prairie, you will have to make $50,527 in Arlington to maintain the same standard of living.
Geographical Conditions
Geographically, Arlington and Grand Prairie are quite flat, with no significant elevations. Both are part of the larger Dallas-Fort Worth Metroplex and are connected by Interstate 30. Each city has its charms, with Arlington having more park space and Grand Prairie featuring a beautiful lakefront.
Both Grand Prairie and Arlington value education, providing a variety of educational opportunities. Arlington, however, has a higher percentage of residents with a Bachelor's degree or higher, compared to Grand Prairie. It's also home to the University of Texas at Arlington, offering students a wider range of degree programs and research opportunities.
Arlington has a robust economy with a higher median household income than Grand Prairie. It typically boasts a lower unemployment rate, whereas, in Grand Prairie, the job market has been slightly slower over recent years. Workers in both cities are employed in a variety of sectors, with health care, retail, and education being the most notable.
Biggest Employers
In Arlington, the biggest employers are Texas Health Resources, Arlington Independent School District, and The University of Texas at Arlington. In Grand Prairie, Lockheed Martin, Grand Prairie Independent School District, and Poly-America are the major employers. Both cities can provide ample job opportunities in various sectors.
There were 976 building permits issued in Arlington in 2012 (744 more than in 2011) compared to 1,233 building permits issued in Grand Prairie in 2012 (887 more than in 2011).
In Arlington (Tarrant County), 41.4% voted for Democrats and 57.1% for Republicans in 2012 Presidential Election. In Grand Prairie (Dallas County), 57.3% voted for Democrats and 41.8% for Republicans.
Elections
Type
Democrats
Republicans
Other
Year
Arlington
Grand Prairie
Arlington
Grand Prairie
Arlington
Grand Prairie
2020
49.3%
65.1%
49.1%
33.4%
1.6%
1.4%
2016
43.2%
60.8%
51.8%
34.7%
5.0%
4.5%
2012
41.4%
57.3%
57.1%
41.8%
1.4%
1.0%
2008
43.8%
57.4%
55.5%
42.0%
0.7%
0.6%
2004
37.0%
49.0%
62.5%
50.4%
0.5%
0.5%
2000
36.9%
45.0%
60.9%
52.7%
2.3%
2.4%
1996
41.6%
46.0%
50.9%
46.8%
7.5%
7.2%
Breakdown of population affiliated with a religious congregation
Type
Adherents
Congregations
Religion
Arlington
Grand Prairie
Arlington
Grand Prairie
SOUTHERN BAPTIST CONVENTION
17.3%
11.0%
33.3%
31.1%
CATHOLIC CHURCH
11.1%
18.9%
1.9%
2.4%
MUSLIM ESTIMATE
2.2%
3.6%
0.9%
1.1%
LUTHERAN CHURCH
0.5%
0.3%
0.9%
0.7%
SEVENTH DAY ADVENTIST CHURCH
0.4%
0.5%
1.6%
1.7%
EPISCOPAL CHURCH
0.3%
1.0%
0.8%
1.5%
EVANGELICAL LUTHERAN CHURCH IN AMERICA
0.3%
0.3%
0.9%
0.9%
Weather
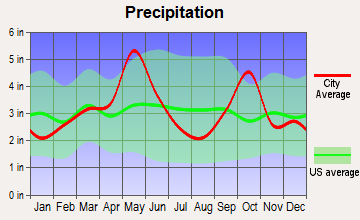
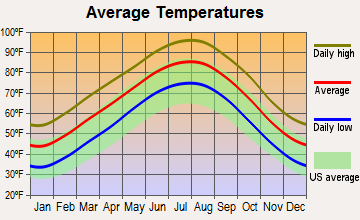
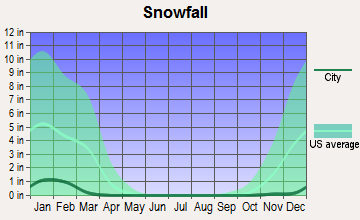
Both Arlington and Grand Prairie experience a similar weather pattern, featuring hot summers and mild winters. Average temperatures in summer can reach the mid-90s, while in winter, they fall to the low 40s. Both cities receive similar amounts of rainfall, with May typically being the wettest month. The nearly identical climates in both cities offer predictability for residents and visitors alike.
Weather and climate
Type
Arlington
Grand Prairie
Temperature - Average
65°F
65.6°F
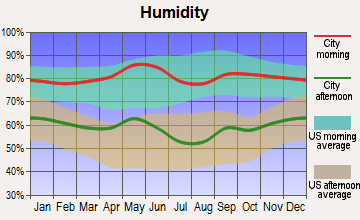
Humidity - Average morning or afternoon humidity
71.4%
71.3%
Humidity - Differences between morning and afternoon humidity
34%
34%
Humidity - Maximum monthly morning or afternoon humidity
82%
82%
Humidity - Minimum monthly morning or afternoon humidity
48%
48%
Precipitation - Yearly average
37.9 in
37.5 in
Snowfall - Yearly average
4.2 in
4.2 in
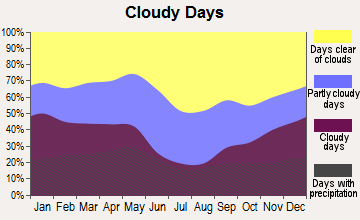
Clouds - Number of days clear of clouds
22.7%
22.7%
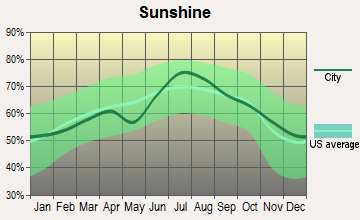
Sunshine amount - Average
66.6%
66.6%
Sunshine amount - Differences during a year
20%
20%
Sunshine amount - Maximum monthly
74%
74%
Sunshine amount - Minimum monthly
54%
54%
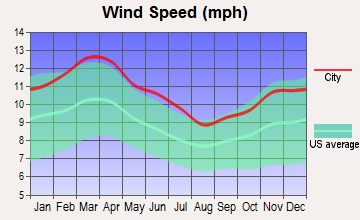
Wind speed - Average
10.3 mph
10.3 mph
Average climate in Arlington, Texas
Average climate in Grand Prairie, Texas
Air pollution
Type
AQI
CO
NO2
OZONE
PM25
SO2
Year
Arlington
Grand Prairie
Arlington
Grand Prairie
Arlington
Grand Prairie
Arlington
Grand Prairie
Arlington
Grand Prairie
Arlington
Grand Prairie
2018
86
86
N/A
N/A
5.8
5.8
27.1
27.7
9.4
9.5
0.4
0.4
2017
86
86
N/A
N/A
6.2
5.9
27.2
27.7
9.1
9.1
0.3
0.3
2016
76
76
N/A
N/A
6.3
6.2
25.5
26.1
8.2
8.3
0.2
0.2
2015
80
80
N/A
N/A
6.5
6.4
24.8
25.3
8.6
8.7
0.3
0.3
2014
78
78
0.22
0.22
6.8
6.6
26.6
26.9
9.3
9.5
0.3
0.3
2013
96
96
0.25
0.25
6.4
6.8
27.2
27.8
11.0
11.7
0.2
0.2
2012
108
108
0.26
0.26
7.8
8.1
30.3
30.4
10.5
11.0
0.3
0.3
2011
96
96
0.23
0.23
8.2
8.6
30.7
30.8
9.5
9.9
0.6
0.6
2010
76
76
0.23
0.23
8.9
9.0
27.7
28.0
8.4
8.4
0.7
0.7
2009
91
91
0.25
0.25
8.7
8.7
29.5
29.1
8.5
8.5
0.5
0.5
2008
92
92
0.25
0.25
9.6
9.6
25.8
26.7
10.7
10.7
0.5
0.5
2007
95
95
0.30
0.30
10.6
10.9
24.6
24.9
9.8
9.8
0.5
0.4
2006
102
102
0.34
0.34
10.4
10.6
29.7
30.0
9.9
9.9
0.8
0.8
2005
110
110
0.34
0.34
11.7
11.8
28.4
28.7
11.3
11.3
1.0
1.0
2004
90
90
0.39
0.39
10.8
11.4
25.4
25.3
N/A
N/A
0.9
0.9
2003
97
97
0.40
0.40
11.1
11.8
27.2
26.9
N/A
N/A
1.0
1.0
2002
97
97
0.37
0.37
11.8
12.5
25.8
25.5
N/A
N/A
0.6
0.5
2001
88
88
0.48
0.48
14.7
14.9
25.0
24.6
N/A
N/A
1.1
1.1
2000
104
104
0.55
0.55
14.5
14.5
26.2
25.8
N/A
N/A
1.3
1.2
Natural disasters
Type
Arlington
Grand Prairie
Tornado activity compared to U.S. average
254.3%
254.9%
Earthquake activity compared to U.S. average
558.3%
559%
Natural disasters compared to U.S. average
23%
21%
Transportation
Arlington is known for its extensive road network and has excellent accessibility to Dallas and Fort Worth. It does not have a public transit system, relying mostly on personal vehicles and rideshares. Grand Prairie, meanwhile, is served by the Dallas Area Rapid Transit (DART), providing public bus services around the city and to neighbouring locations.
Transport
Type
Arlington
Grand Prairie
Amtrak stations nearby
2
2
FAA registered aircraft
362
295
FAA registered aircraft manufacturers and dealers
5
2
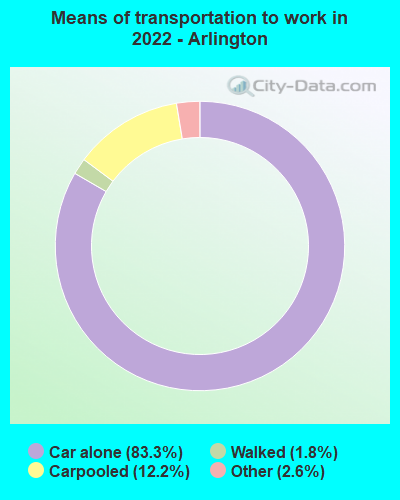
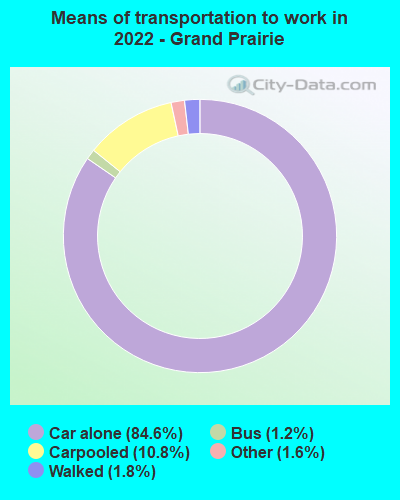
Means of transportation to work
Type
Arlington
Grand Prairie
Bicycle
0.2%
0.1%
Carpooled
11.9%
10.9%
Car alone
85%
86.7%
Motorcycle
0.1%
0.2%
Walked
1.4%
1.1%
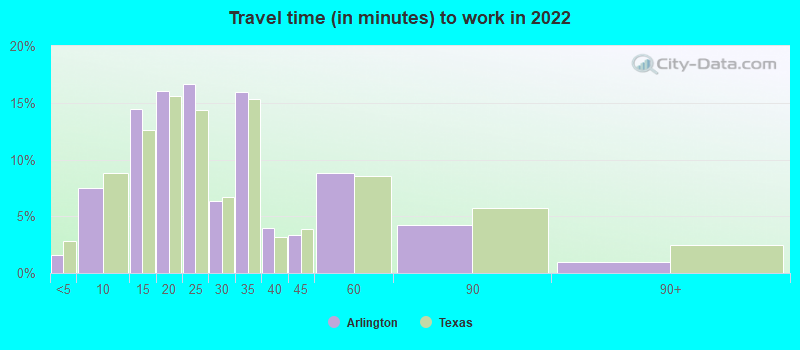
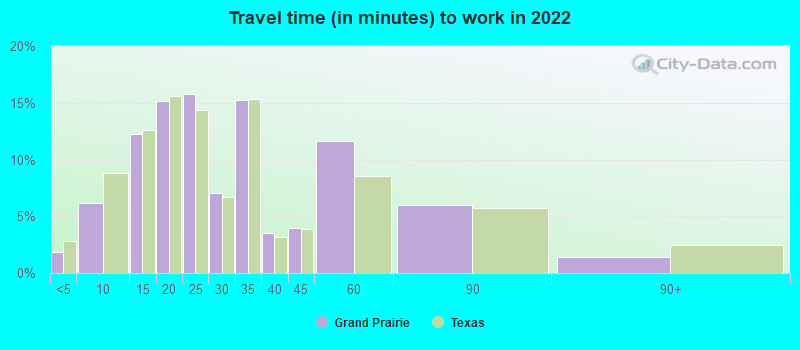
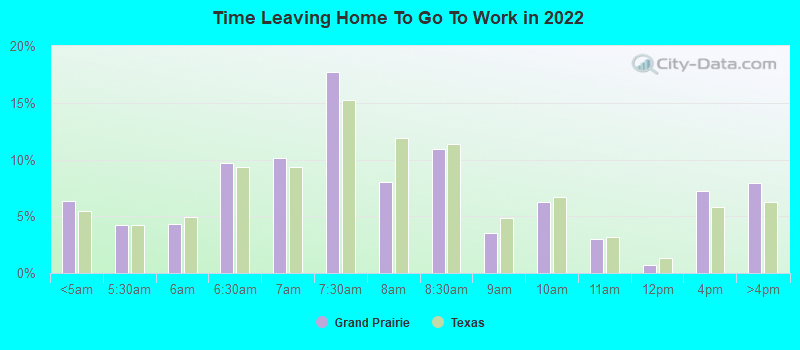
Average travel time to work
Type
Arlington
Grand Prairie
Average
26.1 min
29.4 min
Other means
27.6 min
28.7 min
Public transportation
45.1 min
44.2 min
Private vehicle occupancy
Type
Arlington
Grand Prairie
Average
1.2
1.2
Drove alone
88.7%
87.2%
In 2 person carpool
7.8%
8.5%
In 3 person carpool
2.2%
2%
In 4 person carpool
0.8%
1.3%
In 5-6 person carpool
0.4%
0.8%
In 7+ person carpool
0.1%
0.2%
How many people usually rode to work in the car, truck or van.
Real Estate
When it comes to the real estate market, Grand Prairie wins with more affordable housing options. In contrast, Arlington's housing market is relatively pricier, although it has seen a greater appreciation rate over the years. Depending upon an individual's preference and budget, one city may tip the scale over the other.
Neighborhoods
Both cities offer a variety of neighborhoods, each with distinctive features. Arlington's neighborhoods are more diverse, ranging from the bustling downtown area to the peaceful West Arlington. Grand Prairie’s neighborhoods are quieter, with some offering beautiful lake views. The choice depends largely on personal preferences and lifestyle.
Houses and residents
Type
Arlington
Grand Prairie
Houses
156,653
67,743
Average household size (people)
2.7
3
Median year apartment built
1983
1985
Median year house/condo built
1984
1989
Length of stay in the house since moving in
13 years
12.5 years
Houses occupied
146,888 (93.8%)
64,208 (94.8%)
Houses occupied by owners
78,883 (53.7%)
36,706 (57.2%)
Houses occupied by renters
68,005 (46.3%)
27,502 (42.8%)
Median rent asked for vacant for-rent units
$1,609
$1,139
Median monthly housing costs
$1,220
$1,304
Median price asked for vacant for-sale houses and condos
$199,415
$250,658
Estimated median house or condo value
$254,700
$242,200
Median numbers of rooms
5.4
5.3
Median number of rooms in apartments
4.1
4
Median number of rooms in houses and condos
6.5
6.3
Median house price - detached houses
$265,594
$231,122
Median house price - in 2-unit structures
$415,006
$164,926
Median house price - in 3-to-4-unit structures
$224,044
$106,305
Median house price - in 5 or more unit structures
$131,545
$207,441
Median house price - mobile homes
$92,300
$55,762
Median house price - occupied boats, rvs, vans etc.
$23,762
$90,660
Median house price - Townhouses or other attached units
$171,140
$174,772
Median house price - All housing units
$259,527
$223,459
Median house age
37
34
Renting percentage
42.6%
37.2%
Housing density (houses/condos per square mile)
1,634.9
948.7
House value disparities
25%
27.6%
Household income disparities
43.9%
41.6%
Median household income for houses/condes with a mortgage
$97,883
$104,593
Median household income for apartments without a mortgage
$67,452
$81,779
Housing units without a mortgage
948 (2%)
796 (3.4%)
Housing units with both a second mortgage and home equity loan
1,684 (3.6%)
746 (3.2%)
Housing units with a mortgage
46,456 (98%)
22,449 (96.6%)
Housing units with a home equity loan
0 (0%)
0 (0%)
Housing units with a second mortgage
1,967 (4.1%)
844 (3.6%)
House/condo owner moved in on average (years ago)
13
11
House/condo renter moved in on average (years ago)
1
1
Housing units lacking complete kitchen facilities
1.7%
1.3%
Housing units lacking complete plumbing facilities
1%
1%
Housing units in structures
Housing units in structures
Arlington
Grand Prairie
One, detached
60.2%
62.5%
One, attached
10.8%
8.1%
Two
1.5%
2.0%
3 or 4
4.3%
4.4%
5 to 9
5.7%
5.7%
10 to 19
7.7%
5.4%
20 to 49
3.3%
3.5%
50 or more
5.2%
5.8%
Mobile homes
1.3%
2.6%
Boats, RVs, vans, etc.
0.1%
0.0%
Median real estate property taxes paid for housing units
Self-employed workers in own not incorporated business
10,953
5,782
State government workers
6,771
1,914
Unpaid family workers
396
153
Industries and Occupations
Both cities are home to a variety of industries. In Arlington, the leading sectors are Educational Services, Health Care, and Social Assistance. Grand Prairie residents, on the other hand, mostly work in the Manufacturing sector. Both cities have a fair share of professionals, sales and office workers, and service providers.
Both Arlington and Grand Prairie have excellent healthcare facilities, with multiple hospitals and care centers. However, Arlington boasts more prominent healthcare institutions and a wider range of specialized services. For those in need of frequent medical services, Arlington might be a more suitable option.
Health (county statistics)
Type
Arlington
Grand Prairie
General health status score of residents in this county from 1 (poor) to 5 (excellent)
The infrastructure in Arlington is more developed compared to Grand Prairie. Arlington has numerous parks, sports facilities, shopping centers, and office spaces. Grand Prairie, while it has been catching up, still has a smaller overall infrastructure, but with continuous developments, it is improving.
Infrastructure
Type
Arlington
Grand Prairie
Hospitals
39
9
TV stations
25
25
Bank branches located here
74
20
Bank institutions located here
23
9
Main business address for public companies
2
2
Drinking water stations with no reported violations in the past
0
1
Drinking water stations with reported violations in the past
HMDA - Conventional home purchase loans - Applications denied
Year
Arlington
Grand Prairie
1999
1,768
759
2000
1,198
293
2001
1,140
181
2002
847
246
2003
1,216
621
2004
1,504
981
2005
2,158
1,569
2006
2,107
1,510
2007
1,390
1,022
2008
558
377
2009
235
147
Culture and Food
When it comes to culture and food, both cities offer a wealth of choices. Arlington has a more vibrant food scene and is known for its lively nightlife while Grand Prairie offers a mix of multicultural cuisines with a more laid-back environment. Both cities hold various cultural festivals and events throughout the year, catering to a diverse audience.
Sports Teams
Arlington is home to two major sports franchises, the Texas Rangers (MLB) and the Dallas Cowboys (NFL). The presence of these teams, along with the University of Texas at Arlington sports, lends Arlington a decidedly sports-centric atmosphere. Grand Prairie does not host any major sports teams but does offer a range of local sports events and activities.

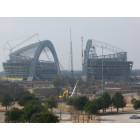


 Arlington, TX
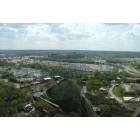
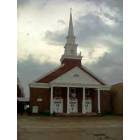
 Grand Prairie, TX