Austin and Brownsville are two diverse Texan cities, each with its unique appeal. Austin, the state's capital, is a booming high-tech city with a vibrant cultural scene and loved by homeowners and renters alike. Brownsville, on the U.S.-Mexico border, is a growing city with a lower cost of living and a strong connection to Hispanic culture. The following comparison touches on numerous aspects including crime/safety, weather, cost of living, education, work and economy, infrastructure, industries and occupations, major employers, real estate, neighborhoods, transportation, and city/state taxes, culture/food, sports teams, geographical conditions, and health care.
Distance between
Austin, TX and
Brownsville, TX : 302.4 miles
Austin's population is larger by 413%. Its population has grown by 307,615 people (46.9%) since 2000. The population of Brownsville has grown by 48,109 people (34.4%) during that time.
Overall, Austin crime rates are higher than Brownsville’s. However, it's important to note that crime rates can vary depending on the neighborhood. Both cities collaborate with local law enforcement to maintain safety for residents and tourists. Austin's larger population and crowded downtown area can contribute to its higher crime rate.
City-data.com crime index counts serious crimes and violent crime more heavily. It adjusts for the number of visitors and daily workers commuting into cities. (higher means more crime, U.S. average = 301.1)
City-data.com crime index counts serious crimes and violent crime more heavily. It adjusts for the number of visitors and daily workers commuting into cities. (higher means more crime, U.S. average = 301.1)
Sex Offenders
According to our data, there are 1,411 registered sex offenders living in Austin and 336 registered sex offenders living in . The ratio of residents to sex offenders in Austin is 672 to 1; the ratio in Brownsville is 546 to 1. The number of registered sex offenders compared to the number of residents in Austin is near to than in Brownsville.
Cost of Living
The cost of living in Austin is generally higher than in Brownsville in all aspects including housing, groceries, and health care. Brownsville offers a less expensive lifestyle, making it an attractive option for those looking for an affordable place to live in Texas.
Income Tax
Both cities benefit from Texas' lack of state income tax, making them attractive to those seeking tax-friendly residing places.
Property Tax
Property taxes in Austin are higher than in Brownsville.
Sales Tax
Both Austin and Brownsville share the same state sales tax rate of 6.25%. However, with local surtaxes, the final sales tax rate is 8.25% for Austin and 8.5% for Brownsville.
Income
Type
Austin
Brownsville
Estimated median household income
$79,542
$47,435
Estimated per capita income
$53,937
$19,429
Cost of living index (U.S. average is 100)
96.4
78.6
If you make $50,000 in Brownsville, you will have to make $61,323 in Austin to maintain the same standard of living.
Geographical Conditions
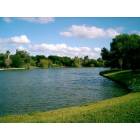
Austin is in the beautiful Texas Hill Country with numerous lakes and parks. Brownsville is located on the southern tip of Texas, right next to the Gulf of Mexico, and offers interesting coastal and bird-watching opportunities.
Both cities are served by public school districts and have additional higher education facilities. Austin is home to the prestigious University of Texas at Austin while Brownsville hosts the University of Texas Rio Grande Valley.
Austin's economy is booming, with a range of job opportunities in the tech, government, and education sectors. Brownsville's economy is solid, benefitting from its prime location at the border, thus providing numerous opportunities in trade, transportation, and manufacturing.
Biggest Employers
The State of Texas, University of Texas, and Dell Technologies are among Austin's largest employers. In Brownsville, the largest employers are the Brownsville Independent School District, the University of Texas Rio Grande Valley, and Walmart.
There were 4,180 building permits issued in Austin in 2012 (2467 more than in 2011) compared to 883 building permits issued in Brownsville in 2012 (272 more than in 2011).
In Austin (Travis County), 60.2% voted for Democrats and 36.2% for Republicans in 2012 Presidential Election. In Brownsville (Cameron County), 65.2% voted for Democrats and 34.1% for Republicans.
Elections
Type
Democrats
Republicans
Other
Year
Austin
Brownsville
Austin
Brownsville
Austin
Brownsville
2020
71.7%
56.1%
26.5%
43.0%
1.8%
0.9%
2016
65.8%
64.6%
27.2%
32.1%
7.0%
3.3%
2012
60.2%
65.2%
36.2%
34.1%
3.6%
0.7%
2008
63.8%
63.8%
34.4%
35.1%
1.8%
1.2%
2004
56.1%
49.2%
42.1%
50.4%
1.8%
0.4%
2000
41.7%
53.5%
47.0%
44.8%
11.3%
1.7%
1996
52.4%
61.8%
40.0%
32.6%
7.7%
5.6%
Breakdown of population affiliated with a religious congregation
Type
Adherents
Congregations
Religion
Austin
Brownsville
Austin
Brownsville
CATHOLIC CHURCH
17.3%
33.9%
4.5%
11.6%
SOUTHERN BAPTIST CONVENTION
8.0%
4.0%
22.8%
17.7%
EPISCOPAL CHURCH
1.4%
0.4%
2.8%
1.5%
MUSLIM ESTIMATE
1.2%
0.6%
0.7%
0.3%
EVANGELICAL LUTHERAN CHURCH IN AMERICA
1.0%
0.0%
2.5%
0.6%
LUTHERAN CHURCH
0.9%
0.3%
2.1%
1.8%
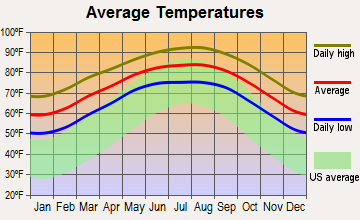
Weather
Both cities experience the typical hot, Texas weather but Brownsville, being closer to the Gulf of Mexico, tends to be warmer and more humid. Brownsville also has a longer warm season than Austin. Austin, being in the Hill Country, has more variance in its temperature throughout the year.
Weather and climate
Type
Austin
Brownsville
Temperature - Average
68.5°F
73.3°F
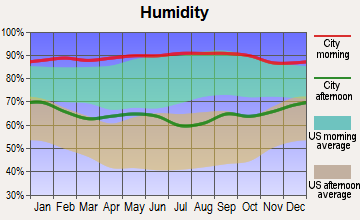
Humidity - Average morning or afternoon humidity
75.2%
81.1%
Humidity - Differences between morning and afternoon humidity
40%
37%
Humidity - Maximum monthly morning or afternoon humidity
89%
92%
Humidity - Minimum monthly morning or afternoon humidity
49%
55%
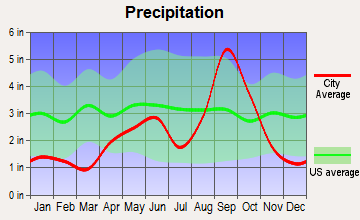
Precipitation - Yearly average
33.7 in
27.7 in
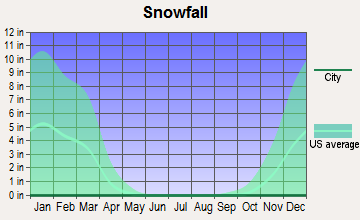
Snowfall - Yearly average
1.4 in
0 in
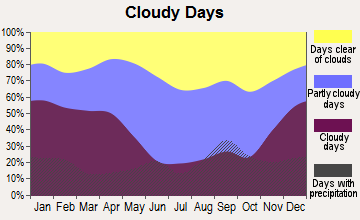
Clouds - Number of days clear of clouds
19.3%
16.1%
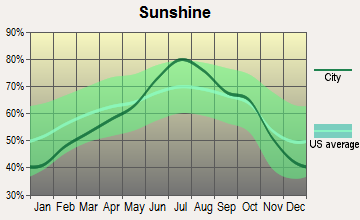
Sunshine amount - Average
63.3%
64.8%
Sunshine amount - Differences during a year
22%
42%
Sunshine amount - Maximum monthly
72%
80%
Sunshine amount - Minimum monthly
50%
38%
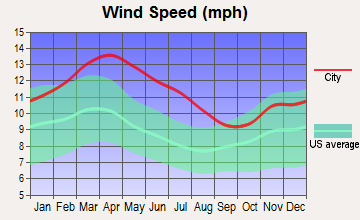
Wind speed - Average
7.2 mph
11.2 mph
Average climate in Austin, Texas
Average climate in Brownsville, Texas
Air pollution
Type
AQI
CO
NO2
OZONE
PB
PM10
PM25
SO2
Year
Austin
Brownsville
Austin
Austin
Austin
Brownsville
Brownsville
Brownsville
Austin
Brownsville
Austin
2018
76
74
N/A
N/A
4.9
N/A
26.7
23.7
N/A
N/A
N/A
N/A
8.7
10.3
0.2
N/A
2017
76
58
N/A
N/A
4.6
N/A
29.7
23.7
N/A
N/A
N/A
N/A
8.3
8.4
0.3
N/A
2016
71
77
N/A
N/A
4.2
N/A
29.5
22.9
N/A
N/A
N/A
N/A
8.2
9.1
0.2
N/A
2015
78
77
N/A
N/A
4.4
N/A
28.9
22.1
N/A
N/A
N/A
N/A
8.6
9.4
0.3
N/A
2014
74
75
N/A
N/A
5.2
N/A
28.3
23.6
N/A
N/A
N/A
N/A
8.7
9.4
0.5
N/A
2013
78
74
0.09
N/A
5.5
N/A
29.5
25.0
N/A
N/A
N/A
N/A
8.6
9.3
0.5
N/A
2012
86
71
0.13
N/A
5.5
N/A
30.1
26.1
N/A
N/A
23.1
N/A
8.6
10.6
N/A
N/A
2011
83
72
0.11
N/A
2.6
N/A
33.0
27.2
N/A
N/A
22.7
N/A
9.1
10.6
N/A
N/A
2010
77
78
0.05
N/A
3.2
N/A
29.4
27.2
N/A
N/A
19.7
N/A
8.8
10.0
N/A
N/A
2009
76
73
0.05
N/A
2.6
N/A
29.7
26.1
N/A
N/A
23.8
N/A
9.0
11.0
N/A
N/A
2008
81
77
0.12
N/A
3.2
N/A
30.7
25.4
0.004
N/A
22.7
N/A
9.7
11.5
N/A
N/A
2007
82
74
0.12
N/A
3.1
N/A
27.1
23.5
0.003
N/A
27.0
N/A
9.8
10.8
N/A
N/A
2006
89
79
0.14
N/A
3.8
N/A
31.3
25.6
0.004
N/A
33.4
N/A
10.0
10.8
0.2
N/A
2005
92
79
0.15
N/A
4.4
N/A
29.0
26.7
0.003
N/A
29.4
N/A
10.7
11.1
0.2
N/A
2004
74
69
0.16
N/A
3.3
N/A
26.8
24.0
0.004
N/A
31.7
N/A
N/A
N/A
N/A
N/A
2003
85
74
0.26
N/A
4.2
N/A
28.9
24.2
0.008
N/A
38.1
N/A
N/A
N/A
0.1
N/A
2002
83
76
0.33
N/A
3.9
N/A
27.2
24.9
0.008
N/A
37.5
N/A
N/A
N/A
N/A
N/A
2001
83
59
0.31
N/A
4.2
N/A
25.5
24.7
0.008
N/A
32.3
N/A
N/A
N/A
N/A
N/A
2000
86
48
0.28
N/A
4.7
N/A
27.8
23.6
0.009
N/A
N/A
N/A
N/A
N/A
N/A
N/A
Natural disasters
Type
Austin
Brownsville
Tornado activity compared to U.S. average
137.9%
18.3%
Earthquake activity compared to U.S. average
80.4%
17.2%
Natural disasters compared to U.S. average
29%
23%
Transportation
Austin has a more robust public transportation system featuring buses, trains, and bike-sharing programs. Brownsville's transportation options are more limited, but also include buses and a bike-sharing program.
Transport
Type
Austin
Brownsville
Amtrak stations
1
1
Amtrak stations nearby
1
1
FAA registered aircraft
911
60
FAA registered aircraft manufacturers and dealers
21
7
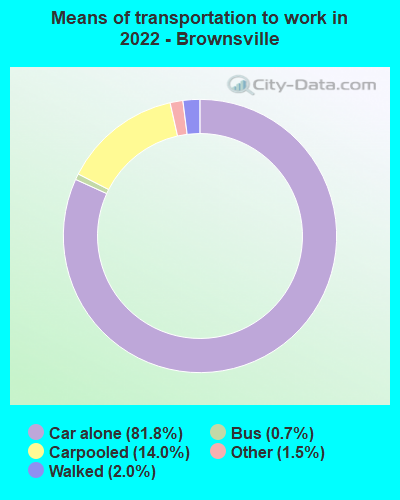
Means of transportation to work
Type
Austin
Brownsville
Bicycle
0.8%
0.1%
Bus
1.5%
0.7%
Carpooled
7.9%
9.6%
Car alone
85.9%
86.6%
Motorcycle
0.3%
0.1%
Taxicab
0.1%
0.1%
Walked
2%
1.7%
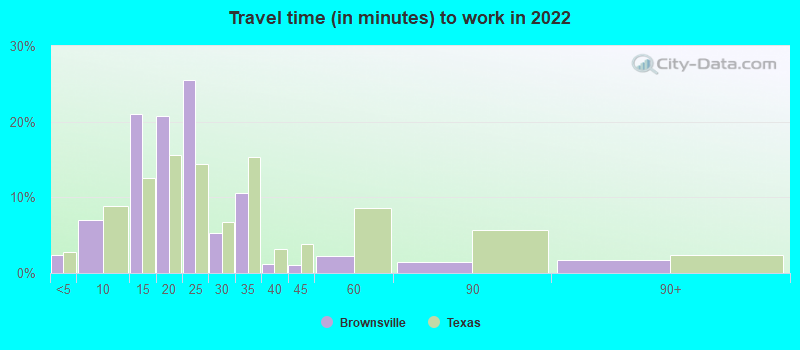
Average travel time to work
Type
Austin
Brownsville
Average
29.9 min
21.7 min
Other means
22.7 min
21 min
Public transportation
37.9 min
39.3 min
Private vehicle occupancy
Type
Austin
Brownsville
Average
1.1
1.2
Drove alone
91.2%
85.8%
In 2 person carpool
6.3%
9.8%
In 3 person carpool
1.7%
3.4%
In 4 person carpool
0.6%
0.4%
In 5-6 person carpool
0.1%
0.5%
In 7+ person carpool
0.2%
0.1%
How many people usually rode to work in the car, truck or van.
Real Estate
Real estate in Austin tends to be more expensive than in Brownsville due to the high demand, driven by its booming economy. Brownsville offers affordable housing options compared to other Texas cities.
Neighborhoods
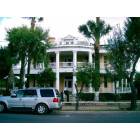
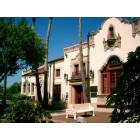
Austin and Brownsville both have diverse neighborhoods catering to various lifestyles. Austin neighborhoods range from vibrant downtown areas to serene hill country communities. Brownsville neighborhoods reflect its historical and cultural diversity.
Houses and residents
Type
Austin
Brownsville
Houses
469,156
62,000
Average household size (people)
2.4
3.5
Median year apartment built
1997
1990
Median year house/condo built
1988
1998
Length of stay in the house since moving in
12.1 years
14.2 years
Houses occupied
449,399 (95.8%)
56,522 (91.2%)
Houses occupied by owners
196,458 (43.7%)
34,440 (60.9%)
Houses occupied by renters
252,941 (56.3%)
22,082 (39.1%)
Median rent asked for vacant for-rent units
$1,286
$396.05
Median monthly housing costs
$1,521
$721
Median price asked for vacant for-sale houses and condos
$549,769
$221,063
Estimated median house or condo value
$482,900
$104,100
Median numbers of rooms
4.4
4.8
Median number of rooms in apartments
3.4
3.9
Median number of rooms in houses and condos
6
5.3
Median house price - detached houses
$595,996
$124,259
Median house price - in 2-unit structures
$393,984
Over $1,000,000
Median house price - in 3-to-4-unit structures
$262,826
$73,104
Median house price - in 5 or more unit structures
$576,111
$97,341
Median house price - mobile homes
$56,102
$47,840
Median house price - Townhouses or other attached units
$459,657
$133,815
Median house price - All housing units
$571,154
$130,508
Median house age
28
27
Renting percentage
54.9%
37.8%
Housing density (houses/condos per square mile)
1,865.3
771.1
House value disparities
28.4%
35.7%
Household income disparities
44.8%
46.1%
Median household income for houses/condes with a mortgage
$141,177
$74,174
Median household income for apartments without a mortgage
$86,430
$41,503
Housing units without a mortgage
1,799 (1.3%)
96 (0.7%)
Housing units with both a second mortgage and home equity loan
6,421 (4.8%)
172 (1.2%)
Housing units with a mortgage
132,628 (98.7%)
14,310 (99.3%)
Housing units with a home equity loan
206 (0.2%)
0 (0%)
Housing units with a second mortgage
8,515 (6.3%)
169 (1.2%)
House/condo owner moved in on average (years ago)
9
14
House/condo renter moved in on average (years ago)
1
1
Housing units lacking complete kitchen facilities
0.9%
2.8%
Housing units lacking complete plumbing facilities
0.6%
2.6%
Housing units in structures
Housing units in structures
Austin
Brownsville
One, detached
43.1%
72.1%
One, attached
5.2%
1.0%
Two
2.4%
3.6%
3 or 4
4.1%
6.5%
5 to 9
7.2%
2.5%
10 to 19
11.0%
2.4%
20 to 49
8.9%
3.4%
50 or more
17.2%
4.0%
Mobile homes
1.0%
4.4%
Boats, RVs, vans, etc.
0.0%
0.2%
Median real estate property taxes paid for housing units
Self-employed workers in own not incorporated business
38,777
4,372
State government workers
46,229
1,984
Unpaid family workers
102
261
Industries and Occupations
Austin is a growing tech hub in Texas, employing many in technology and related fields. Brownsville, due to its strategic location, has a concentration of occupations related to transportation, warehousing, and international trade.
Austin has more extensive health care facilities with multiple hospitals and specialty centers. Brownsville, while it has fewer facilities, offers essential healthcare through its hospitals and health centers.
Austin's infrastructure is more developed with efficient public transit and a highly-rated airport. Brownsville, though smaller, is catching up with ongoing infrastructure development projects.
Infrastructure
Type
Austin
Brownsville
Hospitals
65
7
TV stations
20
12
Bank branches located here
264
40
Bank institutions located here
43
15
Drinking water stations with no reported violations in the past
46
1
Drinking water stations with reported violations in the past
HMDA - Conventional home purchase loans - Applications denied
Year
Austin
Brownsville
1999
4,733
489
2000
2,950
157
2001
2,038
124
2002
1,772
107
2003
2,213
364
2004
2,458
554
2005
3,121
685
2006
3,367
874
2007
2,560
612
2008
1,747
230
2009
1,067
105
Culture and Food
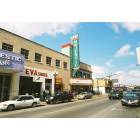
Austin is known for its lively music scene, diverse culinary options, and numerous cultural festivals. Brownsville showcases its rich Hispanic culture, unique border-town cuisine, and vibrant folklorico dancing.
Sports Teams
Austin is home to professional sports teams like Austin FC (MLS) and the Round Rock Express (MiLB). Brownsville, while it doesn't host major league teams, has a strong culture of local school sports.


 Austin, TX
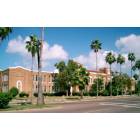
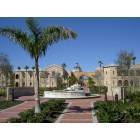
 Brownsville, TX