Austin and Grand Prairie, both diverse and vibrant locations in the Texas landscape, offer distinct experiences. Austin, the state capital, stands out with its thriving tech sector, vibrant music scene, and higher cost of living, making it appealing for young professionals. Conversely, Grand Prairie, nestled between Dallas and Fort Worth, has a family-friendly environment and lower cost of living, making it a more affordable locale. The choice between these two cities depends heavily on one's lifestyle and career goals.
Distance between
Austin, TX and
Grand Prairie, TX : 172.3 miles
Austin's population is larger by 389%. Its population has grown by 307,615 people (46.9%) since 2000. The population of Grand Prairie has grown by 69,920 people (54.9%) during that time.
Comparatively speaking, Austin's crime rate is slightly higher than Grand Prairie's. Although Austin is generally safe, some areas are more prone to crime, particularly non-violent thefts. In contrast, Grand Prairie's crime rate falls below the national average, contributing to its family-friendly reputation. Both cities have efficient policing systems, but prospective residents or tourists should be mindful of neighborhood safety levels.
City-data.com crime index counts serious crimes and violent crime more heavily. It adjusts for the number of visitors and daily workers commuting into cities. (higher means more crime, U.S. average = 301.1)
City-data.com crime index counts serious crimes and violent crime more heavily. It adjusts for the number of visitors and daily workers commuting into cities. (higher means more crime, U.S. average = 301.1)
Sex Offenders
According to our data, there are 1,428 registered sex offenders living in Austin and 258 registered sex offenders living in . The ratio of residents to sex offenders in Austin is 664 to 1; the ratio in Grand Prairie is 739 to 1. The number of registered sex offenders compared to the number of residents in Austin is near to than in Grand Prairie.
Cost of Living
When it comes to cost of living, Austin is significantly higher than Grand Prairie. Housing, in particular, is more costly in Austin due to increased demand and economic growth, especially from the booming tech sector. A big part of Grand Prairie's appeal is its affordability, particularly for families and those seeking to own homes.
Income Tax
As Texas cities, both Austin and Grand Prairie residents benefit from a lack of state income tax. This makes the overall tax burden lighter for residents, regardless of which city they choose to reside in.
Property Tax
Property taxes in both cities are high. Texas is one of the states with high property taxes, and it applies to both Austin and Grand Prairie. Residents should take this into consideration when moving to either city.
Sales Tax
Both cities have the same sales tax rate due to their location within Texas. Texas's state sales tax rate is 6.25%, and with added local city sales taxes, both Austin and Grand Prairie's total sales tax is 8.25%.
Income
Type
Austin
Grand Prairie
Estimated median household income
$79,542
$68,473
Estimated per capita income
$53,937
$28,698
Cost of living index (U.S. average is 100)
96.4
94.9
If you make $50,000 in Grand Prairie, you will have to make $50,790 in Austin to maintain the same standard of living.
Geographical Conditions
Austin’s geography includes hill country, lakes, and provides more in terms of outdoor activities. On the other hand, Grand Prairie is largely flat but is home to a large reservoir, Joe Pool Lake, a popular spot for outdoor activities.
Austin, housing the University of Texas, offers top-notch educational facilities and numerous renowned public and private schools. Grand Prairie also offers excellent education opportunities and includes a diverse range of schools, though it lacks a large university within the city bounds.
Austin, known as "Silicon Hills", is a hub for tech companies, startups, and entrepreneurs. The economy is booming, offering opportunities particularly in tech, education, healthcare and government sectors. Meanwhile, Grand Prairie's economy is steady, with a strong focus on industries like aerospace, retail, manufacturing, and logistics.
Biggest Employers
Austin's biggest employers include Dell, IBM, and the University of Texas which employs a big chunk of the city's population. On the other hand, Grand Prairie's economy is driven by employers like Lockheed Martin, Poly-America, and the Grand Prairie Independent School District.
There were 4,180 building permits issued in Austin in 2012 (2467 more than in 2011) compared to 1,233 building permits issued in Grand Prairie in 2012 (887 more than in 2011).
In Austin (Travis County), 60.2% voted for Democrats and 36.2% for Republicans in 2012 Presidential Election. In Grand Prairie (Dallas County), 57.3% voted for Democrats and 41.8% for Republicans.
Elections
Type
Democrats
Republicans
Other
Year
Austin
Grand Prairie
Austin
Grand Prairie
Austin
Grand Prairie
2020
71.7%
65.1%
26.5%
33.4%
1.8%
1.4%
2016
65.8%
60.8%
27.2%
34.7%
7.0%
4.5%
2012
60.2%
57.3%
36.2%
41.8%
3.6%
1.0%
2008
63.8%
57.4%
34.4%
42.0%
1.8%
0.6%
2004
56.1%
49.0%
42.1%
50.4%
1.8%
0.5%
2000
41.7%
45.0%
47.0%
52.7%
11.3%
2.4%
1996
52.4%
46.0%
40.0%
46.8%
7.7%
7.2%
Breakdown of population affiliated with a religious congregation
Type
Adherents
Congregations
Religion
Austin
Grand Prairie
Austin
Grand Prairie
CATHOLIC CHURCH
17.3%
18.9%
4.5%
2.4%
SOUTHERN BAPTIST CONVENTION
8.0%
11.0%
22.8%
31.1%
EPISCOPAL CHURCH
1.4%
1.0%
2.8%
1.5%
MUSLIM ESTIMATE
1.2%
3.6%
0.7%
1.1%
EVANGELICAL LUTHERAN CHURCH IN AMERICA
1.0%
0.3%
2.5%
0.9%
LUTHERAN CHURCH
0.9%
0.3%
2.1%
0.7%
SEVENTH DAY ADVENTIST CHURCH
0.2%
0.5%
1.0%
1.7%
Weather
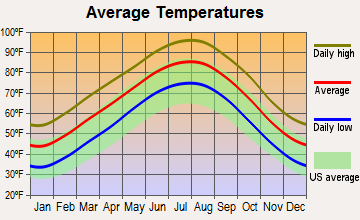
Both Austin and Grand Prairie share typical Texan weather, with long, hot summers and mild winters. However, Austin is slightly warmer overall due to its location further south. Both cities can experience unpredictable weather and occasional severe storms as part of Texas' unpredictable climatic conditions.
Weather and climate
Type
Austin
Grand Prairie
Temperature - Average
68.5°F
65.6°F
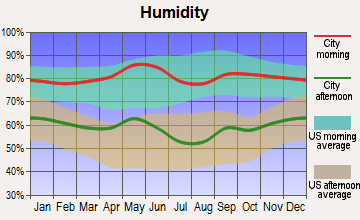
Humidity - Average morning or afternoon humidity
75.2%
71.3%
Humidity - Differences between morning and afternoon humidity
40%
34%
Humidity - Maximum monthly morning or afternoon humidity
89%
82%
Humidity - Minimum monthly morning or afternoon humidity
49%
48%
Precipitation - Yearly average
33.7 in
37.5 in
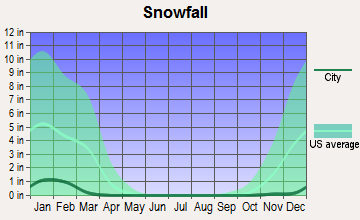
Snowfall - Yearly average
1.4 in
4.2 in
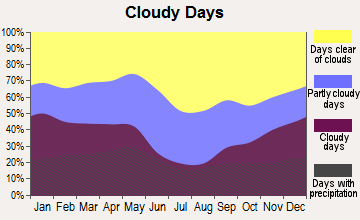
Clouds - Number of days clear of clouds
19.3%
22.7%
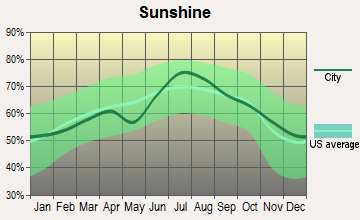
Sunshine amount - Average
63.3%
66.6%
Sunshine amount - Differences during a year
22%
20%
Sunshine amount - Maximum monthly
72%
74%
Sunshine amount - Minimum monthly
50%
54%
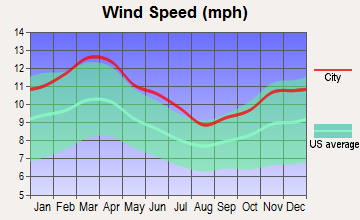
Wind speed - Average
7.2 mph
10.3 mph
Average climate in Austin, Texas
Average climate in Grand Prairie, Texas
Air pollution
Type
AQI
CO
NO2
OZONE
PM25
SO2
Year
Austin
Grand Prairie
Austin
Grand Prairie
Austin
Grand Prairie
Austin
Grand Prairie
Austin
Grand Prairie
Austin
Grand Prairie
2018
76
86
N/A
N/A
4.9
5.8
26.7
27.7
8.7
9.5
0.2
0.4
2017
76
86
N/A
N/A
4.6
5.9
29.7
27.7
8.3
9.1
0.3
0.3
2016
71
76
N/A
N/A
4.2
6.2
29.5
26.1
8.2
8.3
0.2
0.2
2015
78
80
N/A
N/A
4.4
6.4
28.9
25.3
8.6
8.7
0.3
0.3
2014
74
78
N/A
0.22
5.2
6.6
28.3
26.9
8.7
9.5
0.5
0.3
2013
78
96
0.09
0.25
5.5
6.8
29.5
27.8
8.6
11.7
0.5
0.2
2012
86
108
0.13
0.26
5.5
8.1
30.1
30.4
8.6
11.0
N/A
0.3
2011
83
96
0.11
0.23
2.6
8.6
33.0
30.8
9.1
9.9
N/A
0.6
2010
77
76
0.05
0.23
3.2
9.0
29.4
28.0
8.8
8.4
N/A
0.7
2009
76
91
0.05
0.25
2.6
8.7
29.7
29.1
9.0
8.5
N/A
0.5
2008
81
92
0.12
0.25
3.2
9.6
30.7
26.7
9.7
10.7
N/A
0.5
2007
82
95
0.12
0.30
3.1
10.9
27.1
24.9
9.8
9.8
N/A
0.4
2006
89
102
0.14
0.34
3.8
10.6
31.3
30.0
10.0
9.9
0.2
0.8
2005
92
110
0.15
0.34
4.4
11.8
29.0
28.7
10.7
11.3
0.2
1.0
2004
74
90
0.16
0.39
3.3
11.4
26.8
25.3
N/A
N/A
N/A
0.9
2003
85
97
0.26
0.40
4.2
11.8
28.9
26.9
N/A
N/A
0.1
1.0
2002
83
97
0.33
0.37
3.9
12.5
27.2
25.5
N/A
N/A
N/A
0.5
2001
83
88
0.31
0.48
4.2
14.9
25.5
24.6
N/A
N/A
N/A
1.1
2000
86
104
0.28
0.55
4.7
14.5
27.8
25.8
N/A
N/A
N/A
1.2
Natural disasters
Type
Austin
Grand Prairie
Tornado activity compared to U.S. average
137.9%
254.9%
Earthquake activity compared to U.S. average
80.4%
559%
Natural disasters compared to U.S. average
29%
21%
Transportation
Austin's public transportation system is robust but can be crowded, with commuters often facing traffic congestion. In Gran Prairie, public transit is limited, and residents often rely on their own cars. However, its location between Dallas and Fort Worth provides easy access to both cities.
Transport
Type
Austin
Grand Prairie
Amtrak stations
1
0
Amtrak stations nearby
1
2
FAA registered aircraft
911
295
FAA registered aircraft manufacturers and dealers
21
2
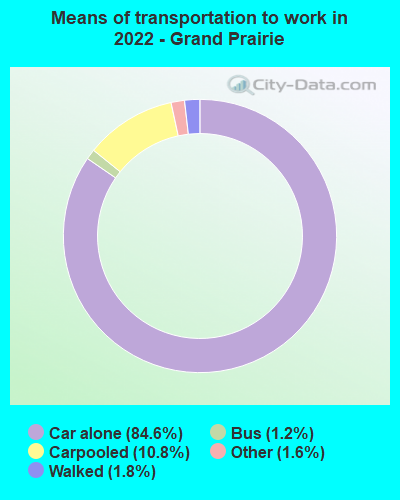
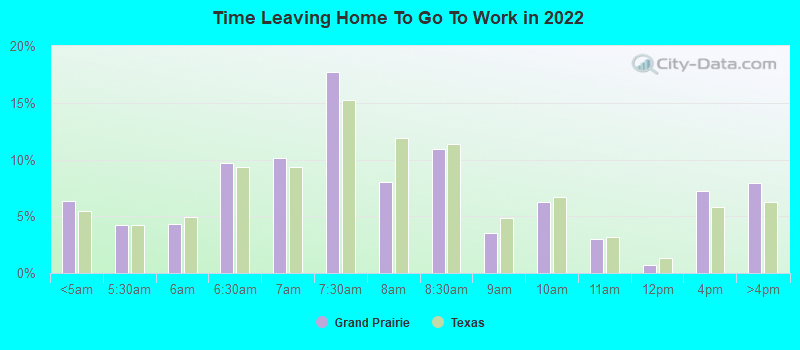
Means of transportation to work
Type
Austin
Grand Prairie
Bicycle
0.8%
0.1%
Bus
1.5%
0%
Carpooled
7.9%
10.9%
Car alone
85.9%
86.7%
Motorcycle
0.3%
0.2%
Taxicab
0.1%
0%
Walked
2%
1.1%
Average travel time to work
Type
Austin
Grand Prairie
Average
29.9 min
29.4 min
Other means
22.7 min
28.7 min
Public transportation
37.9 min
44.2 min
Private vehicle occupancy
Type
Austin
Grand Prairie
Average
1.1
1.2
Drove alone
91.2%
87.2%
In 2 person carpool
6.3%
8.5%
In 3 person carpool
1.7%
2%
In 4 person carpool
0.6%
1.3%
In 5-6 person carpool
0.1%
0.8%
In 7+ person carpool
0.2%
0.2%
How many people usually rode to work in the car, truck or van.
Real Estate
In Austin, real estate costs are steep, driven by high demand and limited supply, leading to a competitive market. Grand Prairie offers appealing affordability in real estate, with the median home price being significantly lower than in Austin.
Neighborhoods
Austin has vibrant and diverse neighborhoods, each with a unique charm, from hip East Austin to the family-friendly Circle C Ranch. Grand Prairie is home to peaceful, family-friendly neighborhoods like South Grand Prairie and Downtown, with high-rated schools and parks.
Houses and residents
Type
Austin
Grand Prairie
Houses
469,156
67,743
Average household size (people)
2.4
3
Median year apartment built
1997
1985
Median year house/condo built
1988
1989
Length of stay in the house since moving in
12.1 years
12.5 years
Houses occupied
449,399 (95.8%)
64,208 (94.8%)
Houses occupied by owners
196,458 (43.7%)
36,706 (57.2%)
Houses occupied by renters
252,941 (56.3%)
27,502 (42.8%)
Median rent asked for vacant for-rent units
$1,286
$1,139
Median monthly housing costs
$1,521
$1,304
Median price asked for vacant for-sale houses and condos
$549,769
$250,658
Estimated median house or condo value
$482,900
$242,200
Median numbers of rooms
4.4
5.3
Median number of rooms in apartments
3.4
4
Median number of rooms in houses and condos
6
6.3
Median house price - detached houses
$595,996
$231,122
Median house price - in 2-unit structures
$393,984
$164,926
Median house price - in 3-to-4-unit structures
$262,826
$106,305
Median house price - in 5 or more unit structures
$576,111
$207,441
Median house price - mobile homes
$56,102
$55,762
Median house price - Townhouses or other attached units
$459,657
$174,772
Median house price - All housing units
$571,154
$223,459
Median house age
28
34
Renting percentage
54.9%
37.2%
Housing density (houses/condos per square mile)
1,865.3
948.7
House value disparities
28.4%
27.6%
Household income disparities
44.8%
41.6%
Median household income for houses/condes with a mortgage
$141,177
$104,593
Median household income for apartments without a mortgage
$86,430
$81,779
Housing units without a mortgage
1,799 (1.3%)
796 (3.4%)
Housing units with both a second mortgage and home equity loan
6,421 (4.8%)
746 (3.2%)
Housing units with a mortgage
132,628 (98.7%)
22,449 (96.6%)
Housing units with a home equity loan
206 (0.2%)
0 (0%)
Housing units with a second mortgage
8,515 (6.3%)
844 (3.6%)
House/condo owner moved in on average (years ago)
9
11
House/condo renter moved in on average (years ago)
1
1
Housing units lacking complete kitchen facilities
0.9%
1.3%
Housing units lacking complete plumbing facilities
0.6%
1%
Housing units in structures
Housing units in structures
Austin
Grand Prairie
One, detached
43.1%
62.5%
One, attached
5.2%
8.1%
Two
2.4%
2.0%
3 or 4
4.1%
4.4%
5 to 9
7.2%
5.7%
10 to 19
11.0%
5.4%
20 to 49
8.9%
3.5%
50 or more
17.2%
5.8%
Mobile homes
1.0%
2.6%
Median real estate property taxes paid for housing units
Self-employed workers in own not incorporated business
38,777
5,782
State government workers
46,229
1,914
Unpaid family workers
102
153
Industries and Occupations
In Austin, the tech, education, healthcare and creative industries dominate, creating a wide range of job opportunities, especially for young professionals. Conversely, Grand Prairie's economy is heavily anchored in manufacturing, logistics, and retail, providing consistent job opportunities in these stable sectors.
Austin has some of Texas’ top hospitals, making it a hub for health care. The city’s growing population has led to an expansion of services. Grand Prairie’s healthcare scene is more modest, but its central location makes the major hospitals in both Dallas and Fort Worth easily accessible.
Health (county statistics)
Type
Austin
Grand Prairie
General health status score of residents in this county from 1 (poor) to 5 (excellent)
Austin boasts of robust infrastructure, featuring advanced tech facilities and a thriving downtown. With continuous development, Austin's infrastructure keeps improving, though it’s grappling with traffic congestion. Alternatively, Grand Prairie maintains basic but stable infrastructure with ongoing development projects to enhance the city's growth.
Infrastructure
Type
Austin
Grand Prairie
Hospitals
65
9
TV stations
20
25
Bank branches located here
264
20
Bank institutions located here
43
9
Main business address for public companies
44
2
Drinking water stations with no reported violations in the past
46
1
Drinking water stations with reported violations in the past
HMDA - Conventional home purchase loans - Applications denied
Year
Austin
Grand Prairie
1999
4,733
759
2000
2,950
293
2001
2,038
181
2002
1,772
246
2003
2,213
621
2004
2,458
981
2005
3,121
1,569
2006
3,367
1,510
2007
2,560
1,022
2008
1,747
377
2009
1,067
147
Culture and Food
Austin is renowned for its diverse culture, thriving art scene, live music, and a rich foodie tradition, especially in BBQ and Tex-Mex. Grand Prairie has a more localized culture and dining scene, which includes local festivals like the Main Street Fest and eclectic food options that reflect its diverse population.
Sports Teams
Austin, with its recent addition of Austin FC, has broken into the major league sports scene. Furthermore, the University of Texas’s sports teams draw significant attention. In Grand Prairie, there are no major league teams, but residents enjoy proximity to Dallas and Fort Worth, home to teams like the Dallas Cowboys and Texas Rangers.


 Austin, TX
 Grand Prairie, TX