This comparison highlights the differences and similarities between two energetic and growing cities: Austin, Texas, and Greensboro, North Carolina. It provides a comprehensive analysis, taking into account various factors such as crime rate, weather patterns, cost of living, and educational opportunities to help you understand what it would be like to either visit or relocate to these cities. While both cities offer unique experiences, this comparison can be a helpful resource in identifying which city aligns more closely with individual needs and preferences.
Distance between
Austin, TX and
Greensboro, NC : 1,108.7 miles
Austin's population is larger by 223%. Its population has grown by 307,615 people (46.9%) since 2000. The population of Greensboro has grown by 74,372 people (33.2%) during that time.
In comparison to Greensboro, Austin has a slightly lower crime rate. Both cities are working diligently to enhance safety measures, however. For tourists, both cities are generally safe, but common sense precautions should be taken, especially during the night and in less congested areas. It's advisable to keep an eye on personal belongings and be aware of one's surroundings at all times in both cities. However, safety can depend greatly on the specific neighborhood.
City-data.com crime index counts serious crimes and violent crime more heavily. It adjusts for the number of visitors and daily workers commuting into cities. (higher means more crime, U.S. average = 301.1)
City-data.com crime index counts serious crimes and violent crime more heavily. It adjusts for the number of visitors and daily workers commuting into cities. (higher means more crime, U.S. average = 301.1)
Sex Offenders
According to our data, there are 1,407 registered sex offenders living in Austin and 616 registered sex offenders living in . The ratio of residents to sex offenders in Austin is 674 to 1; the ratio in Greensboro is 466 to 1. The number of registered sex offenders compared to the number of residents is a smaller in Austin than in Greensboro.
Cost of Living
The cost of living in Austin is notably higher than in Greensboro, largely due to housing costs. Austin has experienced a surge in housing prices in recent years. Overall, someone relocating from Greensboro to Austin would likely need to factor in a substantial increase in living costs. However, this may be offset by higher wages as Austin has a more robust economy.
Income Tax
Texas, including Austin, does not have a state income tax. This can make it attractive to people with high incomes or retirees. North Carolina, however, imposes a flat state income tax rate of 5.25% as of 2021, applicable to Greensboro residents.
Property Tax
The average property tax rate in Austin is about 1.83% while in Greensboro, it's significantly lower at about 0.86%. Anyone considering buying a home should consider these rates.
Sales Tax
Austin has a combined city and state sales tax rate of 8.25%, including a 2% city sales tax. Greensboro, in contrast, has a combined city and state sales tax rate of 6.75%, with no specific city sales tax.
Income
Type
Austin
Greensboro
Estimated median household income
$79,542
$51,825
Estimated per capita income
$53,937
$32,208
Cost of living index (U.S. average is 100)
96.4
91.2
If you make $50,000 in Greensboro, you will have to make $52,851 in Austin to maintain the same standard of living.
Geographical Conditions
Austin's geography is defined by hill country, lakes, and the Colorado River, which provides numerous outdoor recreational opportunities. With its location in North Carolina's Piedmont region, Greensboro offers a more green, lush terrain with rolling hills and forests.
Both cities have a strong focus on education, with multiple highly regarded universities and colleges. Austin is home to the University of Texas, while Greensboro houses the University of North Carolina at Greensboro and North Carolina Agricultural and Technical State University. Both cities also have plentiful opportunities for primary and secondary education, with numerous public and private school options available.
Austin’s economy is brimming with tech companies and startups, with the city gaining the nickname "Silicon Hills". Conversely, Greensboro has a more diverse economic base with strong sectors in education, health care, and logistics. If you're in the tech industry, Austin may provide more opportunities, but Greensboro offers more variety in job industries.
Biggest Employers
In Austin, some of the biggest employers include the State of Texas, University of Texas at Austin, Dell, and the City of Austin. Greensboro's largest employers are Cone Health, Guilford County Schools, and the City of Greensboro.
There were 4,180 building permits issued in Austin in 2012 (2467 more than in 2011) compared to 529 building permits issued in Greensboro in 2012 (235 more than in 2011).
In Austin (Travis County), 60.2% voted for Democrats and 36.2% for Republicans in 2012 Presidential Election. In Greensboro (Guilford County), 57.8% voted for Democrats and 41.4% for Republicans.
Elections
Type
Democrats
Republicans
Other
Year
Austin
Greensboro
Austin
Greensboro
Austin
Greensboro
2020
71.7%
61.1%
26.5%
37.9%
1.8%
1.1%
2016
65.8%
58.0%
27.2%
38.1%
7.0%
3.9%
2012
60.2%
57.8%
36.2%
41.4%
3.6%
0.8%
2008
63.8%
58.9%
34.4%
40.5%
1.8%
0.5%
2004
56.1%
50.2%
42.1%
49.3%
1.8%
0.4%
2000
41.7%
48.6%
47.0%
50.8%
11.3%
0.7%
1996
52.4%
46.9%
40.0%
45.9%
7.7%
7.2%
Breakdown of population affiliated with a religious congregation
Type
Adherents
Congregations
Religion
Austin
Greensboro
Austin
Greensboro
CATHOLIC CHURCH
17.3%
3.6%
4.5%
1.0%
SOUTHERN BAPTIST CONVENTION
8.0%
9.6%
22.8%
16.5%
EPISCOPAL CHURCH
1.4%
1.2%
2.8%
1.5%
MUSLIM ESTIMATE
1.2%
0.8%
0.7%
0.7%
EVANGELICAL LUTHERAN CHURCH IN AMERICA
1.0%
0.8%
2.5%
2.2%
LUTHERAN CHURCH
0.9%
0.2%
2.1%
0.7%
INTERNA PENTECO HOLINESS CHURCH
0.2%
0.3%
1.5%
1.5%
SEVENTH DAY ADVENTIST CHURCH
0.2%
0.5%
1.0%
0.7%
Weather
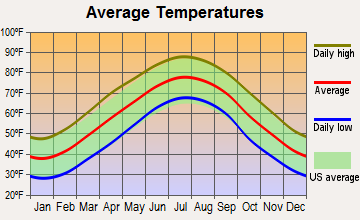
Austin experiences a hot, humid summer and mild winter, while Greensboro has a humid subtropical climate with hot, humid summers and cool to cold winters. Both cities are susceptible to severe weather, with Austin experiencing more heat and occasional hurricanes, and Greensboro experiencing occasional snow and ice storms in winter months. For those who prefer a sunny climate, Austin may be a better option, while those who prefer the beauty of four distinct seasons might find Greensboro more appealing.
Weather and climate
Type
Austin
Greensboro
Temperature - Average
68.5°F
58.4°F
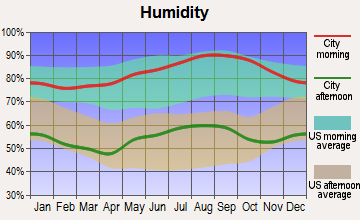
Humidity - Average morning or afternoon humidity
75.2%
72.8%
Humidity - Differences between morning and afternoon humidity
40%
42%
Humidity - Maximum monthly morning or afternoon humidity
89%
88%
Humidity - Minimum monthly morning or afternoon humidity
49%
46%
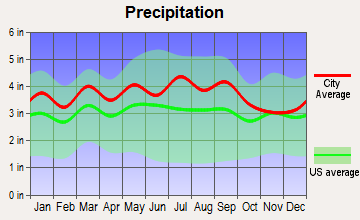
Precipitation - Yearly average
33.7 in
44.3 in
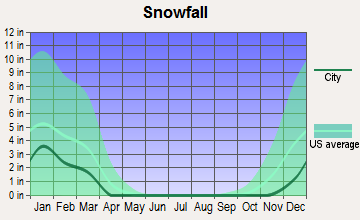
Snowfall - Yearly average
1.4 in
17 in
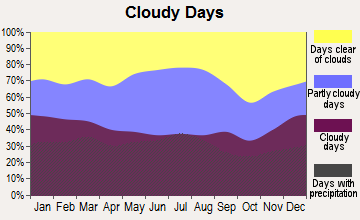
Clouds - Number of days clear of clouds
19.3%
18.3%
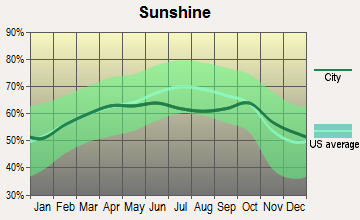
Sunshine amount - Average
63.3%
64.7%
Sunshine amount - Differences during a year
22%
10%
Sunshine amount - Maximum monthly
72%
64%
Sunshine amount - Minimum monthly
50%
54%
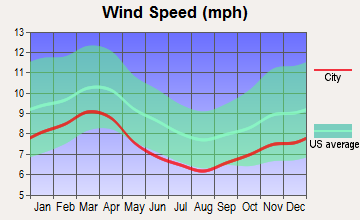
Wind speed - Average
7.2 mph
7.7 mph
Average climate in Austin, Texas
Average climate in Greensboro, North Carolina
Air pollution
Type
AQI
CO
NO2
OZONE
PM10
PM25
SO2
Year
Austin
Greensboro
Austin
Greensboro
Austin
Greensboro
Austin
Greensboro
Greensboro
Austin
Greensboro
Austin
Greensboro
2018
76
69
N/A
N/A
4.9
6.7
26.7
32.1
16.7
N/A
8.7
7.4
0.2
0.2
2017
76
71
N/A
N/A
4.6
7.0
29.7
29.1
11.9
N/A
8.3
7.9
0.3
0.3
2016
71
82
N/A
N/A
4.2
6.6
29.5
31.9
11.1
N/A
8.2
8.5
0.2
0.2
2015
78
74
N/A
N/A
4.4
6.8
28.9
28.8
12.3
N/A
8.6
8.2
0.3
0.3
2014
74
72
N/A
N/A
5.2
6.3
28.3
33.5
12.9
N/A
8.7
9.0
0.5
0.4
2013
78
74
0.09
N/A
5.5
6.0
29.5
28.5
12.0
N/A
8.6
8.3
0.5
0.3
2012
86
83
0.13
N/A
5.5
8.9
30.1
32.5
13.5
N/A
8.6
9.2
N/A
0.4
2011
83
84
0.11
N/A
2.6
7.5
33.0
34.7
14.8
N/A
9.1
9.9
N/A
1.0
2010
77
97
0.05
N/A
3.2
9.5
29.4
35.6
16.0
N/A
8.8
10.4
N/A
0.3
2009
76
81
0.05
N/A
2.6
13.3
29.7
30.4
14.2
N/A
9.0
9.9
N/A
3.9
2008
81
98
0.12
N/A
3.2
11.1
30.7
33.7
16.7
N/A
9.7
12.7
N/A
6.3
2007
82
102
0.12
N/A
3.1
11.1
27.1
37.9
19.8
N/A
9.8
13.7
N/A
5.5
2006
89
90
0.14
N/A
3.8
10.3
31.3
33.6
19.4
N/A
10.0
14.9
0.2
5.1
2005
92
83
0.15
0.70
4.4
10.5
29.0
33.1
19.6
N/A
10.7
N/A
0.2
5.1
2004
74
76
0.16
0.56
3.3
12.9
26.8
24.9
19.8
N/A
N/A
N/A
N/A
4.3
2003
85
88
0.26
0.56
4.2
14.8
28.9
29.3
18.9
N/A
N/A
N/A
0.1
5.5
2002
83
99
0.33
0.65
3.9
14.3
27.2
34.8
19.7
N/A
N/A
N/A
N/A
5.0
2001
83
103
0.31
0.70
4.2
16.0
25.5
31.0
21.4
N/A
N/A
N/A
N/A
4.5
2000
86
90
0.28
0.68
4.7
17.1
27.8
31.2
21.2
N/A
N/A
N/A
N/A
4.4
Natural disasters
Type
Austin
Greensboro
Tornado activity compared to U.S. average
137.9%
76.6%
Earthquake activity compared to U.S. average
80.4%
67.4%
Natural disasters compared to U.S. average
29%
20%
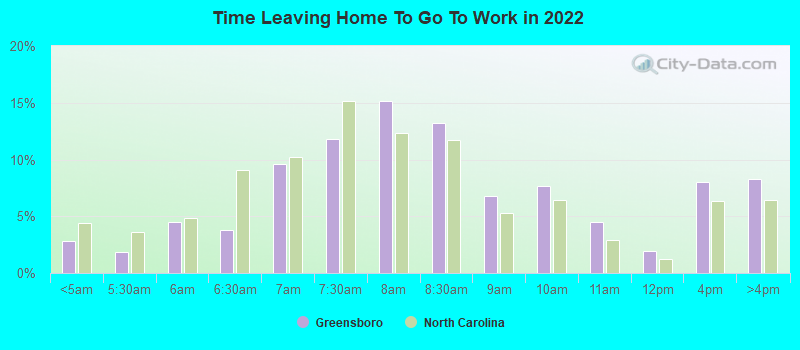
Transportation
Austin's expanding public transportation options, including a new subway system, complement the city's massive biking community. Commuting, however, can be a challenge due to rising traffic congestion. Conversely, Greensboro offers a well-coordinated public transportation system with less congestion, facilitated by its status as a hub for UPS and FedEx, and with its less densely populated nature.
Transport
Type
Austin
Greensboro
Amtrak stations
1
1
Amtrak stations nearby
1
2
FAA registered aircraft
911
300
FAA registered aircraft manufacturers and dealers
21
13
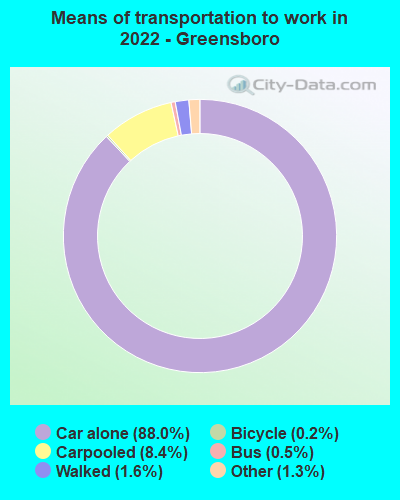
Means of transportation to work
Type
Austin
Greensboro
Bicycle
0.8%
0.1%
Bus
1.5%
1%
Carpooled
7.9%
6.8%
Car alone
85.9%
89.4%
Motorcycle
0.3%
0.1%
Taxicab
0.1%
0.2%
Walked
2%
1.2%
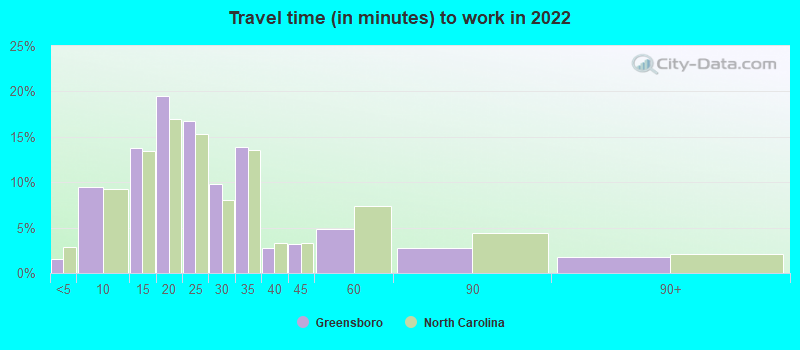
Average travel time to work
Type
Austin
Greensboro
Average
29.9 min
24.8 min
Other means
22.7 min
20.9 min
Public transportation
37.9 min
42.2 min
Private vehicle occupancy
Type
Austin
Greensboro
Average
1.1
1.1
Drove alone
91.2%
91.9%
In 2 person carpool
6.3%
5.8%
In 3 person carpool
1.7%
1.5%
In 4 person carpool
0.6%
0.5%
In 7+ person carpool
0.2%
0.2%
How many people usually rode to work in the car, truck or van.
Real Estate
For both residents and investors, Austin's housing market has been booming, causing a surge in prices. Conversely, Greensboro's real estate market is less heated, making it possibly a more affordable place to buy a home.
Neighborhoods
Austin is known for its eclectic, vibrant neighborhoods that cater to diverse lifestyles, from the hip and energetic East Austin to the more relaxed and family-friendly Circle C. On the other hand, Greensboro boasts historic, leafy neighborhoods such as Fisher Park and Old Irving Park.
Houses and residents
Type
Austin
Greensboro
Houses
469,156
139,565
Average household size (people)
2.4
2.3
Median year apartment built
1997
1989
Median year house/condo built
1988
1981
Length of stay in the house since moving in
12.1 years
13.6 years
Houses occupied
449,399 (95.8%)
123,955 (88.8%)
Houses occupied by owners
196,458 (43.7%)
69,834 (56.3%)
Houses occupied by renters
252,941 (56.3%)
54,121 (43.7%)
Median rent asked for vacant for-rent units
$1,286
$1,295
Median monthly housing costs
$1,521
$981
Median price asked for vacant for-sale houses and condos
$549,769
$336,309
Estimated median house or condo value
$482,900
$186,200
Median numbers of rooms
4.4
5.3
Median number of rooms in apartments
3.4
4
Median number of rooms in houses and condos
6
6.3
Median house price - detached houses
$595,996
$261,886
Median house price - in 2-unit structures
$393,984
$205,442
Median house price - in 3-to-4-unit structures
$262,826
$240,978
Median house price - in 5 or more unit structures
$576,111
$129,256
Median house price - mobile homes
$56,102
$86,037
Median house price - Townhouses or other attached units
$459,657
$221,087
Median house price - All housing units
$571,154
$252,845
Median house age
28
37
Renting percentage
54.9%
47.5%
Housing density (houses/condos per square mile)
1,865.3
1,332.9
House value disparities
28.4%
36.2%
Household income disparities
44.8%
45.9%
Median household income for houses/condes with a mortgage
$141,177
$75,953
Median household income for apartments without a mortgage
$86,430
$62,470
Housing units without a mortgage
1,799 (1.3%)
1,421 (3.1%)
Housing units with both a second mortgage and home equity loan
6,421 (4.8%)
3,736 (8.1%)
Housing units with a mortgage
132,628 (98.7%)
44,909 (96.9%)
Housing units with a home equity loan
206 (0.2%)
227 (0.5%)
Housing units with a second mortgage
8,515 (6.3%)
5,099 (11%)
House/condo owner moved in on average (years ago)
9
12
House/condo renter moved in on average (years ago)
1
1
Housing units lacking complete kitchen facilities
0.9%
1.8%
Housing units lacking complete plumbing facilities
0.6%
0.5%
Housing units in structures
Housing units in structures
Austin
Greensboro
One, detached
43.1%
55.4%
One, attached
5.2%
7.3%
Two
2.4%
1.7%
3 or 4
4.1%
5.4%
5 to 9
7.2%
9.0%
10 to 19
11.0%
8.6%
20 to 49
8.9%
7.0%
50 or more
17.2%
4.3%
Mobile homes
1.0%
1.3%
Median real estate property taxes paid for housing units
Self-employed workers in own not incorporated business
38,777
6,258
State government workers
46,229
9,041
Unpaid family workers
102
205
Industries and Occupations
In Austin, there's a strong presence of high-tech industry, with many occupants working in information technology, software, and electronics sectors. In contrast, Greensboro's economy is more diversified with key industries in education, health care, logistics, and manufacturing.
Austin has a strong healthcare system with nationally recognized healthcare providers such as Ascension Seton and St. David’s HealthCare. Greensboro also offers a robust healthcare scene, with Cone Health serving as the leading healthcare provider.
Health (county statistics)
Type
Austin
Greensboro
General health status score of residents in this county from 1 (poor) to 5 (excellent)
Austin has been rapidly expanding its infrastructure to accommodate its growth, investing significantly in road maintenance, public utilities, and public transportation. Greensboro's infrastructure, though not as rapidly developing as Austin's, is still well-maintained with a focus on stability and manageable growth.
Infrastructure
Type
Austin
Greensboro
Hospitals
65
16
TV stations
20
10
Arenas or stadiums
2
1
Bank branches located here
264
97
Bank institutions located here
43
19
Main business address for public companies
44
11
Drinking water stations with no reported violations in the past
46
3
Drinking water stations with reported violations in the past
HMDA - Conventional home purchase loans - Applications denied
Year
Austin
Greensboro
1999
4,733
1,540
2000
2,950
1,012
2001
2,038
739
2002
1,772
787
2003
2,213
568
2004
2,458
692
2005
3,121
748
2006
3,367
880
2007
2,560
653
2008
1,747
290
2009
1,067
164
Culture and Food
Austin is renowned for its music scene, often referred to as the "Live Music Capital of the World." It's also famous for its food scene, particularly its fusion of Tex-Mex and barbecue. Greensboro, on the other hand, offers a rich history with multiple historical sites and museums. Its food scene is diverse with an emphasis on Southern cuisine.
Sports Teams
Austin only recently joined the major leagues with the Austin FC soccer team, while the college sports culture is massive, specifically around University of Texas football. Greensboro doesn’t host any major league professional teams, but college basketball, particularly around the local ACC teams, is huge.


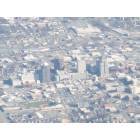
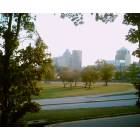
 Austin, TX
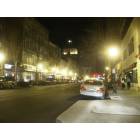
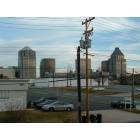
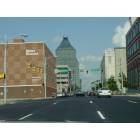
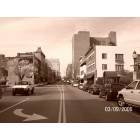
 Greensboro, NC