Austin, the capital of Texas, and Irvine, located in the sun-kissed state of California, are two incredibly distinctive cities offering diverse experiences. The two cities are vibrant with strong economies and cultural diversity, but they provide contrasting environments regarding weather, quality of life, tax implications, and recreational activities. Whether you're looking to move or just visit, you'll find unique opportunities to discover life in the heartland of Texas or the beautiful coastline of California.
Distance between
Austin, TX and
Irvine, CA : 1,195.6 miles
Austin's population is larger by 212%. Its population has grown by 307,615 people (46.9%) since 2000. The population of Irvine has grown by 165,959 people (116.0%) during that time.
In terms of safety, Irvine frequently ranks as one of the safest cities in America. Crime rates, in general, are quite low compared to national averages, making it a safe place for families and tourists. On the other hand, Austin, while generally safe, has somewhat higher crime rates compared to Irvine. However, crime levels greatly vary depending on the neighborhood in Austin, with some areas being exceptionally safe.
City-data.com crime index counts serious crimes and violent crime more heavily. It adjusts for the number of visitors and daily workers commuting into cities. (higher means more crime, U.S. average = 301.1)
City-data.com crime index counts serious crimes and violent crime more heavily. It adjusts for the number of visitors and daily workers commuting into cities. (higher means more crime, U.S. average = 301.1)
Sex Offenders
According to our data, there are 1,411 registered sex offenders living in Austin and 44 registered sex offenders living in . The ratio of residents to sex offenders in Austin is 672 to 1; the ratio in Irvine is 6,048 to 1. The number of registered sex offenders compared to the number of residents is much larger in Austin than that in Irvine.
Cost of Living
The overall cost of living is considerably higher in Irvine than in Austin. This is particularly true in terms of housing costs. Irvine's property prices are significantly higher than Austin's. The cost of utilities, transportation, and grocery items also tend to be higher in Irvine compared to Austin.
Income Tax
There is no state income tax in Texas, so Austin residents won't have to pay this. In contrast, California has a progressive income tax system, meaning higher-income individuals will pay more in tax in Irvine.
Property Tax
While Austin homes are less expensive, Texas has higher property tax rates. Irvine, despite its expensive real estate, has lower property tax rates, thanks to California's Proposition 13.
Sales Tax
Sales tax is higher in Austin at 8.25% compared to 7.75% in Irvine. However, Texas has no state income tax, which may supplement some costs for residents.
Income
Type
Austin
Irvine
Estimated median household income
$79,542
$105,774
Estimated per capita income
$53,937
$54,053
Cost of living index (U.S. average is 100)
96.4
89.8
If you make $50,000 in Irvine, you will have to make $53,675 in Austin to maintain the same standard of living.
Geographical Conditions
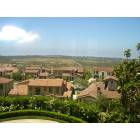
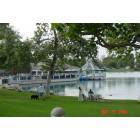
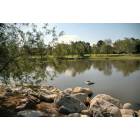
Austin's geographical conditions are characterized by hill country terrain and several bodies of water, including Lake Austin. Irvine, on the other hand, is near the California coastline with its beaches and offers a view of the Santa Ana Mountains.
Both cities have high-quality education systems. Austin is home to the highly reputed University of Texas, and boasts numerous accredited schools. Irvine, too, offers excellent education options, housing the University of California, Irvine, and boasting some of California's top-rated public schools.
Austin is one of the fastest-growing cities in the U.S., with a booming economy focused on technology, music, film and a strong entrepreneurial scene. Irvine also has a thriving economy, with its business sector dominated by industries such as technology, health care, and education.
Biggest Employers
In Austin, Dell, IBM, the University of Texas, and State of Texas are some of the largest employers. In Irvine, major employers encompass a wider range of sectors and include University of California, Irvine, Broadcom Corporation, and Edwards Lifesciences.
There were 4,180 building permits issued in Austin in 2012 (2467 more than in 2011) compared to 1,129 building permits issued in Irvine in 2012 (272 more than in 2011).
In Austin (Travis County), 60.2% voted for Democrats and 36.2% for Republicans in 2012 Presidential Election. In Irvine (Orange County), 45.8% voted for Democrats and 52.0% for Republicans.
Elections
Type
Democrats
Republicans
Other
Year
Austin
Irvine
Austin
Irvine
Austin
Irvine
2020
71.7%
53.6%
26.5%
44.6%
1.8%
1.8%
2016
65.8%
50.9%
27.2%
42.4%
7.0%
6.7%
2012
60.2%
45.8%
36.2%
52.0%
3.6%
2.3%
2008
63.8%
47.8%
34.4%
50.3%
1.8%
1.9%
2004
56.1%
39.3%
42.1%
60.2%
1.8%
0.5%
2000
41.7%
40.4%
47.0%
55.9%
11.3%
3.7%
1996
52.4%
37.9%
40.0%
51.7%
7.7%
10.5%
Breakdown of population affiliated with a religious congregation
Type
Adherents
Congregations
Religion
Austin
Irvine
Austin
Irvine
CATHOLIC CHURCH
17.3%
26.5%
4.5%
4.4%
SOUTHERN BAPTIST CONVENTION
8.0%
2.3%
22.8%
8.8%
EPISCOPAL CHURCH
1.4%
0.4%
2.8%
1.4%
MUSLIM ESTIMATE
1.2%
0.8%
0.7%
1.3%
EVANGELICAL LUTHERAN CHURCH IN AMERICA
1.0%
0.4%
2.5%
2.3%
LUTHERAN CHURCH
0.9%
0.6%
2.1%
2.0%
SEVENTH DAY ADVENTIST CHURCH
0.2%
0.4%
1.0%
1.3%
REFORMED CHURCH IN AMERICA
0.0%
0.3%
0.0%
0.2%
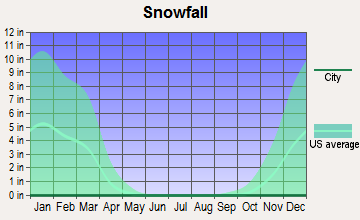
Weather
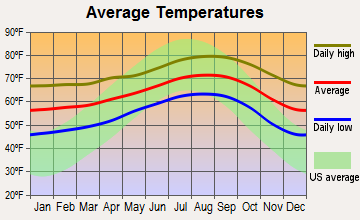
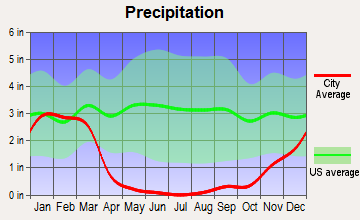
When considering weather, Austin experiences warmer and more humid summers with temperatures often reaching triple digits. Winters are mild. Irvine, on the other hand, has a Mediterranean climate. Its summers are warm but not as hot and humid as Austin, and winters are cool and wet. Irvine offers less rainy days throughout the year than Austin, making it more adaptable for outdoor enthusiasts.
Weather and climate
Type
Austin
Irvine
Temperature - Average
68.5°F
63.6°F
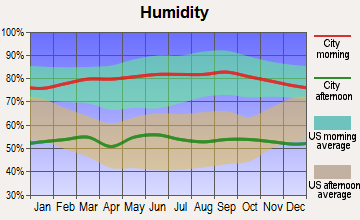
Humidity - Average morning or afternoon humidity
75.2%
69.5%
Humidity - Differences between morning and afternoon humidity
40%
25.7%
Humidity - Maximum monthly morning or afternoon humidity
89%
77.7%
Humidity - Minimum monthly morning or afternoon humidity
49%
52%
Precipitation - Yearly average
33.7 in
13.1 in
Snowfall - Yearly average
1.4 in
0 in
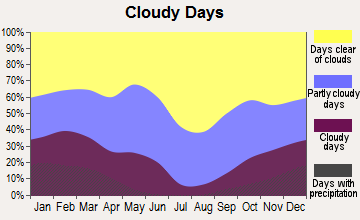
Clouds - Number of days clear of clouds
19.3%
26.6%
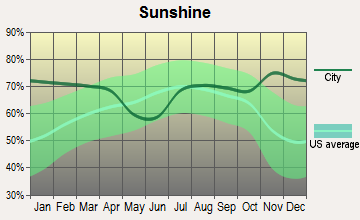
Sunshine amount - Average
63.3%
78.3%
Sunshine amount - Differences during a year
22%
21.7%
Sunshine amount - Maximum monthly
72%
84.4%
Sunshine amount - Minimum monthly
50%
62.7%
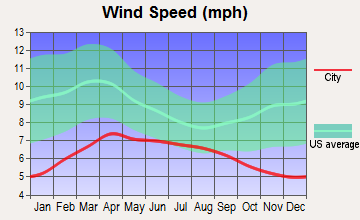
Wind speed - Average
7.2 mph
5.7 mph
Average climate in Austin, Texas
Average climate in Irvine, California
Air pollution
Type
AQI
CO
NO2
OZONE
PB
PM10
PM25
SO2
Year
Austin
Irvine
Austin
Irvine
Austin
Irvine
Austin
Irvine
Irvine
Irvine
Austin
Irvine
Austin
Irvine
2018
76
119
N/A
0.25
4.9
13.5
26.7
31.5
N/A
N/A
27.5
N/A
8.7
12.5
0.2
N/A
2017
76
116
N/A
0.27
4.6
13.1
29.7
32.5
N/A
N/A
26.7
N/A
8.3
13.7
0.3
N/A
2016
71
102
N/A
0.24
4.2
11.6
29.5
31.6
N/A
N/A
24.1
N/A
8.2
12.6
0.2
0.1
2015
78
104
N/A
0.21
4.4
12.6
28.9
31.3
N/A
N/A
25.0
N/A
8.6
14.6
0.3
0.1
2014
74
109
N/A
0.20
5.2
12.3
28.3
30.1
N/A
N/A
26.7
N/A
8.7
15.8
0.5
0.3
2013
78
107
0.09
0.25
5.5
13.1
29.5
28.8
0.003
N/A
29.2
N/A
8.6
14.1
0.5
0.2
2012
86
103
0.13
0.28
5.5
12.1
30.1
28.1
0.004
N/A
27.9
N/A
8.6
14.4
N/A
0.1
2011
83
109
0.11
0.24
2.6
13.8
33.0
28.6
0.006
N/A
27.6
N/A
9.1
15.9
N/A
0.3
2010
77
102
0.05
0.27
3.2
13.4
29.4
28.4
0.011
N/A
23.6
N/A
8.8
14.3
N/A
0.6
2009
76
118
0.05
0.26
2.6
15.3
29.7
29.3
0.009
N/A
24.3
N/A
9.0
14.7
N/A
1.1
2008
81
124
0.12
0.33
3.2
16.0
30.7
29.8
0.008
N/A
29.7
N/A
9.7
21.6
N/A
1.1
2007
82
100
0.12
0.31
3.1
15.9
27.1
28.6
0.010
N/A
N/A
N/A
9.8
N/A
N/A
0.8
2006
89
109
0.14
0.36
3.8
16.7
31.3
28.1
0.005
N/A
N/A
N/A
10.0
N/A
0.2
1.3
2005
92
91
0.15
0.35
4.4
17.0
29.0
28.8
0.011
N/A
N/A
N/A
10.7
N/A
0.2
1.3
2004
74
118
0.16
0.42
3.3
18.3
26.8
31.8
0.012
N/A
N/A
N/A
N/A
N/A
N/A
1.6
2003
85
116
0.26
0.53
4.2
21.1
28.9
29.9
0.046
N/A
N/A
N/A
N/A
N/A
0.1
1.1
2002
83
103
0.33
0.54
3.9
20.7
27.2
26.5
0.010
N/A
N/A
N/A
N/A
N/A
N/A
1.6
2001
83
109
0.31
0.65
4.2
20.7
25.5
26.5
0.011
N/A
N/A
N/A
N/A
N/A
N/A
1.4
2000
86
116
0.28
0.67
4.7
23.6
27.8
24.1
0.016
N/A
N/A
N/A
N/A
N/A
N/A
1.9
Natural disasters
Type
Austin
Irvine
Tornado activity compared to U.S. average
137.9%
18.7%
Earthquake activity compared to U.S. average
80.4%
6,900.9%
Natural disasters compared to U.S. average
29%
32%
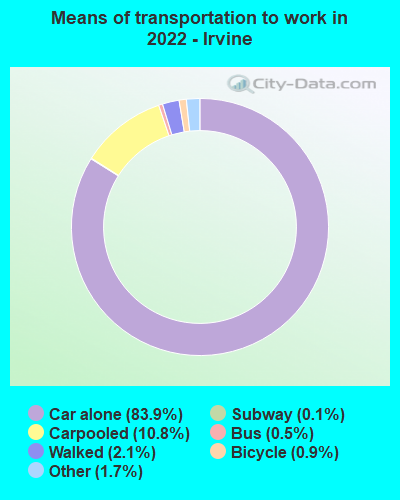
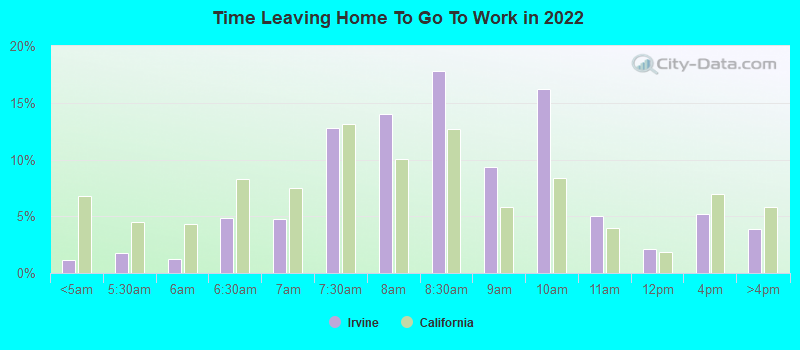
Transportation
Austin offers public transportation options like buses and a metro rail, though the city heavily relies on cars for commuting. Irvine also has public buses and is served by Metrolink commuter rail, but its systematically planned roads make it easier to navigate.
Transport
Type
Austin
Irvine
Amtrak stations
1
1
Amtrak stations nearby
1
3
FAA registered aircraft
911
173
FAA registered aircraft manufacturers and dealers
21
2
Means of transportation to work
Type
Austin
Irvine
Bicycle
0.8%
1.2%
Bus
1.5%
0.2%
Carpooled
7.9%
9.5%
Car alone
85.9%
84.4%
Motorcycle
0.3%
0.2%
Railroad
0%
0.1%
Taxicab
0.1%
0%
Walked
2%
2.2%
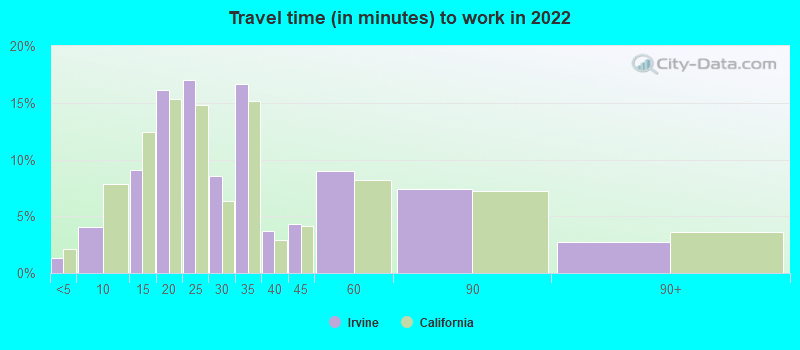
Average travel time to work
Type
Austin
Irvine
Average
29.9 min
30.7 min
Other means
22.7 min
23.7 min
Public transportation
37.9 min
42.7 min
Private vehicle occupancy
Type
Austin
Irvine
Average
1.1
1.1
Drove alone
91.2%
90.2%
In 2 person carpool
6.3%
7.8%
In 3 person carpool
1.7%
1.2%
In 4 person carpool
0.6%
0.4%
In 5-6 person carpool
0.1%
0.3%
In 7+ person carpool
0.2%
0.1%
How many people usually rode to work in the car, truck or van.
Real Estate
The real estate market in Austin features a lower median home price compared to Irvine, making housing more affordable. Irvine's real estate is much pricier, reflecting California's overall high property values.
Neighborhoods
For neighborhoods, Austin offers a mix of historic districts like Hyde Park, trendy areas like South Congress, and upscale communities like Westlake. Irvine, on the other hand, is well-known for its master-planned communities, each offering its unique amenities and character.
Houses and residents
Type
Austin
Irvine
Houses
469,156
122,260
Average household size (people)
2.4
2.6
Median year apartment built
1997
2000
Median year house/condo built
1988
1996
Length of stay in the house since moving in
12.1 years
11.4 years
Houses occupied
449,399 (95.8%)
111,648 (91.3%)
Houses occupied by owners
196,458 (43.7%)
49,861 (44.7%)
Houses occupied by renters
252,941 (56.3%)
61,787 (55.3%)
Median rent asked for vacant for-rent units
$1,286
$3,151
Median monthly housing costs
$1,521
$2,500
Median price asked for vacant for-sale houses and condos
$549,769
$948,000
Estimated median house or condo value
$482,900
$970,500
Median numbers of rooms
4.4
4.5
Median number of rooms in apartments
3.4
3.8
Median number of rooms in houses and condos
6
5.9
Median house price - detached houses
$595,996
Over $1,000,000
Median house price - in 2-unit structures
$393,984
$860,411
Median house price - in 3-to-4-unit structures
$262,826
$621,769
Median house price - in 5 or more unit structures
$576,111
$678,675
Median house price - mobile homes
$56,102
$398,841
Median house price - Townhouses or other attached units
$459,657
$825,112
Median house price - All housing units
$571,154
Over $1,000,000
Median house age
28
21
Renting percentage
54.9%
49.8%
Housing density (houses/condos per square mile)
1,865.3
2,647.3
House value disparities
28.4%
18.8%
Household income disparities
44.8%
41.8%
Median household income for houses/condes with a mortgage
$141,177
$185,171
Median household income for apartments without a mortgage
$86,430
$97,123
Housing units without a mortgage
1,799 (1.3%)
316 (1%)
Housing units with both a second mortgage and home equity loan
6,421 (4.8%)
2,738 (8.4%)
Housing units with a mortgage
132,628 (98.7%)
32,261 (99%)
Housing units with a home equity loan
206 (0.2%)
0 (0%)
Housing units with a second mortgage
8,515 (6.3%)
3,066 (9.4%)
House/condo owner moved in on average (years ago)
9
8
House/condo renter moved in on average (years ago)
1
1
Housing units lacking complete kitchen facilities
0.9%
2.2%
Housing units lacking complete plumbing facilities
0.6%
0.1%
Housing units in structures
Housing units in structures
Austin
Irvine
One, detached
43.1%
37.3%
One, attached
5.2%
20.1%
Two
2.4%
1.1%
3 or 4
4.1%
4.5%
5 to 9
7.2%
5.9%
10 to 19
11.0%
5.1%
20 to 49
8.9%
5.0%
50 or more
17.2%
20.0%
Mobile homes
1.0%
0.8%
Boats, RVs, vans, etc.
0.0%
0.1%
Median real estate property taxes paid for housing units
Self-employed workers in own not incorporated business
38,777
9,200
State government workers
46,229
9,735
Unpaid family workers
102
399
Industries and Occupations
Austin is known as "Silicon Hills" due to the proliferation of tech firms, with occupations in technology and creative sectors being common. Irvine also has many tech companies but in addition has a substantial healthcare industry.
Both cities boast a strong healthcare system. Austin has numerous hospitals and clinics. Irvine is home to multiple medical facilities, with Hoag Hospital and UCI Health Systems being highly rated.
Health (county statistics)
Type
Austin
Irvine
General health status score of residents in this county from 1 (poor) to 5 (excellent)
Austin has been investing heavily in infrastructure to accommodate its fast growth. It is working hard to improve traffic congestion and improve public transit. Irvine, in contrast, was designed with a master plan in mind and is well-regarded for its organized structure, public parks, and wide roads.
Infrastructure
Type
Austin
Irvine
Hospitals
65
4
TV stations
20
2
Arenas or stadiums
2
1
Bank branches located here
264
98
Bank institutions located here
43
47
Main business address for public companies
44
65
Nuclear power plants nearby
0
2
Drinking water stations with no reported violations in the past
46
0
Drinking water stations with reported violations in the past
HMDA - Conventional home purchase loans - Applications denied
Year
Austin
Irvine
1999
4,733
704
2000
2,950
417
2001
2,038
271
2002
1,772
242
2003
2,213
609
2004
2,458
835
2005
3,121
899
2006
3,367
897
2007
2,560
576
2008
1,747
344
2009
1,067
210
Culture and Food
Austin is known for its vibrant live-music scene with a variety of cuisines, including famous Tex-Mex and barbecue. Irvine, due to its diverse population, offers a wide range of international cuisines, fusion eateries, and popular food festivals.
Sports Teams
Austin is home to the Austin FC soccer team and nearby NFL team, the Dallas Cowboys. It does not have its own major league professional teams. Irvine residents can support Los Angeles teams, like the Lakers and Dodgers while also having proximity to Anaheim teams, like the Ducks and Angels.


 Austin, TX
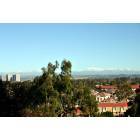
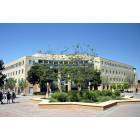
 Irvine, CA