Austin, Texas, and Paradise, Nevada, are two vastly different areas of the United States. Austin, the capital of Texas, is known for its eclectic live-music scene, vibrant arts community, impressive tech industry, and multiple universities. On the other hand, Paradise is an unincorporated town located in the Las Vegas Valley known for its high-energy entertainment, prominent hospitality industry, and close proximity to natural attractions such as the Red Rock Canyon National Conservation Area. Comparing these two unique locations involves reviewing key factors like safety, cost of living, education, and economy, among others.
Distance between
Austin, TX and
Paradise, NV : 1,079.2 miles
Austin's population is larger by 419%. Its population has grown by 307,615 people (46.9%) since 2000. The population of Paradise has decreased by 221 people (0.1%) during that time.
Safety is an important factor in choosing a place to live or visit. Austin’s crime rate is higher than the national average, but it’s mainly composed of property crimes rather than violent crimes. On the other hand, Paradise, being part of Las Vegas, has a mixed crime rate. While it can be high in some areas, especially those popular with tourists, other areas are safer and more residential.
Cost of Living
The cost of living in Austin is higher than the national average, particularly in relation to housing costs. Paradise, NV, offers a slightly lower cost of living, mostly due to less expensive housing options. However, other expenses like groceries and health costs are comparable in both cities.
Income Tax
Texas does not levy a state income tax, which is a significant benefit for residents of Austin. Nevada also has no state income tax, which can be beneficial for both residents and businesses in Paradise.
Property Tax
Property taxes in Texas are among the highest in the U.S, which is something to consider when buying property in Austin. On the other hand, property taxes in Nevada are relatively low, which can make owning property in Paradise more appealing.
Sales Tax
Texas has a sales tax rate of 6.25%, but with local taxes, the total can reach up to 8.25%. Nevada has a sales tax rate of 6.85%, but in Paradise, the combined tax rate goes up to 8.38%, one of the highest in the U.S.
Income
Type
Austin
Paradise
Estimated median household income
$79,542
$50,096
Estimated per capita income
$53,937
$28,275
Cost of living index (U.S. average is 100)
96.4
99.3
If you make $50,000 in Austin, you will have to make $51,504 in Paradise to maintain the same standard of living.
Geographical Conditions
Austin is located in Central Texas and includes the beautiful Texas Hill Country, providing opportunities for outdoor activities. Paradise is located in the Mojave Desert and is close to natural attractions such as Lake Mead and Red Rock Canyon.
Austin, home to the University of Texas, has a highly educated population and a strong emphasis on education at all levels. Paradise, NV, has a diversified educational landscape with access to higher education through the University of Nevada, Las Vegas. However, public school performance in both areas varies.
Austin's economy is highly diversified, with strong sectors in technology, pharmaceuticals, biotechnology, and film production. In contrast, Paradise's economy is heavily based on tourism, hospitality, and entertainment, being home to the main tourist corridor of Las Vegas.
Biggest Employers
Austin's biggest employers include Dell, the University of Texas at Austin, and the federal and state government. In Paradise, the largest employers are generally casinos and hotels, like the MGM Grand and the Bellagio.
In Austin (Travis County), 60.2% voted for Democrats and 36.2% for Republicans in 2012 Presidential Election. In Paradise (Clark County), 56.4% voted for Democrats and 41.8% for Republicans.
Elections
Type
Democrats
Republicans
Other
Year
Austin
Paradise
Austin
Paradise
Austin
Paradise
2020
71.7%
53.7%
26.5%
44.3%
1.8%
2.0%
2016
65.8%
52.4%
27.2%
41.7%
7.0%
5.8%
2012
60.2%
56.4%
36.2%
41.8%
3.6%
1.8%
2008
63.8%
58.5%
34.4%
39.5%
1.8%
2.0%
2004
56.1%
51.8%
42.1%
46.9%
1.8%
1.3%
2000
41.7%
51.4%
47.0%
44.8%
11.3%
3.8%
1996
52.4%
75.5%
40.0%
18.8%
7.7%
5.7%
Breakdown of population affiliated with a religious congregation
Type
Adherents
Congregations
Religion
Austin
Paradise
Austin
Paradise
CATHOLIC CHURCH
17.3%
18.1%
4.5%
4.0%
SOUTHERN BAPTIST CONVENTION
8.0%
1.6%
22.8%
11.2%
EPISCOPAL CHURCH
1.4%
0.1%
2.8%
1.1%
MUSLIM ESTIMATE
1.2%
0.1%
0.7%
0.6%
EVANGELICAL LUTHERAN CHURCH IN AMERICA
1.0%
0.4%
2.5%
1.6%
LUTHERAN CHURCH
0.9%
0.2%
2.1%
1.2%
Weather
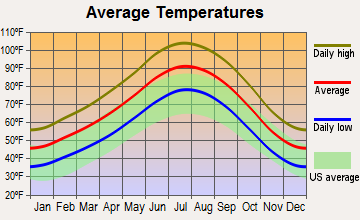
Austin has a humid subtropical climate characterized by hot summers and mild winters, with an average of 230 sunny days per year, which is higher than the US average. Paradise, on the other hand, has a desert climate, with extremely hot summers and short, mild winters. Both cities can have high temperatures in summer, but Paradise is drier.
Weather and climate
Type
Austin
Paradise
Temperature - Average
68.5°F
68°F
Humidity - Average morning or afternoon humidity
75.2%
30.7%
Humidity - Differences between morning and afternoon humidity
40%
42%
Humidity - Maximum monthly morning or afternoon humidity
89%
52%
Humidity - Minimum monthly morning or afternoon humidity
49%
10%
Precipitation - Yearly average
33.7 in
4.6 in
Snowfall - Yearly average
1.4 in
1.6 in
Clouds - Number of days clear of clouds
19.3%
35.1%
Sunshine amount - Average
63.3%
91.8%
Sunshine amount - Differences during a year
22%
16%
Sunshine amount - Maximum monthly
72%
92%
Sunshine amount - Minimum monthly
50%
76%
Wind speed - Average
7.2 mph
9.2 mph
Average climate in Austin, Texas
Average climate in Paradise, Nevada
Air pollution
Type
AQI
CO
NO2
OZONE
PM10
PM25
SO2
Year
Austin
Paradise
Austin
Paradise
Austin
Paradise
Austin
Paradise
Paradise
Austin
Paradise
Austin
Paradise
2018
76
102
N/A
0.42
4.9
15.6
26.7
34.6
29.8
N/A
8.7
7.6
0.2
0.7
2017
76
102
N/A
0.34
4.6
16.0
29.7
33.0
23.5
N/A
8.3
7.1
0.3
0.8
2016
71
107
N/A
0.39
4.2
14.1
29.5
32.2
24.0
N/A
8.2
8.1
0.2
0.8
2015
78
92
N/A
0.40
4.4
14.6
28.9
31.3
22.1
N/A
8.6
8.4
0.3
1.2
2014
74
92
N/A
0.42
5.2
12.8
28.3
29.9
25.1
N/A
8.7
9.0
0.5
1.4
2013
78
103
0.09
0.43
5.5
12.7
29.5
30.9
24.5
N/A
8.6
7.9
0.5
1.5
2012
86
96
0.13
0.47
5.5
6.6
30.1
32.8
25.6
N/A
8.6
7.4
N/A
1.4
2011
83
85
0.11
0.45
2.6
5.3
33.0
32.2
19.8
N/A
9.1
6.6
N/A
1.2
2010
77
83
0.05
0.50
3.2
5.7
29.4
31.8
17.4
N/A
8.8
6.1
N/A
N/A
2009
76
87
0.05
0.57
2.6
6.0
29.7
30.0
22.8
N/A
9.0
7.2
N/A
N/A
2008
81
83
0.12
0.61
3.2
8.2
30.7
29.3
N/A
N/A
9.7
7.5
N/A
N/A
2007
82
98
0.12
0.51
3.1
14.0
27.1
27.7
N/A
N/A
9.8
7.4
N/A
0.1
2006
89
102
0.14
0.69
3.8
16.4
31.3
29.6
N/A
N/A
10.0
8.4
0.2
0.8
2005
92
102
0.15
0.72
4.4
17.7
29.0
27.9
N/A
N/A
10.7
8.3
0.2
5.3
2004
74
88
0.16
0.71
3.3
17.6
26.8
28.8
N/A
N/A
N/A
N/A
N/A
1.6
2003
85
100
0.26
0.63
4.2
18.5
28.9
28.3
N/A
N/A
N/A
N/A
0.1
0.9
2002
83
96
0.33
0.58
3.9
18.1
27.2
28.0
N/A
N/A
N/A
N/A
N/A
0.7
2001
83
96
0.31
0.63
4.2
18.9
25.5
26.9
N/A
N/A
N/A
N/A
N/A
1.0
2000
86
96
0.28
0.73
4.7
18.1
27.8
27.0
N/A
N/A
N/A
N/A
N/A
0.4
Natural disasters
Type
Austin
Paradise
Tornado activity compared to U.S. average
137.9%
2.3%
Earthquake activity compared to U.S. average
80.4%
6,005.3%
Natural disasters compared to U.S. average
29%
12%
Transportation
Austin residents rely heavily on cars for commuting, leading to considerable traffic. However, public transportation is available through metro buses and a commuter rail. Paradise, being a part of Las Vegas, has extensive public transportation options, especially geared towards tourists.
Transport
Type
Austin
Paradise
Amtrak stations
1
0
Amtrak stations nearby
1
1
FAA registered aircraft
911
0
FAA registered aircraft manufacturers and dealers
21
0
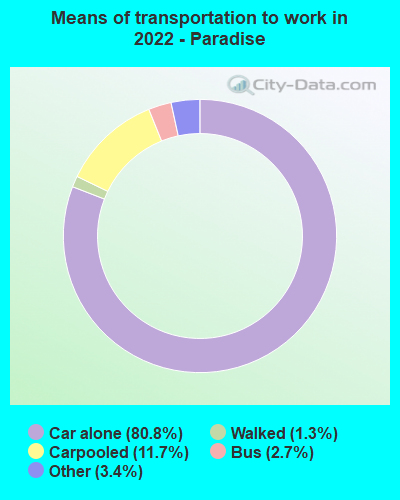
Means of transportation to work
Type
Austin
Paradise
Bicycle
0.8%
0.3%
Bus
1.5%
2.3%
Carpooled
7.9%
11.5%
Car alone
85.9%
82.3%
Motorcycle
0.3%
0.3%
Taxicab
0.1%
0.2%
Walked
2%
1.1%
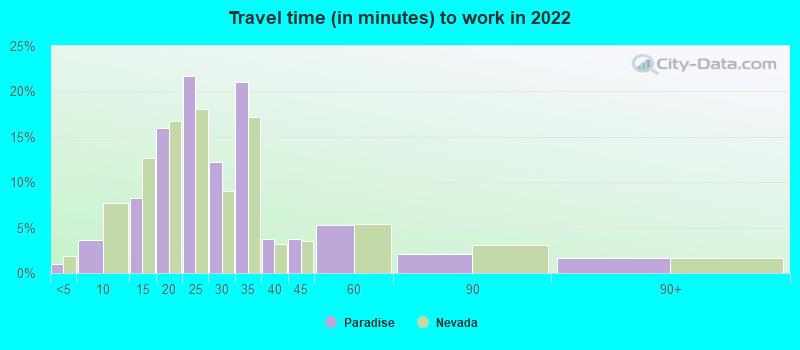
Average travel time to work
Type
Austin
Paradise
Average
29.9 min
27.5 min
Other means
22.7 min
20.4 min
Public transportation
37.9 min
43.9 min
Private vehicle occupancy
Type
Austin
Paradise
Average
1.1
1.2
Drove alone
91.2%
84.5%
In 2 person carpool
6.3%
13.8%
In 3 person carpool
1.7%
0.8%
In 4 person carpool
0.6%
0.4%
In 5-6 person carpool
0.1%
0.4%
In 7+ person carpool
0.2%
0.1%
How many people usually rode to work in the car, truck or van.
Real Estate
Austin's real estate market is currently hot, with home prices escalating due to high demand and growing population. In contrast, Paradise offers a range of options from luxury condominiums to affordable apartments.
Neighborhoods
Austin has diverse neighborhoods that cater to different lifestyles, from the vibrant downtown area to the serene suburbs. Paradise is mainly composed of the Las Vegas Strip and its surrounding areas, creating a fast-paced, exciting environment.
Houses and residents
Type
Austin
Paradise
Houses
469,156
95,898
Average household size (people)
2.4
2.5
Median year apartment built
1997
1984
Median year house/condo built
1988
1985
Length of stay in the house since moving in
12.1 years
11.6 years
Houses occupied
449,399 (95.8%)
78,005 (81.3%)
Houses occupied by owners
196,458 (43.7%)
33,900 (43.5%)
Houses occupied by renters
252,941 (56.3%)
44,105 (56.5%)
Median rent asked for vacant for-rent units
$1,286
$4,622
Median monthly housing costs
$1,521
$1,126
Median price asked for vacant for-sale houses and condos
$549,769
$238,007
Estimated median house or condo value
$482,900
$334,500
Median numbers of rooms
4.4
4.2
Median number of rooms in apartments
3.4
3.6
Median number of rooms in houses and condos
6
6.1
Median house price - detached houses
$595,996
$376,914
Median house price - in 2-unit structures
$393,984
$134,611
Median house price - in 3-to-4-unit structures
$262,826
$160,124
Median house price - in 5 or more unit structures
$576,111
$488,432
Median house price - mobile homes
$56,102
$56,551
Median house price - Townhouses or other attached units
$459,657
$247,245
Median house price - All housing units
$571,154
$351,599
Median house age
28
34
Renting percentage
54.9%
56.8%
Housing density (houses/condos per square mile)
1,865.3
2,034.4
House value disparities
28.4%
28.9%
Household income disparities
44.8%
46.6%
Median household income for houses/condes with a mortgage
$141,177
$80,528
Median household income for apartments without a mortgage
$86,430
$61,867
Housing units without a mortgage
1,799 (1.3%)
463 (2%)
Housing units with both a second mortgage and home equity loan
6,421 (4.8%)
800 (3.4%)
Housing units with a mortgage
132,628 (98.7%)
23,132 (98%)
Housing units with a home equity loan
206 (0.2%)
0 (0%)
Housing units with a second mortgage
8,515 (6.3%)
1,130 (4.8%)
House/condo owner moved in on average (years ago)
9
9
House/condo renter moved in on average (years ago)
1
1
Housing units lacking complete kitchen facilities
0.9%
4.5%
Housing units lacking complete plumbing facilities
0.6%
0.7%
Housing units in structures
Housing units in structures
Austin
Paradise
One, detached
43.1%
35.3%
One, attached
5.2%
5.9%
Two
2.4%
0.9%
3 or 4
4.1%
9.6%
5 to 9
7.2%
7.8%
10 to 19
11.0%
10.3%
20 to 49
8.9%
7.2%
50 or more
17.2%
21.6%
Mobile homes
1.0%
1.4%
Median real estate property taxes paid for housing units
Self-employed workers in own not incorporated business
38,777
3,926
State government workers
46,229
2,160
Unpaid family workers
102
187
Industries and Occupations
In Austin, the top industries include technology, healthcare, and education, while in Paradise, the top sectors are primarily hospitality, tourism, and entertainment. This makes Austin more suitable for professionals seeking jobs in the tech field, while Paradise may appeal more to those interested in working within the leisure industry.
Austin has strong healthcare services, with top-rated hospitals and numerous health systems. Paradise, as part of the Las Vegas area, has access to several quality healthcare institutions, but the overall quality is considered to be below average by some measures.
Health (county statistics)
Type
Austin
Paradise
General health status score of residents in this county from 1 (poor) to 5 (excellent)
Austin boasts a robust infrastructure, with a great emphasis on technological advancement. Paradise, being part of the Las Vegas Valley, also has a noteworthy infrastructure, primarily oriented towards accommodating the heavy flow of tourists.
HMDA - Conventional home purchase loans - Applications denied
Year
Austin
Paradise
1999
4,733
974
2000
2,950
81
2001
2,038
104
2002
1,772
78
2003
2,213
1,227
2004
2,458
1,912
2005
3,121
3,008
2006
3,367
3,071
2007
2,560
1,731
2008
1,747
786
2009
1,067
285
Culture and Food
Austin is known as the "Live Music Capital of the World" and has a dynamic food scene with Tex-Mex and BBQ being popular. Paradise offers a diverse range of cultural experiences, and its food scene is international, influenced by the many tourists and international establishments in the area.
Sports Teams
Austin is home to the University of Texas Longhorns and recently, the Austin FC in Major League Soccer. Paradise has easy access to major Las Vegas sports teams like the Las Vegas Raiders in the NFL and the Vegas Golden Knights in the NHL.


 Austin, TX
 Paradise, NV