Austin, Texas and Portland, Oregon, are vibrant cities known for their distinct identities. Austin, lovingly referred to as the "Live Music Capital of the World", is renowned for its sunny weather, booming tech industry, and lively Texan culture. On the other hand, Portland, aka "Rose City", stands proud with its lush, rain-soaked landscapes, rich artistic community, and eco-friendly initiatives. This comparison guide delves into various facets of both cities for those looking to relocate or just visiting.
Distance between
Austin, TX and
Portland, OR : 1,704.6 miles
Austin's population is larger by 50%. Its population has grown by 307,615 people (46.9%) since 2000. The population of Portland has grown by 112,041 people (21.2%) during that time.
Austin's crime rate may feel more concerning as it is higher than the national average, with property crime being more prevalent than violent crime. The city is implementing initiatives to lower crime rates, but awareness and caution remain necessary. Portland, while having crime rates above the national average as well, has individual neighborhoods that are among the safest in the country. There's a community effort in Portland to address safety concerns effectively through neighborhood watch programs.
City-data.com crime index counts serious crimes and violent crime more heavily. It adjusts for the number of visitors and daily workers commuting into cities. (higher means more crime, U.S. average = 301.1)
City-data.com crime index counts serious crimes and violent crime more heavily. It adjusts for the number of visitors and daily workers commuting into cities. (higher means more crime, U.S. average = 301.1)
Sex Offenders
According to our data, there are 1,407 registered sex offenders living in Austin and 374 registered sex offenders living in . The ratio of residents to sex offenders in Austin is 674 to 1; the ratio in Portland is 1,710 to 1. The number of registered sex offenders compared to the number of residents is much larger in Austin than that in Portland.
Cost of Living
Living in Austin is generally more affordable than in Portland. Housing is the largest factor affecting this cost difference. While both cities have seen a rise in housing costs, Austin's housing market is still less expensive on average. Groceries, utilities, transportation, and health care also tend to be cheaper in Austin compared to Portland.
Income Tax
Neither Austin nor Texas has a state income tax, which can be financially advantageous. However, property taxes are higher than the national average. On the contrary, Oregon, and subsequently Portland, does have a high state income tax, but they do not levy any sales tax, which balances out these costs.
Property Tax
Austin has a comparably high property tax rate due to the lack of state income tax in Texas. Though this can be initially daunting, residents find it balanced out by the no state income tax policy. Portland's property taxes are on the higher side as well, with property tax rates hovering around the national average.
Sales Tax
Texas does not have a state income tax, hence Austin residents benefit from this financial relief. However, Austin has a relatively high sales tax rate. Conversely, Oregon is one of the five states in the U.S. without a sales tax, which means Portland residents and visitors enjoy tax-free shopping.
Income
Type
Austin
Portland
Estimated median household income
$79,542
$79,057
Estimated per capita income
$53,937
$49,003
Cost of living index (U.S. average is 100)
96.4
106.5
If you make $50,000 in Austin, you will have to make $55,239 in Portland to maintain the same standard of living.
Geographical Conditions
Austin is characterized by its hill country terrain, numerous lakes, and the Colorado river. It's a playground for outdoor enthusiasts, with ample opportunities for hiking, biking, boating, and swimming. Portland is nestled between the Pacific Ocean and the Cascade Mountains, offering stunning landscapes including rivers, forests, and even a dormant volcano within city limits.
Both Austin and Portland are home to highly reputable schools ranging from elementary to universities. The University of Texas at Austin is one of the largest and most esteemed universities in the U.S. Portland houses several top-ranked universities including Portland State University and the University of Portland. Both cities value education with a multitude of choices for students of all ages.
Austin has a strong job market, particularly in the tech industry, with companies like Dell, IBM, and Apple having significant presence. Portland's economy is diverse, with strong sectors in technology, manufacturing, and healthcare. Both cities have lower unemployment rates compared to the national average.
Biggest Employers
In Austin, the largest employers include Dell, the University of Texas at Austin, IBM, and Seton Healthcare Family. Portland's biggest employers encompass Intel, Providence Health & Services, Oregon Health & Science University, and Nike.
There were 4,180 building permits issued in Austin in 2012 (2467 more than in 2011) compared to 474 building permits issued in Portland in 2012 (23 more than in 2011).
In Austin (Travis County), 60.2% voted for Democrats and 36.2% for Republicans in 2012 Presidential Election. In Portland (Multnomah County), 75.4% voted for Democrats and 20.6% for Republicans.
Elections
Type
Democrats
Republicans
Other
Year
Austin
Portland
Austin
Portland
Austin
Portland
2020
71.7%
79.2%
26.5%
17.9%
1.8%
2.9%
2016
65.8%
73.3%
27.2%
17.0%
7.0%
9.7%
2012
60.2%
75.4%
36.2%
20.6%
3.6%
4.0%
2008
63.8%
76.7%
34.4%
20.6%
1.8%
2.7%
2004
56.1%
71.6%
42.1%
27.1%
1.8%
1.3%
2000
41.7%
63.8%
47.0%
28.3%
11.3%
7.9%
1996
52.4%
59.2%
40.0%
26.3%
7.7%
14.4%
Breakdown of population affiliated with a religious congregation
Type
Adherents
Congregations
Religion
Austin
Portland
Austin
Portland
CATHOLIC CHURCH
17.3%
15.2%
4.5%
6.7%
SOUTHERN BAPTIST CONVENTION
8.0%
0.5%
22.8%
3.8%
EPISCOPAL CHURCH
1.4%
0.7%
2.8%
2.2%
MUSLIM ESTIMATE
1.2%
0.3%
0.7%
1.0%
EVANGELICAL LUTHERAN CHURCH IN AMERICA
1.0%
0.9%
2.5%
4.0%
LUTHERAN CHURCH
0.9%
0.4%
2.1%
2.2%
SEVENTH DAY ADVENTIST CHURCH
0.2%
0.9%
1.0%
3.4%
AMERICAN BAPTIST CHURCHES IN THE USA
0.1%
0.8%
0.1%
2.7%
Weather
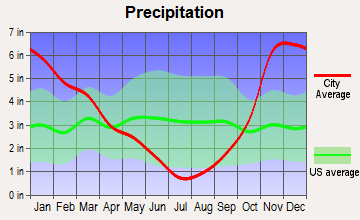
Austin's climate is best described as humid subtropical with hot summers and mild winters, favorable for outdoor activities almost all year round. On the contrary, Portland experiences a temperate oceanic climate. It has warm, dry summers and damp, cool-to-chilly winter days. The city's weather allows for a lush, verdant landscape, which is a treat for nature lovers.
Weather and climate
Type
Austin
Portland
Temperature - Average
68.5°F
53.9°F
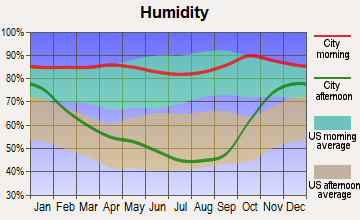
Humidity - Average morning or afternoon humidity
75.2%
76.5%
Humidity - Differences between morning and afternoon humidity
40%
42%
Humidity - Maximum monthly morning or afternoon humidity
89%
86%
Humidity - Minimum monthly morning or afternoon humidity
49%
44%
Precipitation - Yearly average
33.7 in
41.6 in
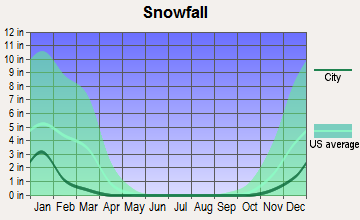
Snowfall - Yearly average
1.4 in
12.8 in
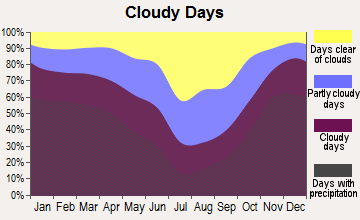
Clouds - Number of days clear of clouds
19.3%
11.3%
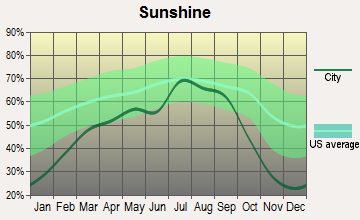
Sunshine amount - Average
63.3%
54.7%
Sunshine amount - Differences during a year
22%
52%
Sunshine amount - Maximum monthly
72%
72%
Sunshine amount - Minimum monthly
50%
20%
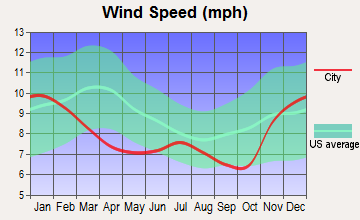
Wind speed - Average
7.2 mph
8.1 mph
Average climate in Austin, Texas
Average climate in Portland, Oregon
Air pollution
Type
AQI
CO
NO2
OZONE
PB
PM25
SO2
Year
Austin
Portland
Austin
Portland
Austin
Portland
Austin
Portland
Portland
Austin
Portland
Austin
Portland
2018
76
79
N/A
0.26
4.9
8.8
26.7
21.4
N/A
N/A
8.7
7.2
0.2
0.4
2017
76
93
N/A
0.26
4.6
8.7
29.7
22.6
N/A
N/A
8.3
7.1
0.3
0.4
2016
71
72
N/A
0.25
4.2
8.7
29.5
20.8
N/A
N/A
8.2
5.2
0.2
0.2
2015
78
91
N/A
0.28
4.4
9.2
28.9
20.1
N/A
N/A
8.6
7.4
0.3
0.5
2014
74
91
N/A
0.24
5.2
8.5
28.3
21.0
N/A
N/A
8.7
6.3
0.5
0.8
2013
78
85
0.09
0.29
5.5
9.6
29.5
17.9
N/A
N/A
8.6
8.6
0.5
1.1
2012
86
78
0.13
0.30
5.5
9.1
30.1
21.0
N/A
N/A
8.6
7.4
N/A
0.6
2011
83
89
0.11
0.34
2.6
9.4
33.0
18.5
N/A
N/A
9.1
8.1
N/A
0.8
2010
77
80
0.05
0.33
3.2
9.1
29.4
19.4
N/A
N/A
8.8
6.4
N/A
1.4
2009
76
95
0.05
0.32
2.6
10.2
29.7
20.0
N/A
N/A
9.0
8.4
N/A
1.6
2008
81
101
0.12
0.34
3.2
10.9
30.7
19.2
N/A
N/A
9.7
8.8
N/A
1.0
2007
82
101
0.12
0.35
3.1
11.4
27.1
18.1
N/A
N/A
9.8
8.8
N/A
1.3
2006
89
106
0.14
N/A
3.8
N/A
31.3
N/A
N/A
N/A
10.0
7.8
0.2
1.5
2005
92
96
0.15
N/A
4.4
N/A
29.0
N/A
N/A
N/A
10.7
8.9
0.2
1.7
2004
74
92
0.16
N/A
3.3
N/A
26.8
N/A
N/A
N/A
N/A
9.8
N/A
N/A
2003
85
77
0.26
N/A
4.2
N/A
28.9
N/A
0.008
N/A
N/A
8.6
0.1
N/A
2002
83
68
0.33
N/A
3.9
N/A
27.2
N/A
0.010
N/A
N/A
8.4
N/A
N/A
2001
83
73
0.31
N/A
4.2
N/A
25.5
N/A
0.008
N/A
N/A
8.9
N/A
N/A
2000
86
52
0.28
N/A
4.7
N/A
27.8
N/A
N/A
N/A
N/A
N/A
N/A
N/A
Natural disasters
Type
Austin
Portland
Tornado activity compared to U.S. average
137.9%
8.4%
Earthquake activity compared to U.S. average
80.4%
1,575.5%
Natural disasters compared to U.S. average
29%
9%
Transportation
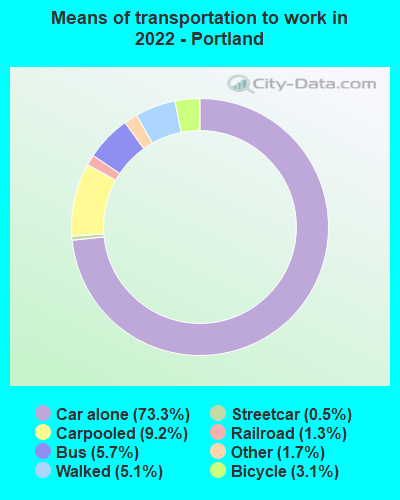
Austin provides extensive public transportation options, including Capital Metro buses and MetroRail, but the city's spread-out nature means many residents prefer cars. In Portland, public transit is highly accessible, with TriMet buses, MAX Light Rail, and Portland Streetcar connecting the city. Bicycling is extremely popular due to Portland's extensive network of bike lanes and paths.
Transport
Type
Austin
Portland
Amtrak stations
1
1
Amtrak stations nearby
1
3
FAA registered aircraft
911
804
FAA registered aircraft manufacturers and dealers
21
6
Means of transportation to work
Type
Austin
Portland
Bicycle
0.8%
3.1%
Bus
1.5%
4.6%
Carpooled
7.9%
9.4%
Car alone
85.9%
76.2%
Motorcycle
0.3%
0.2%
Railroad
0%
0.9%
Streetcar
0%
0.3%
Taxicab
0.1%
0.1%
Walked
2%
3.8%
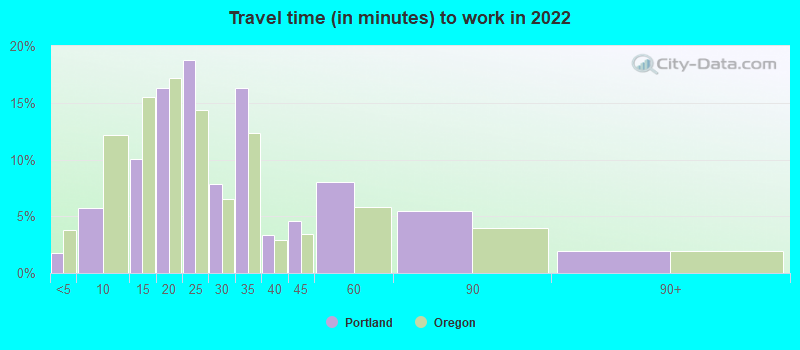
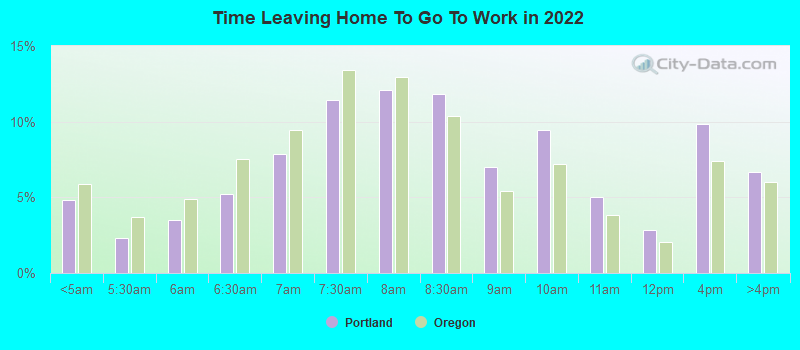
Average travel time to work
Type
Austin
Portland
Average
29.9 min
28.8 min
Other means
22.7 min
21.8 min
Public transportation
37.9 min
38.2 min
Private vehicle occupancy
Type
Austin
Portland
Average
1.1
1.2
Drove alone
91.2%
88.2%
In 2 person carpool
6.3%
8.4%
In 3 person carpool
1.7%
1.6%
In 4 person carpool
0.6%
0.8%
In 5-6 person carpool
0.1%
0.6%
In 7+ person carpool
0.2%
0.4%
How many people usually rode to work in the car, truck or van.
Real Estate
Austin's real estate market is known for its rapid growth. It’s currently a seller’s market, with the median home price above the U.S. average. Comparatively, Portland has a competitive real estate market, marked by high demand and relatively lower supply of homes. Its historic homes, condos, and eco-friendly houses offer a wide selection to buyers.
Neighborhoods
Austin's neighborhoods, like Hyde Park and Windsor Road, are characterized by leafy streets and a close-knit community vibe. East Austin is known for its thriving art scene and vibrant nightlife. Portland's neighborhoods, such as Alberta and Pearl District, are culturally diverse, featuring a mix of art galleries, boutiques, and restaurants.
Houses and residents
Type
Austin
Portland
Houses
469,156
303,483
Average household size (people)
2.4
2.3
Median year apartment built
1997
1976
Median year house/condo built
1988
1954
Length of stay in the house since moving in
12.1 years
12.1 years
Houses occupied
449,399 (95.8%)
286,734 (94.5%)
Houses occupied by owners
196,458 (43.7%)
153,121 (53.4%)
Houses occupied by renters
252,941 (56.3%)
133,613 (46.6%)
Median rent asked for vacant for-rent units
$1,286
$1,917
Median monthly housing costs
$1,521
$1,535
Median price asked for vacant for-sale houses and condos
$549,769
$248,225
Estimated median house or condo value
$482,900
$520,200
Median numbers of rooms
4.4
4.8
Median number of rooms in apartments
3.4
3.4
Median number of rooms in houses and condos
6
6.2
Median house price - detached houses
$595,996
$568,464
Median house price - in 2-unit structures
$393,984
$576,814
Median house price - in 3-to-4-unit structures
$262,826
$426,181
Median house price - in 5 or more unit structures
$576,111
$466,898
Median house price - mobile homes
$56,102
$136,996
Median house price - Townhouses or other attached units
$459,657
$416,951
Median house price - All housing units
$571,154
$544,799
Median house age
28
56
Renting percentage
54.9%
46.3%
Housing density (houses/condos per square mile)
1,865.3
2,259.4
House value disparities
28.4%
23.1%
Household income disparities
44.8%
44.7%
Median household income for houses/condes with a mortgage
$141,177
$122,948
Median household income for apartments without a mortgage
$86,430
$72,663
Housing units without a mortgage
1,799 (1.3%)
2,404 (2.2%)
Housing units with both a second mortgage and home equity loan
6,421 (4.8%)
11,239 (10.1%)
Housing units with a mortgage
132,628 (98.7%)
108,864 (97.8%)
Housing units with a home equity loan
206 (0.2%)
396 (0.4%)
Housing units with a second mortgage
8,515 (6.3%)
12,832 (11.5%)
House/condo owner moved in on average (years ago)
9
9
House/condo renter moved in on average (years ago)
1
1
Housing units lacking complete kitchen facilities
0.9%
1.2%
Housing units lacking complete plumbing facilities
0.6%
0.9%
Housing units in structures
Housing units in structures
Austin
Portland
One, detached
43.1%
53.3%
One, attached
5.2%
5.7%
Two
2.4%
3.5%
3 or 4
4.1%
4.5%
5 to 9
7.2%
4.0%
10 to 19
11.0%
4.7%
20 to 49
8.9%
6.6%
50 or more
17.2%
16.2%
Mobile homes
1.0%
1.2%
Boats, RVs, vans, etc.
0.0%
0.3%
Median real estate property taxes paid for housing units
Self-employed workers in own not incorporated business
38,777
25,437
State government workers
46,229
15,615
Unpaid family workers
102
688
Industries and Occupations
The leading industries in Austin include technology, pharmaceuticals, biotechnology, film and entertainment, and manufacturing. Its fast-growing tech scene has led to the city being dubbed "Silicon Hills". Portland has a diverse range of industries, prominent ones being technology, apparel, metals, and manufacturing. It’s a hub for the athletic and outdoor industry, hosting global headquarters for companies like Nike and Columbia Sportswear.
Austin offers excellent healthcare services, and it ranks high in the nation for healthcare accessibility. Some renowned health centers include Ascension Seton, Baylor Scott & White Health, and St. David's Healthcare. Portland equally prides itself on high-quality healthcare, with notable health facilities being Providence St. Vincent Medical Center and Oregon Health & Science University Hospital.
Health (county statistics)
Type
Austin
Portland
General health status score of residents in this county from 1 (poor) to 5 (excellent)
Austin boasts robust and well-developed infrastructure, with continuous improvements making it a smart city. Austin Bergstrom International Airport, the Port of Austin, major highways, and bridges contribute to its infrastructure strength. Portland also has an advanced infrastructure, characterized by its extensive transit system, well-maintained roads, bridges, and a strong commitment to sustainable practices.
Infrastructure
Type
Austin
Portland
Hospitals
65
21
TV stations
20
18
Arenas or stadiums
2
3
Bank branches located here
264
208
Bank institutions located here
43
30
Main business address for public companies
44
32
Drinking water stations with no reported violations in the past
46
2
Drinking water stations with reported violations in the past
HMDA - Conventional home purchase loans - Applications denied
Year
Austin
Portland
1999
4,733
1,922
2000
2,950
1,651
2001
2,038
1,193
2002
1,772
1,235
2003
2,213
1,844
2004
2,458
2,651
2005
3,121
3,396
2006
3,367
3,510
2007
2,560
3,008
2008
1,747
1,465
2009
1,067
712
Culture and Food
Austin's vibrant Texan culture is showcased in its numerous music festivals and delicious blend of Tex-Mex and barbecue cuisine. The city has a bustling nightlife, with live music being a major draw. Portland is renowned for its arts scene, indie music, thriving craft beer industry, and food cart culture, offering a diverse range of cuisines across the city.
Sports Teams
Austin is home to the University of Texas' Longhorns college football team and recently welcomed its first Major League Soccer team, Austin FC. Portland is passionate about its professional soccer team, the Timbers, and proudly supports NBA's Trail Blazers and the Thorns, the women's soccer team.


 Austin, TX
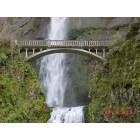
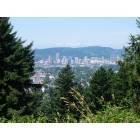
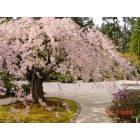
 Portland, OR