Austin, TX and South Coast, CA are popular destinations for both residents and tourists alike, each offering their own unique blend of individual attributes. Comparing them spans numerous factors including crime and safety, weather conditions, cost of living, education, and more. Given the distinct features and characteristics, it’s critical to comprehensively analyze each city to make an informed decision, whether it's for settling down or just vacationing.
Austin's crime rate is slightly higher than the national average, but it's important to note the city's size and population density. Certain neighborhoods see higher crime rates than others. When compared to South Coast, CA, crime patterns are similar but overall, South Coast displays lower crime rates and is considered safer.
Cost of Living
The cost of living in Austin is significantly lower than in South Coast. Austin still maintains affordable housing options, groceries, and other living expenses compared to other major cities in the US. South Coast, on the other hand, is one of the most expensive places to live in the USA.
Income Tax
Residents of Austin, due to Texas state law, do not need to pay state income tax. Residents living in South Coast, CA, face one of the highest income tax rates in the country.
Property Tax
Property taxes are more burdensome in Austin than in South Coast. However, due to the high property values in South Coast, homeowners might end up paying more in property taxes here.
Sales Tax
Texas, and thus Austin, does not have a state income tax but does have a high sales tax rate. California has both state income and sales taxes, making it one of the higher tax burden states.
Income
Type
Austin
South Coast
Estimated median household income
$79,542
$112,870
Estimated per capita income
$53,937
$68,453
Cost of living index (U.S. average is 100)
96.4
96.8
If you make $50,000 in Austin, you will have to make $50,207 in South Coast to maintain the same standard of living.
Geographical Conditions
Both cities have attractive geographical features. Austin has the Texas Hill Country, and South Coast has beautiful sandy beaches. Each city offers several outdoor activities for residents and visitors.
Geographical information
Type
Austin
South Coast
Land area
251.5 sq. miles
101 sq. miles
Population density
3,833.4 people per sq. mile
2,953.2 people per sq. mile
Relative area comparison
Austin, TX South Coast, CA
Education
Both Austin and South Coast offer high-quality education. Austin is home to the renowned University of Texas and other highly ranked public and private schools. South Coast has top-notch school districts and is proximate to prestigious universities like University of California, Irvine.
Austin is known as a tech hub nicknamed "Silicon Hills" with a thriving job market. South Coast's economy is diverse with a strong presence in healthcare, education, and tourism. Both boast low unemployment rates compared to national averages.
Biggest Employers
Austin’s largest employers include Dell, IBM, the University of Texas, and Whole Foods. In South Coast, top employers include Hoag Hospital, PIMCO, and Pacific Life.
In Austin (Travis County), 60.2% voted for Democrats and 36.2% for Republicans in 2012 Presidential Election. In South Coast (Orange County), 45.8% voted for Democrats and 52.0% for Republicans.
Elections
Type
Democrats
Republicans
Other
Year
Austin
South Coast
Austin
South Coast
Austin
South Coast
2020
71.7%
53.6%
26.5%
44.6%
1.8%
1.8%
2016
65.8%
50.9%
27.2%
42.4%
7.0%
6.7%
2012
60.2%
45.8%
36.2%
52.0%
3.6%
2.3%
2008
63.8%
47.8%
34.4%
50.3%
1.8%
1.9%
2004
56.1%
39.3%
42.1%
60.2%
1.8%
0.5%
2000
41.7%
40.4%
47.0%
55.9%
11.3%
3.7%
1996
52.4%
37.9%
40.0%
51.7%
7.7%
10.5%
Breakdown of population affiliated with a religious congregation
Type
Adherents
Congregations
Religion
Austin
South Coast
Austin
South Coast
CATHOLIC CHURCH
17.3%
26.5%
4.5%
4.4%
SOUTHERN BAPTIST CONVENTION
8.0%
2.3%
22.8%
8.8%
EPISCOPAL CHURCH
1.4%
0.4%
2.8%
1.4%
MUSLIM ESTIMATE
1.2%
0.8%
0.7%
1.3%
EVANGELICAL LUTHERAN CHURCH IN AMERICA
1.0%
0.4%
2.5%
2.3%
LUTHERAN CHURCH
0.9%
0.6%
2.1%
2.0%
SEVENTH DAY ADVENTIST CHURCH
0.2%
0.4%
1.0%
1.3%
REFORMED CHURCH IN AMERICA
0.0%
0.3%
0.0%
0.2%
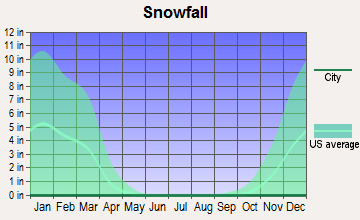
Weather
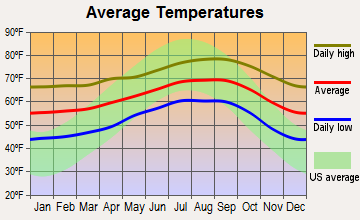
Weather is a major factor to consider when comparing Austin and South Coast. Austin experiences hot summers and mild winters. South Coast boasts a Mediterranean climate, with mild, wet winters and warm, dry summers. People seeking year-round mild temperatures may steer towards South Coast.
Weather and climate
Type
Austin
South Coast
Temperature - Average
68.5°F
62.1°F
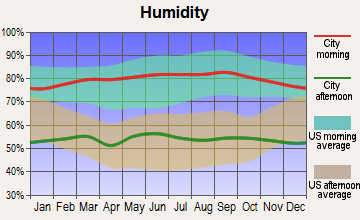
Humidity - Average morning or afternoon humidity
75.2%
69.1%
Humidity - Differences between morning and afternoon humidity
40%
24.6%
Humidity - Maximum monthly morning or afternoon humidity
89%
77%
Humidity - Minimum monthly morning or afternoon humidity
49%
52.4%
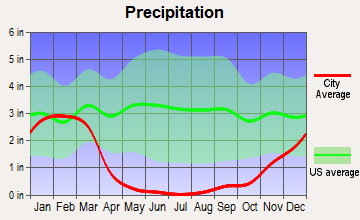
Precipitation - Yearly average
33.7 in
13.4 in
Snowfall - Yearly average
1.4 in
0 in
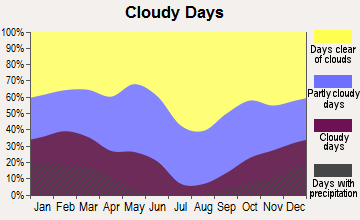
Clouds - Number of days clear of clouds
19.3%
26.7%
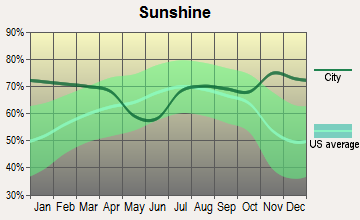
Sunshine amount - Average
63.3%
77.6%
Sunshine amount - Differences during a year
22%
20.5%
Sunshine amount - Maximum monthly
72%
81.9%
Sunshine amount - Minimum monthly
50%
61.4%
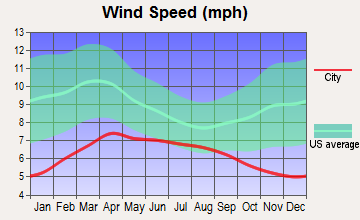
Wind speed - Average
7.2 mph
5.5 mph
Average climate in Austin, Texas
Average climate in South Coast, California
Air pollution
Type
AQI
CO
NO2
OZONE
PM10
PM25
SO2
Year
Austin
South Coast
Austin
South Coast
Austin
South Coast
Austin
South Coast
South Coast
Austin
South Coast
Austin
South Coast
2018
76
105
N/A
0.18
4.9
8.6
26.7
34.0
22.7
N/A
8.7
7.0
0.2
N/A
2017
76
111
N/A
0.21
4.6
8.4
29.7
34.7
23.0
N/A
8.3
11.3
0.3
N/A
2016
71
105
N/A
0.14
4.2
9.6
29.5
33.8
21.9
N/A
8.2
9.8
0.2
0.1
2015
78
111
N/A
0.10
4.4
10.5
28.9
32.9
19.4
N/A
8.6
10.5
0.3
0.1
2014
74
100
N/A
0.11
5.2
9.8
28.3
31.3
25.4
N/A
8.7
11.8
0.5
0.3
2013
78
97
0.09
0.17
5.5
10.6
29.5
30.0
24.5
N/A
8.6
10.3
0.5
0.2
2012
86
101
0.13
0.26
5.5
10.1
30.1
29.9
21.5
N/A
8.6
10.5
N/A
0.1
2011
83
113
0.11
0.15
2.6
10.2
33.0
30.3
24.0
N/A
9.1
10.9
N/A
0.3
2010
77
101
0.05
0.21
3.2
10.9
29.4
30.6
23.3
N/A
8.8
11.4
N/A
0.6
2009
76
120
0.05
0.15
2.6
13.0
29.7
31.5
27.3
N/A
9.0
12.4
N/A
1.1
2008
81
131
0.12
0.26
3.2
13.2
30.7
32.0
38.8
N/A
9.7
9.4
N/A
1.1
2007
82
110
0.12
0.24
3.1
13.7
27.1
30.6
N/A
N/A
9.8
N/A
N/A
0.8
2006
89
112
0.14
0.30
3.8
14.8
31.3
30.6
N/A
N/A
10.0
N/A
0.2
1.3
2005
92
109
0.15
0.28
4.4
13.7
29.0
29.9
N/A
N/A
10.7
N/A
0.2
1.3
2004
74
130
0.16
0.29
3.3
15.5
26.8
32.5
N/A
N/A
N/A
N/A
N/A
1.6
2003
85
132
0.26
0.38
4.2
18.2
28.9
31.3
N/A
N/A
N/A
N/A
0.1
1.1
2002
83
129
0.33
0.40
3.9
17.7
27.2
28.4
N/A
N/A
N/A
N/A
N/A
1.6
2001
83
137
0.31
0.52
4.2
18.5
25.5
27.8
N/A
N/A
N/A
N/A
N/A
1.4
2000
86
140
0.28
0.52
4.7
21.2
27.8
24.5
N/A
N/A
N/A
N/A
N/A
1.9
Natural disasters
Type
Austin
South Coast
Tornado activity compared to U.S. average
137.9%
17.1%
Earthquake activity compared to U.S. average
80.4%
6,728.5%
Natural disasters compared to U.S. average
29%
32%
Transportation
Austin offers public transportation through Capital Metro while South Coast provides OCTA bus services and Metrolink train service. Both cities are car-centric though efforts are being made to increase walkability and biking.
Transport
Type
Austin
South Coast
Amtrak stations
1
0
Amtrak stations nearby
1
3
FAA registered aircraft
911
0
FAA registered aircraft manufacturers and dealers
21
0
Means of transportation to work
Type
Austin
South Coast
Bicycle
0.8%
0.3%
Bus
1.5%
1%
Carpooled
7.9%
10.5%
Car alone
85.9%
79.2%
Motorcycle
0.3%
0.2%
Railroad
0%
0.4%
Taxicab
0.1%
0%
Walked
2%
1.7%
Average travel time to work
Type
Austin
South Coast
Average
29.9 min
27.9 min
Real Estate
Real estate prices in Austin are on the rise but remain lower than in South Coast where property prices are significantly high. Both markets are competitive with properties often selling quickly.
Neighborhoods
Austin has diverse neighborhoods, from the downtown hustle to quieter suburban areas. South Coast possesses exclusive oceanfront communities and suburban neighborhoods well-suited for families.
Houses and residents
Type
Austin
South Coast
Houses
469,156
124,031
Average household size (people)
2.4
2.5
Houses occupied
449,399 (95.8%)
117,093 (94.4%)
Houses occupied by owners
196,458 (43.7%)
81,601 (69.7%)
Houses occupied by renters
252,941 (56.3%)
35,492 (30.3%)
Median rent asked for vacant for-rent units
$1,286
$2,718
Median price asked for vacant for-sale houses and condos
$549,769
$1,099,558
Estimated median house or condo value
$482,900
Over $1,000,000
Median number of rooms in apartments
3.4
3.9
Median number of rooms in houses and condos
6
5.1
Renting percentage
54.9%
33.8%
Housing density (houses/condos per square mile)
1,865.3
1,227.5
Household income disparities
44.8%
38.1%
Housing units without a mortgage
1,799 (1.3%)
10,715 (16.4%)
Housing units with both a second mortgage and home equity loan
6,421 (4.8%)
248 (0.4%)
Housing units with a mortgage
132,628 (98.7%)
54,674 (83.6%)
Housing units with a home equity loan
206 (0.2%)
5,859 (9%)
Housing units with a second mortgage
8,515 (6.3%)
7,560 (11.6%)
Housing units lacking complete kitchen facilities
0.9%
0.8%
Housing units lacking complete plumbing facilities
Self-employed workers in own not incorporated business
38,777
17,244
State government workers
46,229
4,403
Unpaid family workers
102
640
Industries and Occupations
Austin is notable for its tech, music, film, and startup industries. South Coast supports diverse sectors such as healthcare, education, retail, and tourism. Both offer ample job opportunities in the respective industries.
Both Austin and South Coast have excellent healthcare facilities, with Austin's St. David's HealthCare and South Coast's Hoag Hospital being some of the top healthcare providers.
Health (county statistics)
Type
Austin
South Coast
General health status score of residents in this county from 1 (poor) to 5 (excellent)
Austin's infrastructure continues to improve with the city's growth, supporting an expanding tech industry and population. South Coast, known for its well-maintained roads and facilities, benefits from California's significant investments in infrastructure.
Infrastructure
Type
Austin
South Coast
TV stations
20
1
Nuclear power plants nearby
0
2
Culture and Food
Austin is known for its lively music scene, large-scale festivals like SXSW, and delicious Tex-Mex and BBQ. South Coast, rich in beach culture, offers a wide variety of international cuisine due to its diverse population.
Sports Teams
Austin’s sports scene is dominated by college sports, especially the Texas Longhorns. South Coast supports teams from nearby Los Angeles, like the Lakers, Clippers, Angels, and Ducks.
 Austin, TX
 South Coast, CA