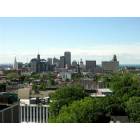
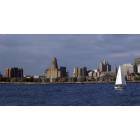
When determining whether Baltimore, MD or Buffalo, NY is a better fit for you, there are numerous factors to consider. From the cost of living and education, to culture and sports, both cities have unique advantages and drawbacks. This comprehensive comparison looks at key areas like crime, weather, taxes, and healthcare, in order to paint a clearer picture of what both cities have to offer to residents and visitors alike.
Distance between
Baltimore, MD and
Buffalo, NY : 274.3 miles
Baltimore's population is larger by 108%. Its population has decreased by 74,656 people (11.5%) since 2000. The population of Buffalo has decreased by 15,841 people (5.4%) during that time.
Baltimore has had high crime rates in past years, although city officials have been making efforts to reduce crime. This city has an ongoing problem with violent crimes, particularly in specific neighborhoods. In contrast, Buffalo's crime rate is lower than Baltimore's, but still above the national average. Both cities have certain neighborhoods known for their relative safety. Tourists in both cities should stay in the safer areas and avoid poorly lit, deserted places at night.
City-data.com crime index counts serious crimes and violent crime more heavily. It adjusts for the number of visitors and daily workers commuting into cities. (higher means more crime, U.S. average = 301.1)
City-data.com crime index counts serious crimes and violent crime more heavily. It adjusts for the number of visitors and daily workers commuting into cities. (higher means more crime, U.S. average = 301.1)
Sex Offenders
According to our data, there are 1,558 registered sex offenders living in Baltimore and 720 registered sex offenders living in . The ratio of residents to sex offenders in Baltimore is 395 to 1; the ratio in Buffalo is 357 to 1. The number of registered sex offenders compared to the number of residents in Baltimore is near to than in Buffalo.
Cost of Living
The cost of living in Baltimore is significantly higher than in Buffalo. A large part of this is due to housing costs. However, Baltimore has a higher median household income which can offset its higher cost of living. Buffalo, on the other hand, boasts one of the lowest costs of living in New York State and has an up-and-coming economy.
Income Tax
Baltimore has a city income tax rate of 2.25%, while Maryland's state income tax ranges from 2% - 5.75%. Buffalo doesn't have a city income tax, though the New York state income tax ranges from 4% to 8.82%.
Property Tax
Baltimore has a city property tax rate of 2.248%, while Maryland's average is 0.87%. Buffalo city's property tax rate is 1.77%, and the New York state average is 1.69%.
Sales Tax
Baltimore has a city sales tax rate of 6%. Buffalo, in contrast, has a combined state and county sales tax rate of 8.75%.
Income
Type
Baltimore
Buffalo
Estimated median household income
$54,652
$40,669
Estimated per capita income
$35,091
$27,269
Cost of living index (U.S. average is 100)
105.7
101.9
If you make $50,000 in Buffalo, you will have to make $51,865 in Baltimore to maintain the same standard of living.
Geographical Conditions
Baltimore is located on the Chesapeake Bay, offering water-related activities, while Buffalo is located on the eastern shores of Lake Erie and near the Niagara Falls, also offering various water-related activities.
Both Baltimore and Buffalo have good educational institutions. Baltimore is home to Johns Hopkins University, a world-renowned research university, while Buffalo is home to the State University of New York at Buffalo. In terms of public schools, both cities struggle with performance and funding issues, though there are standout schools in both areas.
Baltimore has a mixed economy, with strong education, healthcare, and tech sectors. The city’s proximity to Washington D.C. also opens doors for government-related work. Buffalo's economy has massively diversified in recent years, with emphases in healthcare, education, and technology.
Biggest Employers
Top employers in Baltimore include Johns Hopkins University and Hospital, University of Maryland Medical Center, and Northrop Grumman. In Buffalo, Kaleida Health, the State University of New York at Buffalo, and M&T Bank lead the jobs market.
There were 191 building permits issued in Baltimore in 2012 (116 more than in 2011) compared to 35 building permits issued in Buffalo in 2012 (29 more than in 2011).
In Baltimore (Baltimore city), 87.4% voted for Democrats and 11.1% for Republicans in 2012 Presidential Election. In Buffalo (Erie County), 57.4% voted for Democrats and 41.0% for Republicans.
Elections
Type
Democrats
Republicans
Other
Year
Baltimore
Buffalo
Baltimore
Buffalo
Baltimore
Buffalo
2020
87.5%
56.3%
10.7%
41.6%
1.8%
2.1%
2016
84.8%
51.0%
10.5%
44.5%
4.6%
4.5%
2012
87.4%
57.4%
11.1%
41.0%
1.4%
1.6%
2008
87.6%
58.2%
11.7%
40.6%
0.6%
1.3%
2004
82.5%
56.5%
17.1%
41.5%
0.5%
1.9%
2000
82.9%
56.7%
14.2%
37.8%
2.9%
5.5%
1996
79.3%
54.7%
15.5%
32.3%
5.1%
13.0%
Breakdown of population affiliated with a religious congregation
Type
Adherents
Congregations
Religion
Baltimore
Buffalo
Baltimore
Buffalo
CATHOLIC CHURCH
11.0%
38.4%
8.2%
15.8%
EPISCOPAL CHURCH
1.6%
0.8%
4.0%
4.4%
AMERICAN BAPTIST CHURCHES IN THE USA
1.4%
0.8%
2.2%
3.6%
SOUTHERN BAPTIST CONVENTION
1.4%
0.2%
7.3%
2.5%
EVANGELICAL LUTHERAN CHURCH IN AMERICA
1.0%
1.7%
4.3%
4.9%
MUSLIM ESTIMATE
0.6%
1.8%
1.5%
1.9%
SEVENTH DAY ADVENTIST CHURCH
0.5%
0.1%
1.5%
0.6%
LUTHERAN CHURCH
0.4%
0.9%
1.8%
3.3%
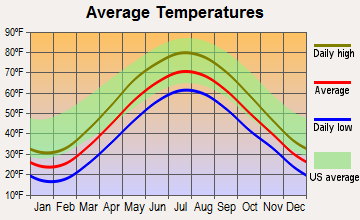
Weather
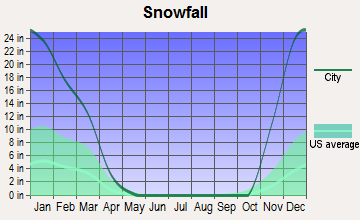
Baltimore has a humid subtropical climate, so summers can be hot and humid, while winters are usually mild. Buffalo is known for its cold, snowy winters. Located in the snow belt, Buffalo gets an average of 95 inches of snow each winter. Summertime in Buffalo offers pleasant temperatures, but is very short.
Weather and climate
Type
Baltimore
Buffalo
Temperature - Average
54.5°F
47.7°F
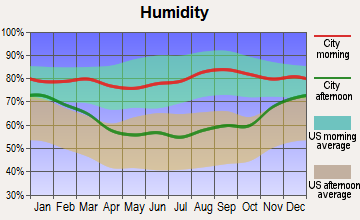
Humidity - Average morning or afternoon humidity
70.4%
76.3%
Humidity - Differences between morning and afternoon humidity
36%
28%
Humidity - Maximum monthly morning or afternoon humidity
84%
83%
Humidity - Minimum monthly morning or afternoon humidity
48%
55%
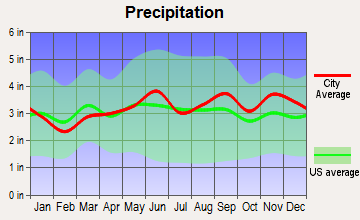
Precipitation - Yearly average
42.9 in
38.7 in
Snowfall - Yearly average
39.6 in
183.7 in
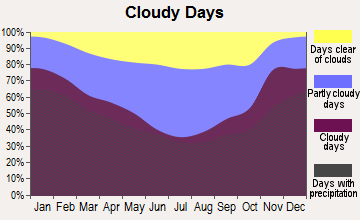
Clouds - Number of days clear of clouds
17.5%
8.9%
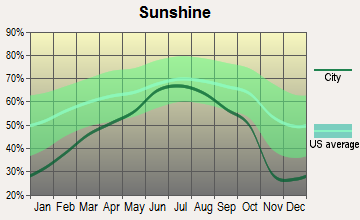
Sunshine amount - Average
60.3%
51.3%
Sunshine amount - Differences during a year
16%
43%
Sunshine amount - Maximum monthly
63%
66%
Sunshine amount - Minimum monthly
47%
23%
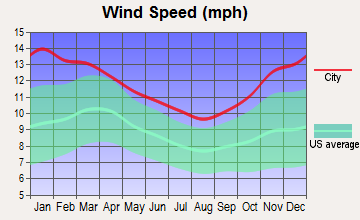
Wind speed - Average
7.9 mph
11.2 mph
Average climate in Baltimore, Maryland
Average climate in Buffalo, New York
Air pollution
Type
AQI
CO
NO2
OZONE
PB
PM10
PM25
SO2
Year
Baltimore
Buffalo
Baltimore
Buffalo
Baltimore
Buffalo
Baltimore
Buffalo
Buffalo
Baltimore
Baltimore
Buffalo
Baltimore
Buffalo
2018
89
62
0.23
0.26
11.8
N/A
28.3
30.2
N/A
N/A
N/A
N/A
7.9
7.5
0.1
0.4
2017
89
68
0.25
0.32
12.1
N/A
27.7
29.8
N/A
N/A
N/A
N/A
8.2
7.5
0.2
0.4
2016
102
71
0.26
0.30
13.0
N/A
28.3
31.7
N/A
N/A
N/A
N/A
7.7
7.7
0.3
0.5
2015
89
69
0.28
0.35
12.4
N/A
28.3
30.2
N/A
N/A
N/A
N/A
9.5
8.8
0.4
1.1
2014
82
69
0.25
0.39
11.8
N/A
25.7
30.7
N/A
N/A
N/A
N/A
10.9
8.6
0.6
1.5
2013
86
73
0.22
0.33
10.7
N/A
25.6
31.4
N/A
N/A
N/A
N/A
9.6
9.0
0.5
2.4
2012
98
83
0.24
0.34
11.3
6.4
25.0
30.5
N/A
N/A
N/A
N/A
11.2
9.4
0.5
2.7
2011
101
82
0.24
0.41
12.5
8.3
25.1
28.8
N/A
N/A
N/A
N/A
12.1
8.9
0.8
2.0
2010
110
85
0.24
0.35
13.1
8.3
26.9
30.6
N/A
N/A
N/A
N/A
12.2
10.3
1.0
1.5
2009
84
78
0.23
0.28
12.2
7.4
23.5
28.7
N/A
N/A
N/A
N/A
10.4
9.8
1.4
1.7
2008
96
90
0.25
0.36
13.6
9.5
21.6
29.5
N/A
N/A
N/A
N/A
12.8
11.4
1.8
2.3
2007
107
97
0.21
0.38
13.8
10.2
23.2
29.5
N/A
N/A
N/A
N/A
14.0
12.4
2.5
2.7
2006
112
76
N/A
0.38
12.0
10.5
24.6
27.4
N/A
N/A
N/A
N/A
14.7
N/A
N/A
2.8
2005
111
94
N/A
0.41
14.3
12.3
26.3
29.7
N/A
N/A
23.0
N/A
17.1
N/A
N/A
3.8
2004
108
76
N/A
0.43
15.3
11.9
28.0
27.6
N/A
N/A
23.1
N/A
16.3
N/A
N/A
3.4
2003
110
89
N/A
0.50
17.8
13.0
22.4
27.6
0.005
N/A
N/A
N/A
13.9
N/A
N/A
5.5
2002
119
100
N/A
0.46
17.4
13.4
19.4
30.5
0.008
N/A
N/A
N/A
16.3
N/A
5.8
5.8
2001
104
93
N/A
0.46
18.2
15.2
23.9
27.9
0.021
N/A
N/A
N/A
N/A
N/A
6.0
7.2
2000
101
85
N/A
0.53
17.0
15.3
22.4
25.6
0.023
N/A
N/A
N/A
N/A
N/A
6.3
6.8
Natural disasters
Type
Baltimore
Buffalo
Tornado activity compared to U.S. average
117.8%
26.3%
Earthquake activity compared to U.S. average
40.6%
32.9%
Natural disasters compared to U.S. average
0%
22%
Transportation
Baltimore has an extensive public transportation system including buses, light rail, and a subway line, although its reliability is often criticized. Buffalo's public transit system consists mainly of buses and light rail transit, but also suffers from reliability issues.
Transport
Type
Baltimore
Buffalo
Amtrak stations
2
0
Amtrak stations nearby
2
3
FAA registered aircraft
136
87
FAA registered aircraft manufacturers and dealers
2
1
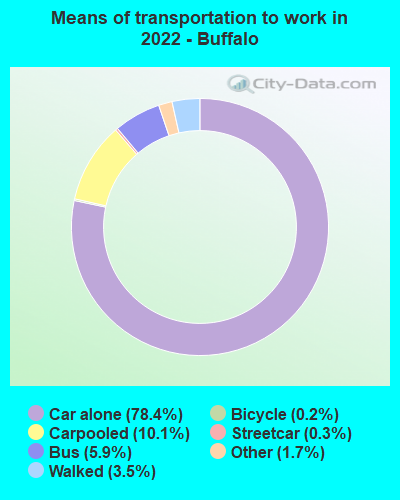
Means of transportation to work
Type
Baltimore
Buffalo
Bicycle
0.4%
0.5%
Bus
6.2%
5.8%
Carpooled
7.3%
7.8%
Car alone
77.2%
80.5%
Railroad
0.3%
0.2%
Streetcar
1.2%
0.3%
Subway
0.2%
0.6%
Taxicab
0.7%
0.3%
Walked
4.5%
3.1%
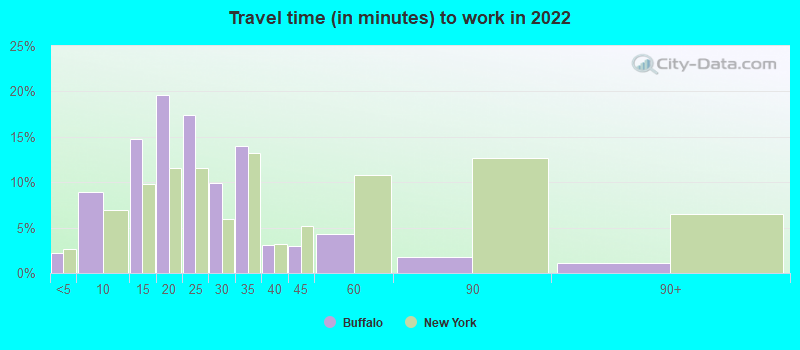
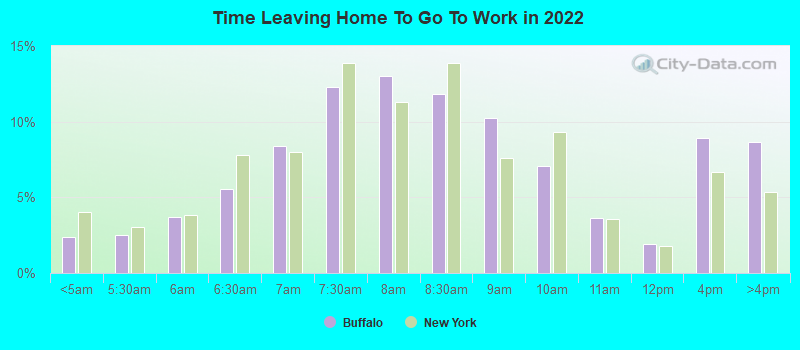
Average travel time to work
Type
Baltimore
Buffalo
Average
32.3 min
23.8 min
Other means
26.3 min
19.9 min
Public transportation
46.8 min
36.6 min
Private vehicle occupancy
Type
Baltimore
Buffalo
Average
1.1
1.1
Drove alone
90.7%
89.9%
In 2 person carpool
7.5%
6.9%
In 3 person carpool
1%
2.6%
In 4 person carpool
0.4%
0.3%
In 5-6 person carpool
0.3%
0.2%
In 7+ person carpool
0.2%
0.1%
How many people usually rode to work in the car, truck or van.
Real Estate
Baltimore's real estate market is more expensive than Buffalo's, in part due to its proximity to Washington, D.C. Buffalo's real estate market has seen improvements in recent years and offers more affordable pricing.
Neighborhoods
Baltimore neighborhoods like Federal Hill, Canton, and Fells Point are popular, while Buffalo's Elmwood Village, Allentown, and North Buffalo have their own charms. Yet, both the cities have areas that struggle with crime.
Houses and residents
Type
Baltimore
Buffalo
Houses
293,487
137,222
Average household size (people)
2.4
2.2
Length of stay in the house since moving in
15.7 years
15.8 years
Houses occupied
254,370 (86.7%)
122,569 (89.3%)
Houses occupied by owners
123,249 (48.5%)
54,108 (44.1%)
Houses occupied by renters
131,121 (51.5%)
68,461 (55.9%)
Median rent asked for vacant for-rent units
$1,254
$372.33
Median monthly housing costs
$1,196
$812
Median price asked for vacant for-sale houses and condos
$207,303
$283,454
Estimated median house or condo value
$193,100
$155,200
Median numbers of rooms
5.6
5.6
Median number of rooms in apartments
4.2
4.9
Median number of rooms in houses and condos
6.5
6.5
Median house price - detached houses
$321,473
$160,989
Median house price - in 2-unit structures
$218,934
$176,595
Median house price - in 3-to-4-unit structures
$142,945
$166,381
Median house price - in 5 or more unit structures
$257,173
$451,923
Median house price - mobile homes
$269,877
$51,009
Median house price - Townhouses or other attached units
$210,096
$280,424
Median house price - All housing units
$246,241
$172,704
Median house age
72
2,021
Renting percentage
52.3%
59.3%
Housing density (houses/condos per square mile)
3,632.1
3,378.8
House value disparities
38.5%
44.5%
Household income disparities
49.4%
50.4%
Median household income for houses/condes with a mortgage
$85,990
$78,318
Median household income for apartments without a mortgage
$53,334
$50,382
Housing units without a mortgage
2,415 (2.8%)
2,243 (7.7%)
Housing units with both a second mortgage and home equity loan
5,740 (6.6%)
1,953 (6.7%)
Housing units with a mortgage
84,578 (97.2%)
26,930 (92.3%)
Housing units with a home equity loan
579 (0.7%)
69 (0.2%)
Housing units with a second mortgage
8,544 (9.8%)
2,377 (8.1%)
House/condo owner moved in on average (years ago)
14
16
House/condo renter moved in on average (years ago)
3
3
Housing units lacking complete kitchen facilities
6%
5.5%
Housing units lacking complete plumbing facilities
5.1%
1.9%
Housing units in structures
Housing units in structures
Baltimore
Buffalo
One, detached
16.4%
39.4%
One, attached
49.5%
2.7%
Two
4.5%
34.2%
3 or 4
4.9%
8.0%
5 to 9
5.5%
3.3%
10 to 19
4.8%
2.6%
20 to 49
2.8%
3.4%
50 or more
11.4%
6.1%
Mobile homes
0.2%
0.0%
Boats, RVs, vans, etc.
0.1%
0.2%
Median real estate property taxes paid for housing units
Self-employed workers in own not incorporated business
12,671
5,576
State government workers
20,410
6,135
Unpaid family workers
356
313
Industries and Occupations
Baltimore has a diverse economy with healthcare, education, and government being the top three employers. Buffalo has been transitioning from a manufacturing-based economy to one centered on healthcare and education.
Baltimore is known for excellent healthcare facilities, including Johns Hopkins Hospital. Buffalo has several reputable healthcare systems, including the Roswell Park Comprehensive Cancer Center.
Health (county statistics)
Type
Baltimore
Buffalo
General health status score of residents in this county from 1 (poor) to 5 (excellent)
Baltimore's infrastructure is older and has experienced problems requiring major repairs, although significant improvements have been made. Buffalo also has an aging infrastructure but has seen substantial investments in modernizing its cityscape, particularly its waterfront.
Infrastructure
Type
Baltimore
Buffalo
Hospitals
45
15
TV stations
19
14
Arenas or stadiums
3
2
Bank branches located here
215
69
Bank institutions located here
44
10
Main business address for public companies
27
6
Drinking water stations with no reported violations in the past
13
4
Drinking water stations with reported violations in the past
HMDA - Conventional home purchase loans - Applications denied
Year
Baltimore
Buffalo
1999
2,486
426
2000
2,058
620
2001
1,371
559
2002
1,111
407
2003
1,526
335
2004
2,929
468
2005
4,981
447
2006
5,533
701
2007
3,592
619
2008
1,111
316
2009
381
105
Culture and Food
Both Baltimore and Buffalo have vibrant cultural scenes. Baltimore is famed for its seafood, particularly steamed crabs, while Buffalo is renowned for its namesake Buffalo wings. Both cities also have good music and art scenes.
Sports Teams
Baltimore is home to the Baltimore Ravens (NFL) and the Baltimore Orioles (MLB). Buffalo boasts the Buffalo Bills (NFL) and the Buffalo Sabres (NHL).


 Baltimore, MD
 Buffalo, NY