Baltimore, Maryland and Cleveland, Ohio, both are significant and influential cities in the United States, offering distinct lifestyles, cultures, and economic opportunities. Carefully comparing key aspects such as crime and safety, weather, cost of living, education, and more can provide valuable insights for individuals considering relocation or tourists planning a visit. Each city has its unique characteristics and advantages, bringing different experiences for residents and visitors alike.
Distance between
Baltimore, MD and
Cleveland, OH : 305.3 miles
Baltimore's population is larger by 57%. Its population has decreased by 74,656 people (11.5%) since 2000. The population of Cleveland has decreased by 110,412 people (23.1%) during that time.
Crime rates in Baltimore tend to be higher than in Cleveland; Baltimore has struggled with violent crime for years. However, both cities have areas safer than others. Awareness of their surroundings and taking safety precautions, particularly at night, is advised for both residents and visitors.
City-data.com crime index counts serious crimes and violent crime more heavily. It adjusts for the number of visitors and daily workers commuting into cities. (higher means more crime, U.S. average = 301.1)
City-data.com crime index counts serious crimes and violent crime more heavily. It adjusts for the number of visitors and daily workers commuting into cities. (higher means more crime, U.S. average = 301.1)
Sex Offenders
According to our data, there are 1,558 registered sex offenders living in Baltimore and 1,976 registered sex offenders living in . The ratio of residents to sex offenders in Baltimore is 395 to 1; the ratio in Cleveland is 195 to 1. The number of registered sex offenders compared to the number of residents is a smaller in Baltimore than in Cleveland.
Cost of Living
The cost of living in Baltimore is slightly higher than in Cleveland. Housing stands as the most significant difference, while grocery prices, healthcare, and utilities are quite comparable.
Income Tax
Maryland's state income tax rate ranges from 2% to 5.75%, while Ohio's ranges from 0% to 4.797%. Both cities also have additional local income taxes.
Property Tax
Property taxes are higher in Baltimore than in Cleveland. Baltimore homeowners can expect to pay around 2.248% while in Cleveland the rates can vary from 1.55% to 2.39%.
Sales Tax
Sales tax in Baltimore is lower than in Cleveland. Maryland's statewide sales tax rate is 6%, while Ohio's is 5.75%, with additional county and city taxes pushing Cleveland's rate to around 8%.
Income
Type
Baltimore
Cleveland
Estimated median household income
$54,652
$35,562
Estimated per capita income
$35,091
$24,093
Cost of living index (U.S. average is 100)
105.7
94.3
If you make $50,000 in Cleveland, you will have to make $56,045 in Baltimore to maintain the same standard of living.
Geographical Conditions
Baltimore has a coastal location, with the Chesapeake Bay and Atlantic Ocean nearby, which offers opportunities for water activities. Cleveland is located on the shores of the Great Lakes, which also provides water-based activities.
Both cities have quality education options. Baltimore is home to top educational institutions like Johns Hopkins University, while Cleveland houses Case Western Reserve University. Public schools in both cities have had their challenges, but there are various private and charter school options available.
Both cities have diverse economies but differ significantly in their primary sectors. Baltimore has a strong focus on healthcare, with Johns Hopkins Hospital being one of the city's largest employers, while Cleveland has a stronger manufacturing sector.
Biggest Employers
In Baltimore, some of the biggest employers include Johns Hopkins Hospital and University, and the federal government. In Cleveland, major employers include the Cleveland Clinic and University Hospitals.
There were 191 building permits issued in Baltimore in 2012 (116 more than in 2011) compared to 104 building permits issued in Cleveland in 2012 (18 more than in 2011).
In Baltimore (Baltimore city), 87.4% voted for Democrats and 11.1% for Republicans in 2012 Presidential Election. In Cleveland (Cuyahoga County), 69.7% voted for Democrats and 29.7% for Republicans.
Elections
Type
Democrats
Republicans
Other
Year
Baltimore
Cleveland
Baltimore
Cleveland
Baltimore
Cleveland
2020
87.5%
66.5%
10.7%
32.4%
1.8%
1.1%
2016
84.8%
65.5%
10.5%
30.3%
4.6%
4.1%
2012
87.4%
69.7%
11.1%
29.7%
1.4%
0.5%
2008
87.6%
69.1%
11.7%
30.1%
0.6%
0.8%
2004
82.5%
66.6%
17.1%
32.9%
0.5%
0.5%
2000
82.9%
62.9%
14.2%
33.6%
2.9%
3.5%
1996
79.3%
60.8%
15.5%
29.1%
5.1%
10.1%
Breakdown of population affiliated with a religious congregation
Type
Adherents
Congregations
Religion
Baltimore
Cleveland
Baltimore
Cleveland
CATHOLIC CHURCH
11.0%
28.6%
8.2%
11.3%
EPISCOPAL CHURCH
1.6%
0.6%
4.0%
2.2%
AMERICAN BAPTIST CHURCHES IN THE USA
1.4%
1.6%
2.2%
3.2%
SOUTHERN BAPTIST CONVENTION
1.4%
0.4%
7.3%
3.0%
EVANGELICAL LUTHERAN CHURCH IN AMERICA
1.0%
1.1%
4.3%
3.9%
MUSLIM ESTIMATE
0.6%
0.3%
1.5%
1.4%
SEVENTH DAY ADVENTIST CHURCH
0.5%
0.4%
1.5%
1.6%
LUTHERAN CHURCH
0.4%
1.4%
1.8%
4.0%
Weather
Both cities experience four distinct seasons. Baltimore's climate tends to be more moderate than Cleveland. Cleveland has colder winters with significant snowfall while Baltimore's summertime is typically hotter and more humid.
Weather and climate
Type
Baltimore
Cleveland
Temperature - Average
54.5°F
50.1°F
Humidity - Average morning or afternoon humidity
70.4%
75.8%
Humidity - Differences between morning and afternoon humidity
36%
27%
Humidity - Maximum monthly morning or afternoon humidity
84%
83%
Humidity - Minimum monthly morning or afternoon humidity
48%
56%
Precipitation - Yearly average
42.9 in
38.5 in
Snowfall - Yearly average
39.6 in
115.9 in
Clouds - Number of days clear of clouds
17.5%
11.2%
Sunshine amount - Average
60.3%
51.8%
Sunshine amount - Differences during a year
16%
44%
Sunshine amount - Maximum monthly
63%
66%
Sunshine amount - Minimum monthly
47%
22%
Wind speed - Average
7.9 mph
10.4 mph
Average climate in Baltimore, Maryland
Average climate in Cleveland, Ohio
Air pollution
Type
AQI
CO
NO2
OZONE
PM10
PM25
SO2
Year
Baltimore
Cleveland
Baltimore
Cleveland
Baltimore
Cleveland
Baltimore
Cleveland
Baltimore
Cleveland
Baltimore
Cleveland
Baltimore
Cleveland
2018
89
85
0.23
0.26
11.8
11.3
28.3
26.9
N/A
22.7
7.9
9.3
0.1
0.6
2017
89
82
0.25
0.27
12.1
11.4
27.7
27.6
N/A
23.2
8.2
8.2
0.2
0.5
2016
102
81
0.26
0.27
13.0
11.1
28.3
27.1
N/A
23.4
7.7
9.9
0.3
1.0
2015
89
76
0.28
0.27
12.4
12.9
28.3
25.1
N/A
31.5
9.5
8.0
0.4
1.9
2014
82
83
0.25
0.25
11.8
12.3
25.7
23.7
N/A
28.4
10.9
10.6
0.6
1.7
2013
86
88
0.22
0.24
10.7
12.9
25.6
23.8
N/A
27.3
9.6
12.0
0.5
1.9
2012
98
119
0.24
0.28
11.3
13.7
25.0
26.5
N/A
32.0
11.2
15.2
0.5
2.5
2011
101
110
0.24
0.29
12.5
15.3
25.1
25.8
N/A
29.7
12.1
16.1
0.8
3.4
2010
110
113
0.24
0.35
13.1
15.8
26.9
27.0
N/A
24.2
12.2
18.7
1.0
3.6
2009
84
67
0.23
0.37
12.2
17.1
23.5
26.0
N/A
21.5
10.4
N/A
1.4
3.7
2008
96
87
0.25
0.29
13.6
15.2
21.6
32.9
N/A
27.1
12.8
N/A
1.8
4.2
2007
107
94
0.21
0.29
13.8
18.1
23.2
32.9
N/A
30.3
14.0
N/A
2.5
5.2
2006
112
75
N/A
0.25
12.0
16.2
24.6
27.7
N/A
27.3
14.7
N/A
N/A
5.0
2005
111
98
N/A
0.27
14.3
19.2
26.3
28.6
23.0
31.7
17.1
N/A
N/A
5.7
2004
108
77
N/A
0.47
15.3
19.5
28.0
20.1
23.1
29.2
16.3
N/A
N/A
3.8
2003
110
81
N/A
0.49
17.8
19.6
22.4
25.8
N/A
28.3
13.9
N/A
N/A
5.7
2002
119
95
N/A
0.40
17.4
19.8
19.4
28.6
N/A
32.5
16.3
N/A
5.8
5.1
2001
104
91
N/A
0.43
18.2
21.1
23.9
28.4
N/A
35.9
N/A
N/A
6.0
5.9
2000
101
79
N/A
0.48
17.0
20.5
22.4
25.2
N/A
35.9
N/A
N/A
6.3
5.8
Natural disasters
Type
Baltimore
Cleveland
Tornado activity compared to U.S. average
117.8%
93%
Earthquake activity compared to U.S. average
40.6%
50.2%
Natural disasters compared to U.S. average
0%
16%
Transportation
Both cities have reliable public transportation systems and commute times are relatively similar. Cleveland has a more extensive rapid transit system, while Baltimore has a robust bus system.
Transport
Type
Baltimore
Cleveland
Amtrak stations
2
1
Amtrak stations nearby
2
1
FAA registered aircraft
136
307
FAA registered aircraft manufacturers and dealers
2
19
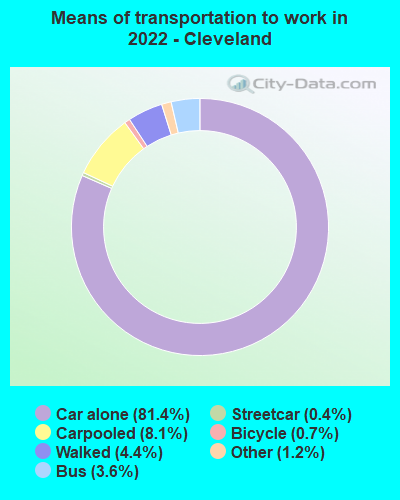
Means of transportation to work
Type
Baltimore
Cleveland
Bicycle
0.4%
0.2%
Bus
6.2%
3.5%
Carpooled
7.3%
7.7%
Car alone
77.2%
83.1%
Railroad
0.3%
0.1%
Streetcar
1.2%
0.4%
Subway
0.2%
0%
Taxicab
0.7%
0.1%
Walked
4.5%
3.9%
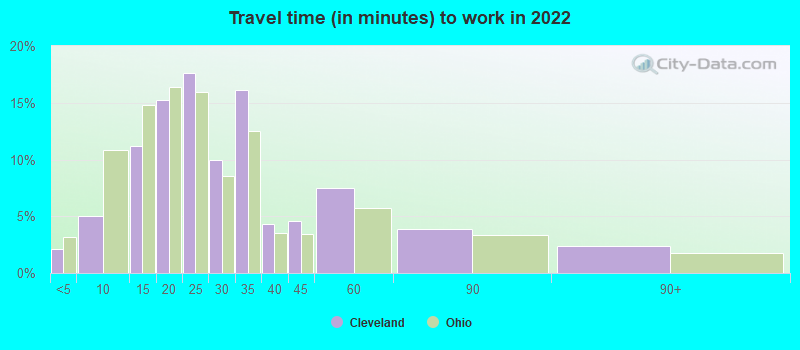
Average travel time to work
Type
Baltimore
Cleveland
Average
32.3 min
28.9 min
Other means
26.3 min
23.2 min
Public transportation
46.8 min
42.9 min
Private vehicle occupancy
Type
Baltimore
Cleveland
Average
1.1
1.2
Drove alone
90.7%
87.9%
In 2 person carpool
7.5%
10.3%
In 3 person carpool
1%
1%
In 4 person carpool
0.4%
0.4%
In 5-6 person carpool
0.3%
0.1%
In 7+ person carpool
0.2%
0.3%
How many people usually rode to work in the car, truck or van.
Real Estate
Real-estate prices tend to be higher in Baltimore compared to Cleveland. The housing market in both cities is diverse, offering anything from urban apartments to suburban single-family homes.
Neighborhoods
Both cities have diverse neighborhoods. Baltimore is known for its Inner Harbor, while Cleveland's Ohio City is full of charm and history.
Houses and residents
Type
Baltimore
Cleveland
Houses
293,487
202,735
Average household size (people)
2.4
2.3
Median year apartment built
1959
1946
Length of stay in the house since moving in
15.7 years
17.5 years
Houses occupied
254,370 (86.7%)
171,321 (84.5%)
Houses occupied by owners
123,249 (48.5%)
67,039 (39.1%)
Houses occupied by renters
131,121 (51.5%)
104,282 (60.9%)
Median rent asked for vacant for-rent units
$1,254
$1,284
Median monthly housing costs
$1,196
$754
Median price asked for vacant for-sale houses and condos
$207,303
$86,306
Estimated median house or condo value
$193,100
$83,400
Median numbers of rooms
5.6
5.2
Median number of rooms in apartments
4.2
4.4
Median number of rooms in houses and condos
6.5
6.3
Median house price - detached houses
$321,473
$104,861
Median house price - in 2-unit structures
$218,934
$81,957
Median house price - in 3-to-4-unit structures
$142,945
$250,787
Median house price - in 5 or more unit structures
$257,173
$156,467
Median house price - mobile homes
$269,877
$40,340
Median house price - Townhouses or other attached units
$210,096
$125,938
Median house price - All housing units
$246,241
$105,403
Median house age
72
80
Renting percentage
52.3%
55.9%
Housing density (houses/condos per square mile)
3,632.1
2,613.2
House value disparities
38.5%
41.6%
Household income disparities
49.4%
48.5%
Median household income for houses/condes with a mortgage
$85,990
$61,885
Median household income for apartments without a mortgage
$53,334
$42,551
Housing units without a mortgage
2,415 (2.8%)
2,325 (6.3%)
Housing units with both a second mortgage and home equity loan
5,740 (6.6%)
2,348 (6.4%)
Housing units with a mortgage
84,578 (97.2%)
34,401 (93.7%)
Housing units with a home equity loan
579 (0.7%)
166 (0.5%)
Housing units with a second mortgage
8,544 (9.8%)
3,335 (9.1%)
House/condo owner moved in on average (years ago)
14
19
House/condo renter moved in on average (years ago)
3
3
Housing units lacking complete kitchen facilities
6%
8.8%
Housing units lacking complete plumbing facilities
5.1%
5.1%
Housing units in structures
Housing units in structures
Baltimore
Cleveland
One, detached
16.4%
48.7%
One, attached
49.5%
5.6%
Two
4.5%
14.7%
3 or 4
4.9%
5.2%
5 to 9
5.5%
5.0%
10 to 19
4.8%
3.8%
20 to 49
2.8%
3.3%
50 or more
11.4%
13.1%
Mobile homes
0.2%
0.4%
Boats, RVs, vans, etc.
0.1%
0.1%
Median real estate property taxes paid for housing units
Self-employed workers in own not incorporated business
12,671
7,246
State government workers
20,410
2,212
Unpaid family workers
356
328
Industries and Occupations
The top industries in Baltimore include health care and social assistance, while in Cleveland, manufacturing, health care, and education services dominate the labor market.
In the realm of healthcare, both cities have world-renowned facilities. Baltimore's Johns Hopkins Hospital consistently ranks among the best in the nation, and Cleveland’s Clinic is renowned for cardiac care.
Health (county statistics)
Type
Baltimore
Cleveland
General health status score of residents in this county from 1 (poor) to 5 (excellent)
Both cities have extensive infrastructure, including major expressways, airports, and public transit systems. Cleveland's public transit system is more extensive, but both cities are investing in infrastructure improvements.
Infrastructure
Type
Baltimore
Cleveland
Hospitals
45
30
TV stations
19
16
Arenas or stadiums
3
4
Bank branches located here
215
116
Bank institutions located here
44
17
Main business address for public companies
27
31
Drinking water stations with no reported violations in the past
13
1
Drinking water stations with reported violations in the past
HMDA - Conventional home purchase loans - Applications denied
Year
Baltimore
Cleveland
1999
2,486
1,871
2000
2,058
2,587
2001
1,371
2,077
2002
1,111
1,561
2003
1,526
1,242
2004
2,929
1,561
2005
4,981
3,297
2006
5,533
3,951
2007
3,592
2,211
2008
1,111
482
2009
381
184
Culture and Food
Baltimore is famous for its seafood, especially crab cakes and oysters, while Cleveland is known for its Polish and Central European influences. Both cities have thriving music and art scenes.
Sports Teams
Both cities are home to major sports teams. Baltimore has the Ravens (NFL) and Orioles (MLB), while Cleveland hosts the Browns (NFL), Indians (MLB), and Cavaliers (NBA).


 Baltimore, MD
 Cleveland, OH