Baltimore, Maryland, and Jersey City, New Jersey, are both vibrant US cities, each with its unique character and lifestyle. Baltimore is renowned for its historical landmarks, seafood and strong community spirit, while Jersey City boasts a diverse population, stunning skyline views, and close proximity to New York City. This comparison will explore various facets of these cities, such as crime and safety, weather, cost of living, and more to provide useful insights for individuals seeking to relocate or visit either city.
Distance between
Baltimore, MD and
Jersey City, NJ : 166.6 miles
Baltimore's population is larger by 103%. Its population has decreased by 74,656 people (11.5%) since 2000. The population of Jersey City has grown by 43,872 people (18.3%) during that time.
In terms of safety, both Baltimore and Jersey City have their share of crime, like any other city. Baltimore's crime rate is higher than the national average, with violent crime being a significant concern. However, areas like Mount Vernon, Inner Harbor, and Roland Park are considered safer. Conversely, Jersey City has a lower crime rate than the national average, and it's seen significant improvements in recent years. Areas such as Downtown, The Heights, and Bergen-Lafayette are generally safe.
City-data.com crime index counts serious crimes and violent crime more heavily. It adjusts for the number of visitors and daily workers commuting into cities. (higher means more crime, U.S. average = 301.1)
City-data.com crime index counts serious crimes and violent crime more heavily. It adjusts for the number of visitors and daily workers commuting into cities. (higher means more crime, U.S. average = 301.1)
Sex Offenders
According to our data, there are 1,558 registered sex offenders living in Baltimore and 248 registered sex offenders living in . The ratio of residents to sex offenders in Baltimore is 395 to 1; the ratio in Jersey City is 1,065 to 1. The number of registered sex offenders compared to the number of residents is much larger in Baltimore than that in Jersey City.
Cost of Living
When considering the cost of living, Jersey City comes out higher than Baltimore. The higher cost is mainly due to real estate prices and the proximity to New York City. Nonetheless, transportation, groceries, and healthcare costs are comparable in both cities.
Income Tax
Maryland, home to Baltimore, has a progressive income tax system that ranges from 2% to 5.75%, and there's a local income tax assessed by the city. New Jersey also imposes a progressive income tax, ranging from 1.4% to 10.75%.
Property Tax
Property tax rates in Baltimore are higher than the national average while in Jersey City, property taxes are generally lower.
Sales Tax
Baltimore, in Maryland, has a 6% state sales tax and does not impose any additional city sales tax. On the other hand, Jersey City, in New Jersey, follows a 6.625% state sales tax, which is applicable uniformly throughout the state.
Income
Type
Baltimore
Jersey City
Estimated median household income
$54,652
$81,958
Estimated per capita income
$35,091
$51,119
Cost of living index (U.S. average is 100)
105.7
123.5
If you make $50,000 in Baltimore, you will have to make $58,420 in Jersey City to maintain the same standard of living.
Geographical Conditions
Geographically, Baltimore is defined by its coastal location and Inner Harbor. It has access to beautiful parks and hiking trails. Jersey City, on the other hand, offers an urban setting with stunning views of the Manhattan skyline and the Hudson River.
In terms of education, Baltimore is home to notable institutions such as Johns Hopkins University and the University of Maryland. Jersey City also has educational prominence with New Jersey City University and proximity to many prestigious institutions in New York. Both cities have diverse options for K-12 education.
Baltimore's economy is driven by a mix of sectors including healthcare, education, and tourism. Meanwhile, Jersey City benefits from New York City's economic influence, with many residents commuting to Manhattan for work. The city is home to finance, insurance, real estate (FIRE), and tech industries.
Biggest Employers
Baltimore's largest employers include Johns Hopkins University, MedStar Health, and the University of Maryland Medical Center. In Jersey City, JPMorgan Chase, Goldman Sachs, and Citigroup are major employers, reflecting the city's emphasis on financial services.
There were 191 building permits issued in Baltimore in 2012 (116 more than in 2011) compared to 245 building permits issued in Jersey City in 2012 (245 more than in 2011).
In Baltimore (Baltimore city), 87.4% voted for Democrats and 11.1% for Republicans in 2012 Presidential Election. In Jersey City (Hudson County), 77.7% voted for Democrats and 21.5% for Republicans.
Elections
Type
Democrats
Republicans
Other
Year
Baltimore
Jersey City
Baltimore
Jersey City
Baltimore
Jersey City
2020
87.5%
72.8%
10.7%
26.4%
1.8%
0.8%
2016
84.8%
74.6%
10.5%
22.3%
4.6%
3.1%
2012
87.4%
77.7%
11.1%
21.5%
1.4%
0.9%
2008
87.6%
73.3%
11.7%
26.3%
0.6%
0.4%
2004
82.5%
67.4%
17.1%
32.1%
0.5%
0.5%
2000
82.9%
71.0%
14.2%
26.3%
2.9%
2.7%
1996
79.3%
69.9%
15.5%
23.1%
5.1%
7.0%
Breakdown of population affiliated with a religious congregation
Type
Adherents
Congregations
Religion
Baltimore
Jersey City
Baltimore
Jersey City
CATHOLIC CHURCH
11.0%
44.3%
8.2%
13.9%
EPISCOPAL CHURCH
1.6%
0.3%
4.0%
3.2%
AMERICAN BAPTIST CHURCHES IN THE USA
1.4%
0.8%
2.2%
4.7%
SOUTHERN BAPTIST CONVENTION
1.4%
0.4%
7.3%
3.4%
EVANGELICAL LUTHERAN CHURCH IN AMERICA
1.0%
0.4%
4.3%
5.8%
MUSLIM ESTIMATE
0.6%
3.3%
1.5%
3.4%
SEVENTH DAY ADVENTIST CHURCH
0.5%
0.5%
1.5%
3.9%
LUTHERAN CHURCH
0.4%
0.0%
1.8%
0.8%
Weather
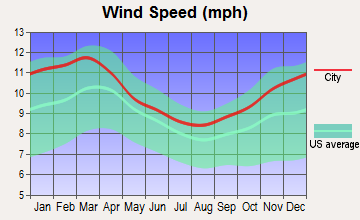
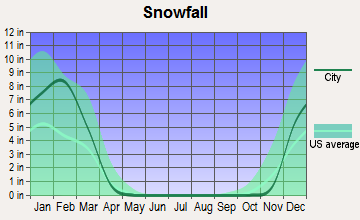
As for weather, Baltimore experiences hot, humid summers and chilly winters. Snowfall is less frequent compared to Northeastern cities. On the other hand, Jersey City has a similar climate but with more abundant winter snowfall due to its more northern location. Both cities enjoy beautiful fall seasons.
Weather and climate
Type
Baltimore
Jersey City
Temperature - Average
54.5°F
54.7°F
Humidity - Average morning or afternoon humidity
70.4%
67.3%
Humidity - Differences between morning and afternoon humidity
36%
29.7%
Humidity - Maximum monthly morning or afternoon humidity
84%
76.9%
Humidity - Minimum monthly morning or afternoon humidity
48%
47.2%
Precipitation - Yearly average
42.9 in
47.5 in
Snowfall - Yearly average
39.6 in
58.8 in
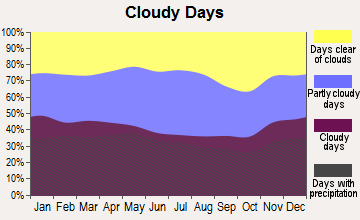
Clouds - Number of days clear of clouds
17.5%
16.5%
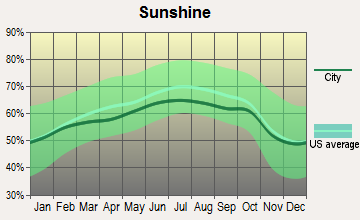
Sunshine amount - Average
60.3%
60.2%
Sunshine amount - Differences during a year
16%
20%
Sunshine amount - Maximum monthly
63%
64%
Sunshine amount - Minimum monthly
47%
44%
Wind speed - Average
7.9 mph
9.2 mph
Average climate in Baltimore, Maryland
Average climate in Jersey City, New Jersey
Air pollution
Type
AQI
CO
NO2
OZONE
PB
PM10
PM25
SO2
Year
Baltimore
Jersey City
Baltimore
Jersey City
Baltimore
Jersey City
Baltimore
Jersey City
Jersey City
Baltimore
Jersey City
Baltimore
Jersey City
Baltimore
Jersey City
2018
89
93
0.23
0.33
11.8
19.2
28.3
23.9
N/A
N/A
N/A
N/A
7.9
9.2
0.1
0.6
2017
89
95
0.25
0.33
12.1
20.1
27.7
23.6
N/A
N/A
N/A
N/A
8.2
10.6
0.2
0.5
2016
102
93
0.26
0.37
13.0
20.5
28.3
24.1
N/A
N/A
N/A
N/A
7.7
9.6
0.3
0.7
2015
89
100
0.28
0.58
12.4
17.8
28.3
24.0
N/A
N/A
N/A
N/A
9.5
7.5
0.4
0.5
2014
82
95
0.25
0.56
11.8
18.5
25.7
23.3
N/A
N/A
N/A
N/A
10.9
7.1
0.6
0.7
2013
86
96
0.22
0.63
10.7
18.8
25.6
23.7
N/A
N/A
N/A
N/A
9.6
8.0
0.5
0.6
2012
98
98
0.24
0.69
11.3
18.2
25.0
23.5
N/A
N/A
N/A
N/A
11.2
9.3
0.5
1.0
2011
101
107
0.24
0.59
12.5
20.4
25.1
22.6
N/A
N/A
N/A
N/A
12.1
10.1
0.8
2.3
2010
110
112
0.24
0.52
13.1
19.0
26.9
24.6
N/A
N/A
N/A
N/A
12.2
10.4
1.0
1.8
2009
84
104
0.23
0.53
12.2
20.8
23.5
20.4
N/A
N/A
N/A
N/A
10.4
12.4
1.4
2.4
2008
96
108
0.25
0.57
13.6
21.9
21.6
21.2
0.013
N/A
N/A
N/A
12.8
17.3
1.8
3.5
2007
107
120
0.21
0.65
13.8
22.8
23.2
21.6
0.016
N/A
N/A
N/A
14.0
14.0
2.5
4.1
2006
112
116
N/A
0.86
12.0
23.8
24.6
20.9
0.018
N/A
N/A
N/A
14.7
12.7
N/A
6.0
2005
111
107
N/A
1.04
14.3
25.2
26.3
19.9
N/A
N/A
23.0
N/A
17.1
N/A
N/A
7.8
2004
108
106
N/A
1.06
15.3
24.8
28.0
18.8
0.030
N/A
23.1
N/A
16.3
N/A
N/A
8.3
2003
110
107
N/A
1.07
17.8
26.5
22.4
18.2
0.019
N/A
N/A
26.8
13.9
N/A
N/A
8.6
2002
119
122
N/A
1.02
17.4
27.4
19.4
19.7
0.008
N/A
N/A
26.3
16.3
N/A
5.8
7.0
2001
104
121
N/A
1.02
18.2
28.9
23.9
23.8
0.020
N/A
N/A
28.2
N/A
N/A
6.0
9.0
2000
101
115
N/A
1.13
17.0
29.3
22.4
22.2
0.022
N/A
N/A
22.2
N/A
N/A
6.3
7.8
Natural disasters
Type
Baltimore
Jersey City
Tornado activity compared to U.S. average
117.8%
60.7%
Earthquake activity compared to U.S. average
40.6%
31.3%
Natural disasters compared to U.S. average
0%
21%
Transportation
Both cities have comprehensive transit systems. Baltimore has the Maryland Transit Administration (MTA), which offers bus, light rail, subway, and commuter train services. In contrast, Jersey City, as part of the New York metropolitan area, benefits from the PATH system, ferries, buses, and proximity to major airports.
Transport
Type
Baltimore
Jersey City
Amtrak stations
2
0
Amtrak stations nearby
2
3
FAA registered aircraft
136
0
FAA registered aircraft manufacturers and dealers
2
0
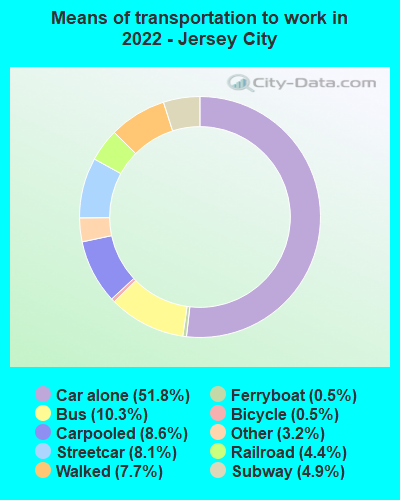
Means of transportation to work
Type
Baltimore
Jersey City
Bicycle
0.4%
1%
Bus
6.2%
8.5%
Carpooled
7.3%
10.9%
Car alone
77.2%
56.2%
Ferryboat
0%
0.5%
Railroad
0.3%
2.2%
Streetcar
1.2%
6.8%
Subway
0.2%
1.8%
Taxicab
0.7%
0.4%
Walked
4.5%
10.6%
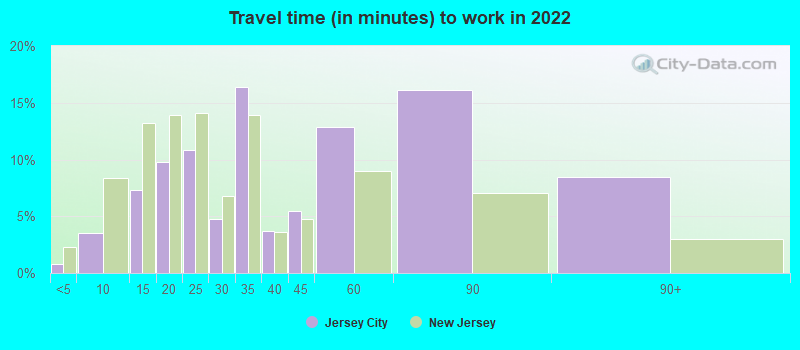
Average travel time to work
Type
Baltimore
Jersey City
Average
32.3 min
37.9 min
Other means
26.3 min
29.3 min
Public transportation
46.8 min
43.3 min
Private vehicle occupancy
Type
Baltimore
Jersey City
Average
1.1
1.2
Drove alone
90.7%
86.9%
In 2 person carpool
7.5%
11.4%
In 3 person carpool
1%
1%
In 4 person carpool
0.4%
0.6%
In 5-6 person carpool
0.3%
0.1%
In 7+ person carpool
0.2%
0%
How many people usually rode to work in the car, truck or van.
Real Estate
Real estate in Jersey City is more expensive due to its proximity to New York City. You can still find a range of affordable options in surrounding neighborhoods. Baltimore offers a lower cost of living, with various real estate options from historic row houses to modern condos.
Neighborhoods
Baltimore has diverse neighborhoods, each with its unique charm. Areas like Canton, Federal Hill, and Fells Point are popular. Jersey City also boasts varied neighborhoods, including the vibrant Downtown, historic Paulus Hook, and up-and-coming Bergen-Lafayette.
Houses and residents
Type
Baltimore
Jersey City
Houses
293,487
131,609
Average household size (people)
2.4
2.5
Median year apartment built
1959
1973
Median year house/condo built
1944
1958
Length of stay in the house since moving in
15.7 years
14.7 years
Houses occupied
254,370 (86.7%)
119,158 (90.5%)
Houses occupied by owners
123,249 (48.5%)
34,358 (28.8%)
Houses occupied by renters
131,121 (51.5%)
84,800 (71.2%)
Median rent asked for vacant for-rent units
$1,254
$3,976
Median monthly housing costs
$1,196
$1,802
Median price asked for vacant for-sale houses and condos
$207,303
$189,931
Estimated median house or condo value
$193,100
$487,400
Median numbers of rooms
5.6
3.8
Median number of rooms in apartments
4.2
3.5
Median number of rooms in houses and condos
6.5
4.9
Median house price - detached houses
$321,473
$528,884
Median house price - in 2-unit structures
$218,934
$575,313
Median house price - in 3-to-4-unit structures
$142,945
$573,856
Median house price - in 5 or more unit structures
$257,173
$607,790
Median house price - Townhouses or other attached units
$210,096
$605,198
Median house price - All housing units
$246,241
$579,559
Median house age
72
51
Renting percentage
52.3%
70.5%
Housing density (houses/condos per square mile)
3,632.1
8,823.3
House value disparities
38.5%
26.6%
Household income disparities
49.4%
47.2%
Median household income for houses/condes with a mortgage
$85,990
$134,110
Median household income for apartments without a mortgage
$53,334
$76,768
Housing units without a mortgage
2,415 (2.8%)
238 (1.1%)
Housing units with both a second mortgage and home equity loan
5,740 (6.6%)
1,275 (5.8%)
Housing units with a mortgage
84,578 (97.2%)
21,710 (98.9%)
Housing units with a home equity loan
579 (0.7%)
0 (0%)
Housing units with a second mortgage
8,544 (9.8%)
1,438 (6.6%)
House/condo owner moved in on average (years ago)
14
12
House/condo renter moved in on average (years ago)
3
1
Housing units lacking complete kitchen facilities
6%
2.1%
Housing units lacking complete plumbing facilities
5.1%
0.6%
Housing units in structures
Housing units in structures
Baltimore
Jersey City
One, detached
16.4%
7.6%
One, attached
49.5%
6.0%
Two
4.5%
20.0%
3 or 4
4.9%
10.7%
5 to 9
5.5%
10.0%
10 to 19
4.8%
5.8%
20 to 49
2.8%
10.4%
50 or more
11.4%
29.4%
Mobile homes
0.2%
0.1%
Boats, RVs, vans, etc.
0.1%
0.1%
Median real estate property taxes paid for housing units
Self-employed workers in own not incorporated business
12,671
6,079
State government workers
20,410
4,015
Unpaid family workers
356
400
Industries and Occupations
Healthcare, education, and finance are among the predominant industries in Baltimore; whereas, finance, insurance, tech, and services dominate Jersey City's economy.
Baltimore is renowned for its excellent healthcare system, with medical institutions such as Johns Hopkins Hospital. Jersey City also provides quality health care with facilities including the Jersey City Medical Center and Christ Hospital.
Health (county statistics)
Type
Baltimore
Jersey City
General health status score of residents in this county from 1 (poor) to 5 (excellent)
Both cities offer robust infrastructure. Baltimore is a transportation hub with a port, train station, and highways. Jersey City, on the other hand, benefits from being part of the New York metropolitan area, with its vast road, rail, and ferry networks.
Infrastructure
Type
Baltimore
Jersey City
Hospitals
45
6
TV stations
19
30
Bank branches located here
215
58
Bank institutions located here
44
18
Main business address for public companies
27
11
Drinking water stations with no reported violations in the past
13
0
Drinking water stations with reported violations in the past
HMDA - Conventional home purchase loans - Applications denied
Year
Baltimore
Jersey City
1999
2,486
427
2000
2,058
603
2001
1,371
514
2002
1,111
580
2003
1,526
756
2004
2,929
1,127
2005
4,981
1,625
2006
5,533
1,929
2007
3,592
1,618
2008
1,111
932
2009
381
348
Culture and Food
Baltimore offers a rich culture rooted in its naval history, celebrated through numerous festivals and markets. Seafood, specifically the Chesapeake Bay Blue Crab, is central to Baltimore's culinary scene. Jersey City is incredibly diverse, reflected in its cultural festivals and food scene, showcasing cuisines from around the world.
Sports Teams
Sports fans will enjoy both cities. Baltimore is home to the Orioles (MLB) and Ravens (NFL). Jersey City residents typically support New York teams due to its close proximity, with the Giants (NFL), Yankees (MLB), and Knicks (NBA) being favorites.


 Baltimore, MD
 Jersey City, NJ