Comparing Baltimore, MD, and Newport News, VA, reveals distinctive characters, economies, and living experiences. Both cities offer unique opportunities for residents and tourists alike. However, from crime and safety to culture and cuisine, each city presents different prospects and challenges. By examining the key aspects, we can draw an overall picture of life in these two cities.
Distance between
Baltimore, MD and
Newport News, VA : 154.7 miles
Baltimore's population is larger by 212%. Its population has decreased by 74,656 people (11.5%) since 2000. The population of Newport News has grown by 4,437 people (2.5%) during that time.
Baltimore struggles with a high crime rate, significantly higher than the U.S. average, which may be a concern for potential residents and tourists. Newport News, while also higher than the national average in crime, is considerably lower than Baltimore. Efforts are being made in both cities to increase safety with a focus on community policing strategies.
City-data.com crime index counts serious crimes and violent crime more heavily. It adjusts for the number of visitors and daily workers commuting into cities. (higher means more crime, U.S. average = 301.1)
City-data.com crime index counts serious crimes and violent crime more heavily. It adjusts for the number of visitors and daily workers commuting into cities. (higher means more crime, U.S. average = 301.1)
Sex Offenders
According to our data, there are 1,558 registered sex offenders living in Baltimore and 668 registered sex offenders living in . The ratio of residents to sex offenders in Baltimore is 395 to 1; the ratio in Newport News is 272 to 1. The number of registered sex offenders compared to the number of residents is a smaller in Baltimore than in Newport News.
Cost of Living
The cost of living in Baltimore is generally lower than in Newport News. Housing costs are particularly more affordable in Baltimore. However, healthcare and groceries tend to be less expensive in Newport News.
Income Tax
Baltimore residents contend with both city and state income tax, with the city tax at 3.2%. Virginia, including Newport News, imposes only a state income tax, which varies from 2-5.75%.
Property Tax
Property taxes are significantly higher in Baltimore than in Newport News. This could be a factor for potential residents, particularly homebuyers.
Sales Tax
Sales tax is slightly lower in Baltimore (6%) compared to Newport News (7%). This difference could make a noticeable impact on larger purchases.
Income
Type
Baltimore
Newport News
Estimated median household income
$54,652
$58,937
Estimated per capita income
$35,091
$31,802
Cost of living index (U.S. average is 100)
105.7
95.9
If you make $50,000 in Newport News, you will have to make $55,109 in Baltimore to maintain the same standard of living.
Geographical Conditions
Baltimore is a port city on the Patapsco River, while Newport News is strategically located on the Virginia Peninsula, between the James River and the Chesapeake Bay. These geographies influence the recreational activities available, such as boating and fishing.
Baltimore is home to prestigious universities like Johns Hopkins and Loyola University Maryland. While Newport News doesn't host institutions with the same national recognition, it does have a solid public school system and is close to renowned colleges like The College of William & Mary.
Baltimore, with a diverse economy, offers opportunities in healthcare, education, and technology sectors. Newport News has a more focused economy with a heavy emphasis on the shipbuilding and military industries. Unemployment rates tend to be higher in Baltimore than in Newport News.
Biggest Employers
The Johns Hopkins Hospital and University are among Baltimore's largest employers. In Newport News, Newport News Shipbuilding and the Department of Defense are major sources of employment.
There were 191 building permits issued in Baltimore in 2012 (116 more than in 2011) compared to 106 building permits issued in Newport News in 2012 (40 less than in 2011).
In Baltimore (Baltimore city), 87.4% voted for Democrats and 11.1% for Republicans in 2012 Presidential Election. In Newport News (Newport News city), 64.7% voted for Democrats and 34.5% for Republicans.
Elections
Type
Democrats
Republicans
Other
Year
Baltimore
Newport News
Baltimore
Newport News
Baltimore
Newport News
2020
87.5%
65.4%
10.7%
32.5%
1.8%
2.1%
2016
84.8%
60.3%
10.5%
33.7%
4.6%
6.0%
2012
87.4%
64.7%
11.1%
34.5%
1.4%
0.9%
2008
87.6%
64.5%
11.7%
35.6%
0.6%
0.0%
2004
82.5%
52.2%
17.1%
47.6%
0.5%
0.3%
2000
82.9%
51.6%
14.2%
46.8%
2.9%
1.6%
1996
79.3%
51.0%
15.5%
42.5%
5.1%
6.5%
Breakdown of population affiliated with a religious congregation
Type
Adherents
Congregations
Religion
Baltimore
Newport News
Baltimore
Newport News
CATHOLIC CHURCH
11.0%
5.0%
8.2%
1.8%
EPISCOPAL CHURCH
1.6%
1.0%
4.0%
3.0%
AMERICAN BAPTIST CHURCHES IN THE USA
1.4%
2.4%
2.2%
3.0%
SOUTHERN BAPTIST CONVENTION
1.4%
7.1%
7.3%
19.5%
EVANGELICAL LUTHERAN CHURCH IN AMERICA
1.0%
0.3%
4.3%
1.2%
MUSLIM ESTIMATE
0.6%
1.9%
1.5%
0.6%
SEVENTH DAY ADVENTIST CHURCH
0.5%
0.5%
1.5%
1.8%
LUTHERAN CHURCH
0.4%
0.3%
1.8%
0.6%
Weather
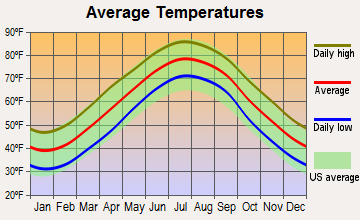
Both Baltimore and Newport News experience a humid subtropical climate, marked by hot, wet summers and mild winters. Baltimore tends to have somewhat more seasonal range, with warmer summers and cooler winters. Newport News, closer to the ocean, typically sees slightly more moderated seasonal swings.
Weather and climate
Type
Baltimore
Newport News
Temperature - Average
54.5°F
59.2°F
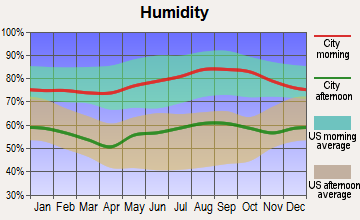
Humidity - Average morning or afternoon humidity
70.4%
73%
Humidity - Differences between morning and afternoon humidity
36%
32.1%
Humidity - Maximum monthly morning or afternoon humidity
84%
83.1%
Humidity - Minimum monthly morning or afternoon humidity
48%
50.9%
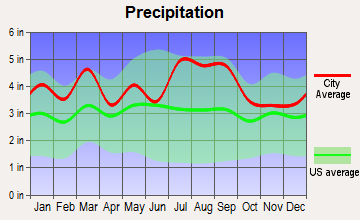
Precipitation - Yearly average
42.9 in
47.8 in
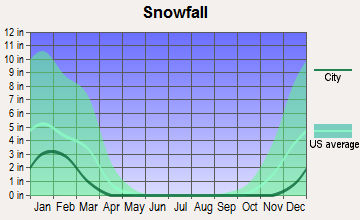
Snowfall - Yearly average
39.6 in
15.6 in
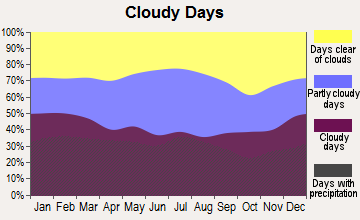
Clouds - Number of days clear of clouds
17.5%
17.6%
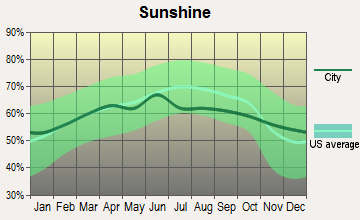
Sunshine amount - Average
60.3%
66.8%
Sunshine amount - Differences during a year
16%
14%
Sunshine amount - Maximum monthly
63%
67%
Sunshine amount - Minimum monthly
47%
53%
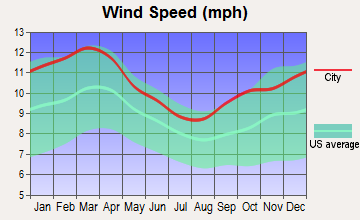
Wind speed - Average
7.9 mph
10.3 mph
Average climate in Baltimore, Maryland
Average climate in Newport News, Virginia
Air pollution
Type
AQI
CO
NO2
OZONE
PB
PM10
PM25
SO2
Year
Baltimore
Newport News
Baltimore
Newport News
Baltimore
Newport News
Baltimore
Newport News
Newport News
Baltimore
Baltimore
Newport News
Baltimore
Newport News
2018
89
57
0.23
0.19
11.8
3.7
28.3
32.5
0.002
N/A
N/A
N/A
7.9
6.1
0.1
0.6
2017
89
60
0.25
0.19
12.1
3.9
27.7
33.8
0.002
N/A
N/A
N/A
8.2
6.9
0.2
0.4
2016
102
66
0.26
0.18
13.0
3.7
28.3
32.7
0.002
N/A
N/A
N/A
7.7
6.1
0.3
0.6
2015
89
57
0.28
0.28
12.4
4.2
28.3
34.7
0.002
N/A
N/A
N/A
9.5
6.4
0.4
0.7
2014
82
59
0.25
0.25
11.8
4.3
25.7
34.5
0.002
N/A
N/A
N/A
10.9
6.8
0.6
1.0
2013
86
66
0.22
0.30
10.7
4.3
25.6
32.1
0.002
N/A
N/A
N/A
9.6
6.8
0.5
1.1
2012
98
76
0.24
0.26
11.3
5.4
25.0
35.8
0.002
N/A
N/A
N/A
11.2
8.1
0.5
1.0
2011
101
66
0.24
0.29
12.5
5.7
25.1
36.2
0.003
N/A
N/A
N/A
12.1
8.8
0.8
1.5
2010
110
80
0.24
0.14
13.1
6.6
26.9
39.3
0.004
N/A
N/A
N/A
12.2
N/A
1.0
2.3
2009
84
54
0.23
0.18
12.2
9.8
23.5
31.5
0.012
N/A
N/A
N/A
10.4
N/A
1.4
2.0
2008
96
77
0.25
0.21
13.6
10.3
21.6
36.2
0.004
N/A
N/A
N/A
12.8
N/A
1.8
3.1
2007
107
81
0.21
0.22
13.8
12.2
23.2
35.6
0.004
N/A
N/A
N/A
14.0
N/A
2.5
3.6
2006
112
62
N/A
0.30
12.0
N/A
24.6
35.1
0.004
N/A
N/A
N/A
14.7
N/A
N/A
3.5
2005
111
67
N/A
0.28
14.3
N/A
26.3
34.8
N/A
N/A
23.0
N/A
17.1
N/A
N/A
3.2
2004
108
80
N/A
0.31
15.3
15.9
28.0
32.9
N/A
N/A
23.1
N/A
16.3
N/A
N/A
3.8
2003
110
84
N/A
0.38
17.8
16.2
22.4
33.6
N/A
N/A
N/A
N/A
13.9
N/A
N/A
3.1
2002
119
99
N/A
0.38
17.4
17.8
19.4
37.6
N/A
N/A
N/A
N/A
16.3
N/A
5.8
3.7
2001
104
92
N/A
0.43
18.2
18.2
23.9
35.5
N/A
N/A
N/A
N/A
N/A
N/A
6.0
4.3
2000
101
85
N/A
0.48
17.0
15.7
22.4
35.6
N/A
N/A
N/A
N/A
N/A
N/A
6.3
5.2
Natural disasters
Type
Baltimore
Newport News
Tornado activity compared to U.S. average
117.8%
77.4%
Earthquake activity compared to U.S. average
40.6%
38.4%
Natural disasters compared to U.S. average
0%
0%
Transportation
Mass transit in Baltimore, including buses, light rail, and the MARC train service, provides convenient ways to traverse the city. Newport News relies more on car commuting, although it does offer bus services.
Transport
Type
Baltimore
Newport News
Amtrak stations
2
1
Amtrak stations nearby
2
3
FAA registered aircraft
136
140
FAA registered aircraft manufacturers and dealers
2
3
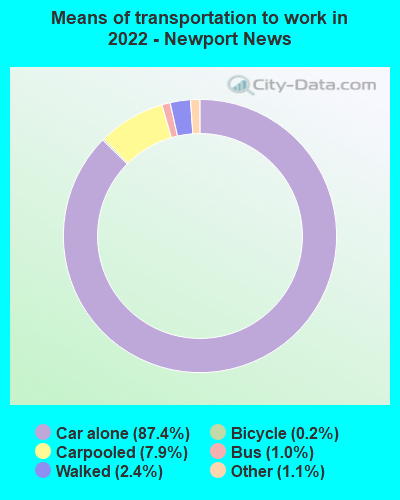
Means of transportation to work
Type
Baltimore
Newport News
Bicycle
0.4%
0.2%
Bus
6.2%
1.6%
Carpooled
7.3%
8.8%
Car alone
77.2%
84.2%
Motorcycle
0%
0.2%
Railroad
0.3%
0%
Streetcar
1.2%
0%
Subway
0.2%
0%
Taxicab
0.7%
0.2%
Walked
4.5%
3%
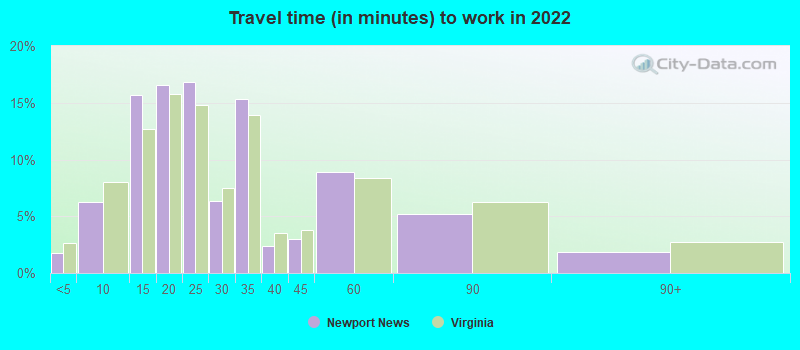
Average travel time to work
Type
Baltimore
Newport News
Average
32.3 min
25.3 min
Other means
26.3 min
23.5 min
Public transportation
46.8 min
37.8 min
Private vehicle occupancy
Type
Baltimore
Newport News
Average
1.1
1.1
Drove alone
90.7%
90.5%
In 2 person carpool
7.5%
7.5%
In 3 person carpool
1%
0.9%
In 4 person carpool
0.4%
0.8%
In 5-6 person carpool
0.3%
0.2%
In 7+ person carpool
0.2%
0.2%
How many people usually rode to work in the car, truck or van.
Real Estate
Real estate is generally more expensive in Newport News compared to Baltimore, where affordable housing is more readily available. However, property prices in desirable Baltimore neighborhoods may compete with those in Newport News.
Neighborhoods
Baltimore offers a wider array of neighborhoods, from trendy districts buzzing with nightlife to more tranquil, family-friendly areas. Newport News has a smaller, but comfy selection of neighborhoods that can cater to different lifestyle preferences.
Houses and residents
Type
Baltimore
Newport News
Houses
293,487
81,913
Average household size (people)
2.4
2.5
Median year apartment built
1959
1980
Median year house/condo built
1944
1975
Length of stay in the house since moving in
15.7 years
13.5 years
Houses occupied
254,370 (86.7%)
77,489 (94.6%)
Houses occupied by owners
123,249 (48.5%)
36,527 (47.1%)
Houses occupied by renters
131,121 (51.5%)
40,962 (52.9%)
Median rent asked for vacant for-rent units
$1,254
$590.70
Median monthly housing costs
$1,196
$1,162
Median price asked for vacant for-sale houses and condos
$207,303
$120,982
Estimated median house or condo value
$193,100
$227,200
Median numbers of rooms
5.6
5.4
Median number of rooms in apartments
4.2
4.3
Median number of rooms in houses and condos
6.5
6.7
Median house price - detached houses
$321,473
$267,334
Median house price - in 2-unit structures
$218,934
$380,372
Median house price - in 3-to-4-unit structures
$142,945
$169,768
Median house price - in 5 or more unit structures
$257,173
$127,673
Median house price - mobile homes
$269,877
$31,513
Median house price - occupied boats, rvs, vans etc.
$91,531
$132,027
Median house price - Townhouses or other attached units
$210,096
$194,043
Median house price - All housing units
$246,241
$247,907
Median house age
72
43
Renting percentage
52.3%
48.9%
Housing density (houses/condos per square mile)
3,632.1
1,199.4
House value disparities
38.5%
28.7%
Household income disparities
49.4%
42.3%
Median household income for houses/condes with a mortgage
$85,990
$88,971
Median household income for apartments without a mortgage
$53,334
$56,811
Housing units without a mortgage
2,415 (2.8%)
874 (3.2%)
Housing units with both a second mortgage and home equity loan
5,740 (6.6%)
2,248 (8.2%)
Housing units with a mortgage
84,578 (97.2%)
26,453 (96.8%)
Housing units with a home equity loan
579 (0.7%)
0 (0%)
Housing units with a second mortgage
8,544 (9.8%)
3,277 (12%)
House/condo owner moved in on average (years ago)
14
13
House/condo renter moved in on average (years ago)
3
1
Housing units lacking complete kitchen facilities
6%
1%
Housing units lacking complete plumbing facilities
5.1%
1.6%
Housing units in structures
Housing units in structures
Baltimore
Newport News
One, detached
16.4%
49.0%
One, attached
49.5%
9.2%
Two
4.5%
0.9%
3 or 4
4.9%
6.9%
5 to 9
5.5%
12.2%
10 to 19
4.8%
10.5%
20 to 49
2.8%
2.8%
50 or more
11.4%
6.1%
Mobile homes
0.2%
2.3%
Boats, RVs, vans, etc.
0.1%
0.0%
Median real estate property taxes paid for housing units
Self-employed workers in own not incorporated business
12,671
2,334
State government workers
20,410
2,440
Unpaid family workers
356
36
Industries and Occupations
Baltimore is more diverse in its industries with healthcare, education, and technology being dominant. Newport News, on the other hand, is heavily influenced by its coastal location, with shipbuilding and military industries playing pivotal roles.
Baltimore outshines Newport News in healthcare, with more hospitals and clinics, including renowned medical facilities like Johns Hopkins Hospital. Newport News provides ample healthcare facilities, but with fewer choices compared to Baltimore.
Health (county statistics)
Type
Baltimore
Newport News
General health status score of residents in this county from 1 (poor) to 5 (excellent)
Baltimore, being a larger city, has more extensive infrastructure, including a wider range of public transportation options and larger hospitals. Newport News, though smaller, prides itself on maintaining a well-kept city infrastructure, including quality roads and parks.
HMDA - Conventional home purchase loans - Applications denied
Year
Baltimore
Newport News
1999
2,486
0
2000
2,058
0
2001
1,371
0
2002
1,111
0
2003
1,526
347
2004
2,929
566
2005
4,981
738
2006
5,533
730
2007
3,592
472
2008
1,111
128
2009
381
38
Culture and Food
Culture is where Baltimore excels, with its many museums, art galleries, theaters, and music venues, not forgetting special cuisines like Maryland crabs. Newport News has a more laid-back vibe, with less cultural options but an appeal to seafood lovers.
Sports Teams
Baltimore is a sports city, hosting professional NFL and MLB teams. Newport News doesn't host any professional sports team but has thriving local sports organizations.


 Baltimore, MD
 Newport News, VA