Comparing Baltimore, Maryland, with Rochester, New York, isn't truly a case of apples to apples. Each city has its unique characteristics with notable strengths and areas for improvement spanning across crime and safety, climate, affordability, education, employment, infrastructure, local economy, housing, communities, commuting, taxation, culture, sports, geography, and health care sectors. Both cities have large populations, serve as regional economic engines, and offer diverse recreational amenities, but they also suffer from socioeconomic and urban challenges.
Distance between
Baltimore, MD and
Rochester, NY : 271.5 miles
Baltimore's population is larger by 174%. Its population has decreased by 74,656 people (11.5%) since 2000. The population of Rochester has decreased by 9,167 people (4.2%) during that time.
Baltimore has struggled with high crime rates, particularly violent crimes, historically. Still, the city has been investing in safety and community engagement programs aimed at reducing crime. Rochester, while experiencing some crime, tends to have a lower violent crime rate than Baltimore, and like Baltimore, community policing and engagement programs are continuously being implemented.
City-data.com crime index counts serious crimes and violent crime more heavily. It adjusts for the number of visitors and daily workers commuting into cities. (higher means more crime, U.S. average = 301.1)
City-data.com crime index counts serious crimes and violent crime more heavily. It adjusts for the number of visitors and daily workers commuting into cities. (higher means more crime, U.S. average = 301.1)
Sex Offenders
According to our data, there are 1,558 registered sex offenders living in Baltimore and 985 registered sex offenders living in . The ratio of residents to sex offenders in Baltimore is 395 to 1; the ratio in Rochester is 212 to 1. The number of registered sex offenders compared to the number of residents is a smaller in Baltimore than in Rochester.
Cost of Living
The cost of living in Baltimore is generally higher than in Rochester. Housing is the main driver in cost differences, with Baltimore's median home price significantly higher than Rochester's. However, Baltimore's median household income is also higher.
Income Tax
Income tax rates are steeper for residents in Rochester due to New York's progressive state income tax, compared to the flat rate in Maryland.
Property Tax
Property tax rates are higher in Rochester than in Baltimore. However, this can be offset by the lower cost of housing in Rochester.
Sales Tax
Both cities have similar sales tax rates, with Maryland and New York State having rates of 6% and 4% respectively. However, Rochester has additional local sales tax bringing the total to 8%.
Income
Type
Baltimore
Rochester
Estimated median household income
$54,652
$41,980
Estimated per capita income
$35,091
$26,950
Cost of living index (U.S. average is 100)
105.7
102.1
If you make $50,000 in Rochester, you will have to make $51,763 in Baltimore to maintain the same standard of living.
Geographical Conditions
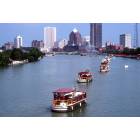
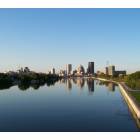
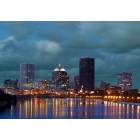
Baltimore lies on the Patapsco River close to Chesapeake Bay, offering coastal vibes. Rochester is inland, nestled along Lake Ontario, and features numerous parks and waterfalls.
Both cities host prestigious universities. Baltimore is home to Johns Hopkins University and University of Maryland, Baltimore. Rochester houses the University of Rochester and the Rochester Institute of Technology. However, in public K-12 education, both cities grapple with underfunding and achievement gaps.
Baltimore's economy is diverse, with sectors such as health care, education, and technology playing key roles. Rochester's economy leans heavily towards health care and education, but also includes advanced manufacturing and optics.
Biggest Employers
Johns Hopkins University and Hospital is Baltimore's largest employer. In Rochester, the University of Rochester and Rochester Regional Health are amongst the biggest employers.
There were 191 building permits issued in Baltimore in 2012 (116 more than in 2011) compared to 45 building permits issued in Rochester in 2012 (1 less than in 2011).
In Baltimore (Baltimore city), 87.4% voted for Democrats and 11.1% for Republicans in 2012 Presidential Election. In Rochester (Monroe County), 58.2% voted for Democrats and 40.1% for Republicans.
Elections
Type
Democrats
Republicans
Other
Year
Baltimore
Rochester
Baltimore
Rochester
Baltimore
Rochester
2020
87.5%
59.5%
10.7%
38.4%
1.8%
2.2%
2016
84.8%
54.3%
10.5%
39.3%
4.6%
6.5%
2012
87.4%
58.2%
11.1%
40.1%
1.4%
1.7%
2008
87.6%
58.4%
11.7%
40.6%
0.6%
1.0%
2004
82.5%
50.7%
17.1%
47.8%
0.5%
1.5%
2000
82.9%
51.0%
14.2%
44.5%
2.9%
4.5%
1996
79.3%
53.2%
15.5%
37.3%
5.1%
9.5%
Breakdown of population affiliated with a religious congregation
Type
Adherents
Congregations
Religion
Baltimore
Rochester
Baltimore
Rochester
CATHOLIC CHURCH
11.0%
25.7%
8.2%
11.2%
EPISCOPAL CHURCH
1.6%
0.7%
4.0%
3.5%
AMERICAN BAPTIST CHURCHES IN THE USA
1.4%
1.6%
2.2%
5.1%
SOUTHERN BAPTIST CONVENTION
1.4%
0.1%
7.3%
2.1%
EVANGELICAL LUTHERAN CHURCH IN AMERICA
1.0%
1.1%
4.3%
3.3%
MUSLIM ESTIMATE
0.6%
1.2%
1.5%
1.1%
SEVENTH DAY ADVENTIST CHURCH
0.5%
0.2%
1.5%
1.4%
LUTHERAN CHURCH
0.4%
1.0%
1.8%
1.9%
Weather
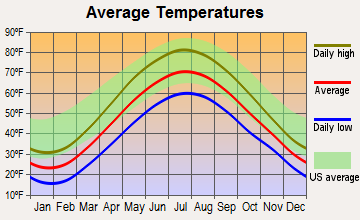
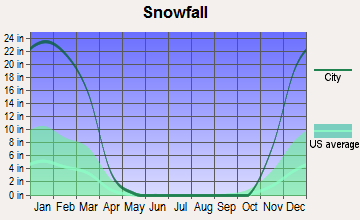
The climates of the two cities are significantly different. Baltimore's weather is generally milder, with hot, humid summers and chilly, rather wet winters. Rochester, on the other hand, experiences snowy winters due to its proximity to the Great Lakes, and milder, less humid summers.
Weather and climate
Type
Baltimore
Rochester
Temperature - Average
54.5°F
47.6°F
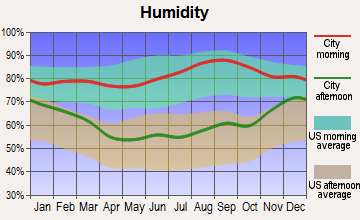
Humidity - Average morning or afternoon humidity
70.4%
76.5%
Humidity - Differences between morning and afternoon humidity
36%
34%
Humidity - Maximum monthly morning or afternoon humidity
84%
87%
Humidity - Minimum monthly morning or afternoon humidity
48%
53%
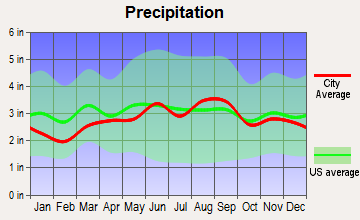
Precipitation - Yearly average
42.9 in
33.7 in
Snowfall - Yearly average
39.6 in
178.7 in
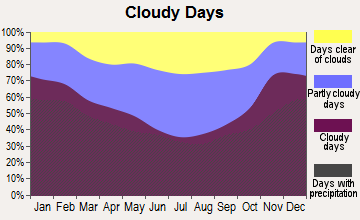
Clouds - Number of days clear of clouds
17.5%
10.2%
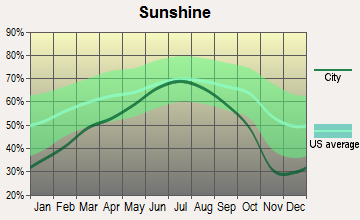
Sunshine amount - Average
60.3%
52.1%
Sunshine amount - Differences during a year
16%
43%
Sunshine amount - Maximum monthly
63%
67%
Sunshine amount - Minimum monthly
47%
24%
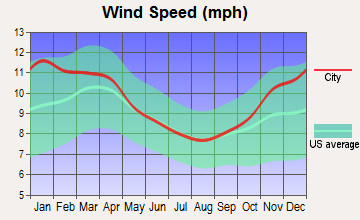
Wind speed - Average
7.9 mph
9.7 mph
Average climate in Baltimore, Maryland
Average climate in Rochester, New York
Air pollution
Type
AQI
CO
NO2
OZONE
PM10
PM25
SO2
Year
Baltimore
Rochester
Baltimore
Rochester
Baltimore
Rochester
Baltimore
Rochester
Baltimore
Baltimore
Rochester
Baltimore
Rochester
2018
89
65
0.23
0.24
11.8
N/A
28.3
27.4
N/A
N/A
7.9
6.1
0.1
0.2
2017
89
67
0.25
0.23
12.1
N/A
27.7
29.3
N/A
N/A
8.2
6.2
0.2
0.5
2016
102
67
0.26
0.21
13.0
N/A
28.3
28.1
N/A
N/A
7.7
6.1
0.3
0.7
2015
89
65
0.28
0.21
12.4
N/A
28.3
26.4
N/A
N/A
9.5
7.1
0.4
0.8
2014
82
62
0.25
0.20
11.8
N/A
25.7
26.8
N/A
N/A
10.9
6.8
0.6
1.0
2013
86
64
0.22
0.20
10.7
N/A
25.6
27.5
N/A
N/A
9.6
7.7
0.5
0.9
2012
98
73
0.24
0.21
11.3
N/A
25.0
27.9
N/A
N/A
11.2
6.8
0.5
1.0
2011
101
67
0.24
0.19
12.5
8.1
25.1
27.2
N/A
N/A
12.1
6.8
0.8
1.1
2010
110
74
0.24
0.43
13.1
N/A
26.9
27.7
N/A
N/A
12.2
7.3
1.0
2.2
2009
84
64
0.23
0.42
12.2
N/A
23.5
24.4
N/A
N/A
10.4
6.9
1.4
2.5
2008
96
83
0.25
0.38
13.6
N/A
21.6
26.6
N/A
N/A
12.8
8.5
1.8
2.9
2007
107
86
0.21
0.42
13.8
N/A
23.2
25.6
N/A
N/A
14.0
9.2
2.5
4.1
2006
112
58
N/A
0.49
12.0
N/A
24.6
23.6
N/A
N/A
14.7
N/A
N/A
4.2
2005
111
67
N/A
0.46
14.3
N/A
26.3
23.5
23.0
N/A
17.1
N/A
N/A
4.2
2004
108
43
N/A
0.48
15.3
N/A
28.0
21.6
23.1
N/A
16.3
N/A
N/A
5.1
2003
110
66
N/A
0.49
17.8
N/A
22.4
24.9
N/A
N/A
13.9
N/A
N/A
5.4
2002
119
84
N/A
0.43
17.4
N/A
19.4
27.7
N/A
N/A
16.3
N/A
5.8
5.2
2001
104
70
N/A
0.42
18.2
N/A
23.9
25.7
N/A
N/A
N/A
N/A
6.0
7.6
2000
101
62
N/A
0.42
17.0
N/A
22.4
23.3
N/A
N/A
N/A
N/A
6.3
5.7
Natural disasters
Type
Baltimore
Rochester
Tornado activity compared to U.S. average
117.8%
17.1%
Earthquake activity compared to U.S. average
40.6%
31.8%
Natural disasters compared to U.S. average
0%
17%
Transportation
Baltimore has robust public transit services, including buses, light rail, and a subway system. It also provides the MARC commuter rail to Washington, D.C. In comparison, Rochester's public transit is more limited, primarily serviced by buses, and it lacks a subway or light-rail system.
Transport
Type
Baltimore
Rochester
Amtrak stations
2
1
Amtrak stations nearby
2
1
FAA registered aircraft
136
151
FAA registered aircraft manufacturers and dealers
2
1
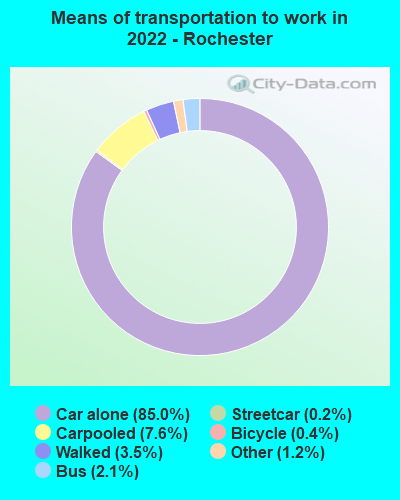
Means of transportation to work
Type
Baltimore
Rochester
Bicycle
0.4%
0.7%
Bus
6.2%
2.9%
Carpooled
7.3%
10%
Car alone
77.2%
81.8%
Motorcycle
0%
0.1%
Railroad
0.3%
0%
Streetcar
1.2%
0.2%
Subway
0.2%
0%
Taxicab
0.7%
0.3%
Walked
4.5%
2.8%
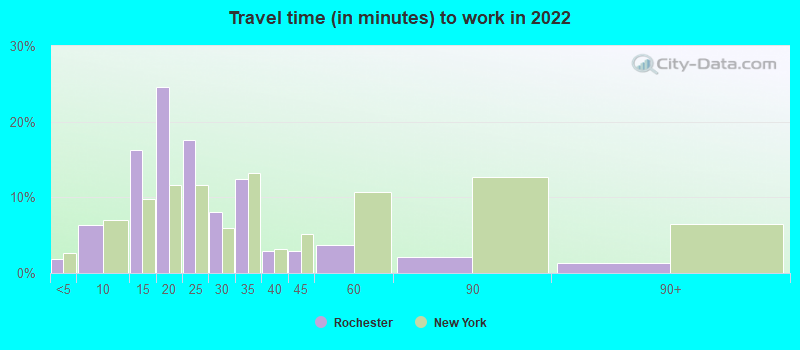
Average travel time to work
Type
Baltimore
Rochester
Average
32.3 min
22.3 min
Other means
26.3 min
18.9 min
Public transportation
46.8 min
38.9 min
Private vehicle occupancy
Type
Baltimore
Rochester
Average
1.1
1.2
Drove alone
90.7%
85.7%
In 2 person carpool
7.5%
11%
In 3 person carpool
1%
1.5%
In 4 person carpool
0.4%
1.2%
In 5-6 person carpool
0.3%
0.4%
In 7+ person carpool
0.2%
0.2%
How many people usually rode to work in the car, truck or van.
Real Estate
Baltimore's real-estate market is more expensive than Rochester's. However, there’s a vast range of property types available in both cities, from compact apartments to sprawling suburban homes.
Neighborhoods
Both cities feature diverse neighborhoods; Baltimore is well-known for its historic row houses, and Rochester for its high-quality suburbs.
Houses and residents
Type
Baltimore
Rochester
Houses
293,487
103,333
Average household size (people)
2.4
2.3
Median year apartment built
1959
1945
Length of stay in the house since moving in
15.7 years
15.3 years
Houses occupied
254,370 (86.7%)
93,263 (90.3%)
Houses occupied by owners
123,249 (48.5%)
38,125 (40.9%)
Houses occupied by renters
131,121 (51.5%)
55,138 (59.1%)
Median rent asked for vacant for-rent units
$1,254
$630.70
Median monthly housing costs
$1,196
$881
Median price asked for vacant for-sale houses and condos
$207,303
$160,052
Estimated median house or condo value
$193,100
$109,700
Median numbers of rooms
5.6
5.2
Median number of rooms in apartments
4.2
4.1
Median number of rooms in houses and condos
6.5
6.3
Median house price - detached houses
$321,473
$130,415
Median house price - in 2-unit structures
$218,934
$173,805
Median house price - in 3-to-4-unit structures
$142,945
$340,804
Median house price - in 5 or more unit structures
$257,173
$428,520
Median house price - mobile homes
$269,877
$28,854
Median house price - Townhouses or other attached units
$210,096
$183,602
Median house price - All housing units
$246,241
$148,505
Median house age
72
2,021
Renting percentage
52.3%
62.3%
Housing density (houses/condos per square mile)
3,632.1
2,883.6
House value disparities
38.5%
40.7%
Household income disparities
49.4%
48.9%
Median household income for houses/condes with a mortgage
$85,990
$69,171
Median household income for apartments without a mortgage
$53,334
$52,361
Housing units without a mortgage
2,415 (2.8%)
1,391 (5.4%)
Housing units with both a second mortgage and home equity loan
5,740 (6.6%)
3,040 (11.8%)
Housing units with a mortgage
84,578 (97.2%)
24,344 (94.6%)
Housing units with a home equity loan
579 (0.7%)
99 (0.4%)
Housing units with a second mortgage
8,544 (9.8%)
3,389 (13.2%)
House/condo owner moved in on average (years ago)
14
15
House/condo renter moved in on average (years ago)
3
3
Housing units lacking complete kitchen facilities
6%
1.8%
Housing units lacking complete plumbing facilities
5.1%
1.1%
Housing units in structures
Housing units in structures
Baltimore
Rochester
One, detached
16.4%
47.7%
One, attached
49.5%
5.8%
Two
4.5%
17.4%
3 or 4
4.9%
8.0%
5 to 9
5.5%
5.0%
10 to 19
4.8%
2.7%
20 to 49
2.8%
4.4%
50 or more
11.4%
8.7%
Mobile homes
0.2%
0.3%
Boats, RVs, vans, etc.
0.1%
0.0%
Median real estate property taxes paid for housing units
Self-employed workers in own not incorporated business
12,671
4,711
State government workers
20,410
2,362
Unpaid family workers
356
427
Industries and Occupations
Health care and education are primary sectors in both cities. Baltimore has a notable presence of bioscience and technology companies, while Rochester is known for its legacy in optics and imaging industries.
Both cities deliver high-quality health care through renowned institutions, like Johns Hopkins in Baltimore and the University of Rochester Medical Center in Rochester.
Health (county statistics)
Type
Baltimore
Rochester
General health status score of residents in this county from 1 (poor) to 5 (excellent)
Both Baltimore and Rochester have older infrastructures with ongoing renovation and improvement projects. Baltimore boasts a seaport, offering more robust trade and commercial opportunities.
Infrastructure
Type
Baltimore
Rochester
Hospitals
45
14
TV stations
19
13
Arenas or stadiums
3
2
Bank branches located here
215
106
Bank institutions located here
44
15
Main business address for public companies
27
14
Nuclear power plants
0
1
Nuclear power plants nearby
0
1
Drinking water stations with no reported violations in the past
13
2
Drinking water stations with reported violations in the past
HMDA - Conventional home purchase loans - Applications denied
Year
Baltimore
Rochester
1999
2,486
374
2000
2,058
555
2001
1,371
427
2002
1,111
356
2003
1,526
388
2004
2,929
476
2005
4,981
704
2006
5,533
872
2007
3,592
739
2008
1,111
319
2009
381
101
Culture and Food
Both cities have rich histories, impressive art scenes, and unique food cultures. Baltimore is famous for its crab cakes and Old Bay Seasoning, whereas Rochester is known for its "white hots" hot dogs and Garbage Plates.
Sports Teams
Baltimore is home to two big league sports teams, the Ravens (NFL) and the Orioles (MLB). While Rochester lacks major league teams, it has successful minor league teams, like the Rochester Red Wings (baseball) and the Amerks (hockey).


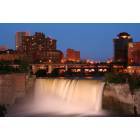
 Baltimore, MD
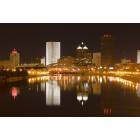
 Rochester, NY