Brooklyn, a borough of New York City, and Oklahoma City, the capital of Oklahoma, offer vastly different lifestyles. Located on the east coast, Brooklyn is known for its urban vibes, cultural diversity, access to vast job opportunities, and vibrant arts scene but also higher living costs and taxes. In contrast, Oklahoma City, located in the heartland, exhibits a relaxed pace of life, lower living costs, and the quintessential Midwestern charm. The counterpoint of these two cities provides a unique perspective on American
life.
Crime rates differ significantly between Brooklyn and Oklahoma City. Brooklyn, while having certain neighborhoods with high crime rates, overall, benefits from gentrification and increased police presence leading to lower crime rates over the years. Oklahoma City, though smaller, has a slightly higher crime rate than the national average, affecting both tourists' feel of security as well as residents' quality of living.
Cost of Living
Brooklyn is significantly more expensive than Oklahoma City due to its higher housing, food, and general living expenses. Those looking to save money would find Oklahoma City more appealing, as the city boasts a lower cost of living than the national average, especially in terms of housing costs.
Income Tax
New York state has a progressive income tax system where the rate increases as income rises, making it higher than other states. Oklahoma's state income tax rate is significantly lower.
Property Tax
Property taxes in Brooklyn are relatively high when compared to the national average. On the other side, property taxes in Oklahoma City are lower, due to the state's low property tax rate.
Sales Tax
New York City has a relatively high sales tax rate, including both state and city taxes. Whereas, Oklahoma City also has a high combined tax rate although cheaper cost of living balances out paying these taxes.
Income
Type
Brooklyn
Oklahoma City
Estimated median household income
$67,567
$59,214
Estimated per capita income
$39,536
$31,630
Cost of living index (U.S. average is 100)
185.4
85.4
If you make $50,000 in Oklahoma City, you will have to make $108,548 in Brooklyn to maintain the same standard of living.
Geographical Conditions
Brooklyn is located on the western end of Long Island and enjoys proximity to the Atlantic Ocean. Oklahoma City is found in the Great Plains region, known for its plains, low hills and occasional tableland.
Geographical information
Type
Brooklyn
Oklahoma City
Land area
70.6 sq. miles
607 sq. miles
Population density
35,956 people per sq. mile
1,133 people per sq. mile
Relative area comparison
Brooklyn, NY Oklahoma City, OK
Education
Both cities prioritize education, although nuances exist. Brooklyn homes have many highly-rated public, private schools, and also famous universities like NYU. In contrast, Oklahoma City has a well-funded public school district along with respected universities such as the University of Oklahoma.
Brooklyn's work and economic scenes are dynamic due to New York City's global standing. It offers opportunities in a plethora of industries like finance, publishing, fashion, marketing, etc. Oklahoma City offers a growing economy with flourishing sectors in aerospace, biosciences, energy, and healthcare.
Biggest Employers
Brooklyn's biggest employers are from diverse sectors like financial services (JP Morgan Chase), healthcare (NewYork-Presbyterian Healthcare), and education (New York University). Oklahoma City's top employers include INTEGRIS Health, the University of Oklahoma, and the City of Oklahoma City.
In Brooklyn (Kings County), 82.1% voted for Democrats and 16.9% for Republicans in 2012 Presidential Election. In Oklahoma City (Oklahoma County), 41.7% voted for Democrats and 58.3% for Republicans.
Elections
Type
Democrats
Republicans
Other
Year
Brooklyn
Oklahoma City
Brooklyn
Oklahoma City
Brooklyn
Oklahoma City
2020
76.9%
48.1%
22.2%
49.2%
1.0%
2.7%
2016
79.6%
41.2%
17.5%
51.7%
2.9%
7.1%
2012
82.1%
41.7%
16.9%
58.3%
0.9%
0.0%
2008
79.9%
41.6%
20.1%
58.4%
0.0%
0.0%
2004
75.0%
35.8%
24.3%
64.2%
0.7%
0.0%
2000
81.0%
36.6%
15.7%
62.3%
3.3%
1.1%
1996
80.1%
36.5%
15.1%
54.7%
4.9%
8.8%
Breakdown of population affiliated with a religious congregation
Type
Adherents
Congregations
Religion
Brooklyn
Oklahoma City
Brooklyn
Oklahoma City
CATHOLIC CHURCH
24.9%
8.5%
7.5%
3.0%
MUSLIM ESTIMATE
3.8%
0.3%
4.2%
0.6%
AMERICAN BAPTIST CHURCHES IN THE USA
1.9%
0.3%
3.8%
0.1%
SEVENTH DAY ADVENTIST CHURCH
1.0%
0.4%
5.2%
1.5%
EPISCOPAL CHURCH
0.7%
0.7%
2.3%
1.3%
SOUTHERN BAPTIST CONVENTION
0.2%
20.7%
2.4%
20.0%
INTERNA PENTECO HOLINESS CHURCH
0.1%
0.7%
0.3%
2.9%
LUTHERAN CHURCH
0.0%
0.5%
0.6%
1.0%
Weather
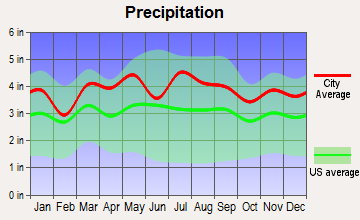
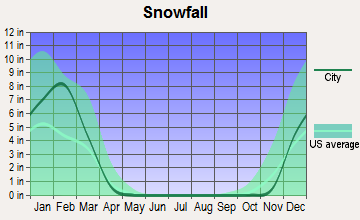
Weather patterns between the two cities vary greatly. Brooklyn experiences a humid subtropical climate with hot summers and cold winters, while Oklahoma City is characterized by hot, muggy summers and short, freezing winters with extreme temperature fluctuations. Brooklynites experience snow during winter, which is a rarity for people in Oklahoma City.
Weather and climate
Type
Brooklyn
Oklahoma City
Temperature - Average
55.1°F
60.1°F
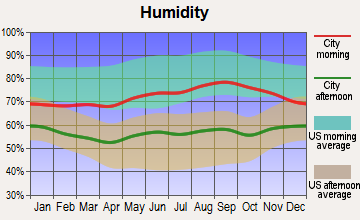
Humidity - Average morning or afternoon humidity
68.7%
73.1%
Humidity - Differences between morning and afternoon humidity
26.1%
35%
Humidity - Maximum monthly morning or afternoon humidity
76.8%
85%
Humidity - Minimum monthly morning or afternoon humidity
50.7%
50%
Precipitation - Yearly average
46.5 in
35.7 in
Snowfall - Yearly average
53.4 in
17.2 in
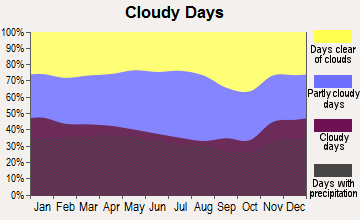
Clouds - Number of days clear of clouds
16.7%
23.1%
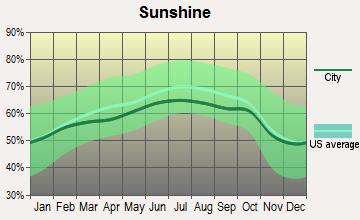
Sunshine amount - Average
60.2%
72.1%
Sunshine amount - Differences during a year
20%
21%
Sunshine amount - Maximum monthly
64%
79%
Sunshine amount - Minimum monthly
44%
58%
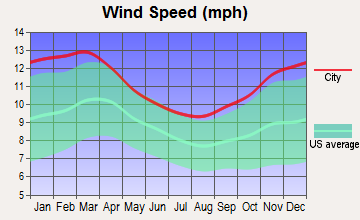
Wind speed - Average
10.6 mph
12.3 mph
Average climate in Brooklyn, New York
Average climate in Oklahoma City, Oklahoma
Air pollution
Type
AQI
CO
NO2
OZONE
PB
PM10
PM25
SO2
Year
Brooklyn
Oklahoma City
Brooklyn
Oklahoma City
Brooklyn
Oklahoma City
Brooklyn
Oklahoma City
Brooklyn
Oklahoma City
Brooklyn
Oklahoma City
Brooklyn
Oklahoma City
Brooklyn
Oklahoma City
2018
93
85
0.31
0.29
16.8
6.6
24.2
31.9
N/A
0.002
N/A
21.3
7.0
9.6
0.4
0.0
2017
95
82
0.25
0.32
17.0
6.7
24.5
33.0
N/A
0.002
N/A
20.7
7.1
8.9
0.3
0.0
2016
93
72
0.31
0.29
17.7
6.6
24.8
31.9
N/A
0.002
N/A
19.4
7.2
8.5
0.5
0.2
2015
100
76
0.38
0.24
18.2
7.0
24.1
31.5
N/A
0.002
N/A
19.1
8.0
7.8
0.7
0.5
2014
95
84
0.38
0.15
18.5
7.1
23.5
32.4
N/A
0.002
N/A
N/A
7.8
8.7
0.9
0.1
2013
96
84
0.41
0.14
18.9
8.6
24.4
32.8
N/A
0.002
N/A
N/A
8.5
9.3
1.0
0.2
2012
98
97
0.44
0.13
18.3
9.4
24.4
34.0
N/A
0.007
N/A
N/A
9.2
7.9
1.6
0.3
2011
107
107
0.43
0.24
20.7
9.9
23.6
36.3
N/A
0.003
N/A
N/A
10.3
9.9
2.4
0.8
2010
112
81
0.43
0.30
19.4
8.8
24.7
31.7
N/A
0.002
N/A
N/A
10.0
9.8
2.3
0.7
2009
104
82
0.43
0.52
21.5
8.1
20.7
31.9
N/A
0.002
N/A
N/A
10.2
10.2
3.1
0.7
2008
109
78
0.47
0.51
22.6
9.8
21.3
31.0
0.013
N/A
N/A
N/A
11.8
N/A
4.1
1.4
2007
121
81
0.53
0.44
23.5
10.2
20.8
29.4
0.016
N/A
N/A
N/A
12.4
N/A
4.8
2.0
2006
116
95
0.61
0.43
24.2
10.1
20.7
33.7
0.018
N/A
N/A
N/A
13.0
N/A
5.7
1.2
2005
107
88
0.74
0.38
26.1
11.6
19.6
31.0
N/A
N/A
N/A
N/A
N/A
N/A
7.5
1.3
2004
106
75
0.74
0.46
25.8
10.5
18.5
28.6
0.030
N/A
N/A
N/A
N/A
N/A
7.1
0.6
2003
107
87
0.81
0.42
27.4
10.9
18.4
30.8
0.021
N/A
26.9
N/A
N/A
N/A
7.4
N/A
2002
122
91
0.76
0.35
27.9
14.3
19.9
29.0
0.008
N/A
26.2
N/A
N/A
N/A
6.5
2.0
2001
121
87
0.80
0.69
29.5
13.1
22.3
31.0
0.020
N/A
27.3
N/A
N/A
N/A
7.8
1.8
2000
115
89
0.92
0.66
29.8
13.4
20.3
29.5
0.022
N/A
22.2
N/A
N/A
N/A
7.4
3.0
Natural disasters
Type
Brooklyn
Oklahoma City
Tornado activity compared to U.S. average
56.4%
353.4%
Earthquake activity compared to U.S. average
30.8%
938.9%
Natural disasters compared to U.S. average
17%
43%
Transportation
Brooklyn benefits from New York City's remarkable public transportation system, making commutes relatively easy. Oklahoma City is more car-dependent with lesser public transit systems, due to the city's sprawl.
Transport
Type
Brooklyn
Oklahoma City
Amtrak stations
0
1
Amtrak stations nearby
3
2
FAA registered aircraft
149
0
FAA registered aircraft manufacturers and dealers
2
0
Means of transportation to work
Type
Brooklyn
Oklahoma City
Bicycle
0.5%
0.2%
Bus
10.4%
0.3%
Carpooled
8%
8.6%
Car alone
22.4%
87.6%
Railroad
1.4%
0%
Streetcar
0.2%
0%
Subway
44.8%
0%
Taxicab
0.7%
0.2%
Walked
8.8%
1.4%
Average travel time to work
Type
Brooklyn
Oklahoma City
Average
44.5 min
25.6 min
Real Estate
Brooklyn's real estate is in high-demand with a median home value significantly above the national average. On the other hand, Oklahoma City has a robust but affordable housing market with the median home price being lower than the national average.
Neighborhoods
Brooklyn consists of diverse neighborhoods like artistic Williamsburg, family-friendly Park Slope, and upscale DUMBO. Oklahoma City has an array of neighborhoods from the artsy Paseo Arts District to the trendy Plaza District.
Houses and residents
Type
Brooklyn
Oklahoma City
Houses
930,866
302,241
Average household size (people)
2.7
2.5
Houses occupied
880,727 (94.6%)
275,285 (91.1%)
Houses occupied by owners
238,290 (27.1%)
164,470 (59.7%)
Houses occupied by renters
642,437 (72.9%)
110,815 (40.3%)
Median rent asked for vacant for-rent units
$1,589
$1,241
Median price asked for vacant for-sale houses and condos
$1,621,117
$278,299
Estimated median house or condo value
$793,300
$190,900
Median number of rooms in apartments
3.6
4.3
Median number of rooms in houses and condos
5.2
6.2
Renting percentage
72.3%
40.3%
Housing density (houses/condos per square mile)
13,184
497.9
Household income disparities
48.5%
44.3%
Housing units without a mortgage
29,251 (32.9%)
1,238 (1.2%)
Housing units with both a second mortgage and home equity loan
183 (0.2%)
4,838 (4.7%)
Housing units with a mortgage
59,793 (67.1%)
100,798 (98.8%)
Housing units with a home equity loan
4,512 (5.1%)
123 (0.1%)
Housing units with a second mortgage
5,098 (5.7%)
5,921 (5.8%)
Housing units lacking complete kitchen facilities
1.5%
3.1%
Housing units lacking complete plumbing facilities
Self-employed workers in own not incorporated business
45,971
20,964
State government workers
27,527
17,132
Unpaid family workers
2,234
555
Industries and Occupations
New York's diverse economy ensures a wide range of industries in Brooklyn spanning from healthcare, professional services to technology and creative roles. Oklahoma City's economy heavily relies on the energy sector, government jobs, and healthcare.
Brooklyn offers world-class healthcare with access to some of the top hospitals in the country like NYU Langone Health. Oklahoma City, while not as well known in the medical field, still provides good-quality healthcare with facilities like Integris Baptist Medical Center.
Health (county statistics)
Type
Brooklyn
Oklahoma City
General health status score of residents in this county from 1 (poor) to 5 (excellent)
Brooklyn has an extensive infrastructure with iconic architectural structures, extensive public transportation system, and advanced utilities. In contrast, Oklahoma City has been developing its infrastructure with investments in public transport and citywide renovation projects.
Infrastructure
Type
Brooklyn
Oklahoma City
Hospitals
104
61
TV stations
29
20
Bank branches located here
271
183
Bank institutions located here
41
44
Main business address for public companies
9
15
Drinking water stations with no reported violations in the past
12
4
Drinking water stations with reported violations in the past
75
21
Schools
School facilities
Type
Brooklyn
Oklahoma City
Private elementary/middle schools
151
19
Private high schools
128
10
Public elementary/middle schools
405
126
Public high schools
176
25
Colleges/Universities
48
22
Culture and Food
Brooklyn is a melting pot of diverse cultures with a rich celebration of art, theater, music, and food from around the world. Oklahoma City is likewise culturally rich with strong influences from its cowboy and Native American heritage, resulting in a unique, vibrant culture and food scene.
Sports Teams
Brooklyn is home to renowned sports teams like the Brooklyn Nets (NBA) and the New York Islanders (NHL). Oklahoma City hosts the Oklahoma City Thunder (NBA) and several minor league teams.

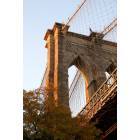


 Brooklyn, NY
 Oklahoma City, OK