Brooklyn, NY, and Phoenix, AZ, each offer unique lifestyle choices that could fit different priorities and preferences. As popular destinations for relocation and tourism, each city boasts an array of strengths and weaknesses. Factors such as cost of living, weather patterns, safety, education, work opportunities, infrastructure, and cultural experiences vary significantly between these two cities. This article will provide an in-depth comparison of the two locations, to assist those considering relocating or visiting either city.
Brooklyn, a borough of New York City, has seen a significant reduction in crime rates over the past few decades, yet it still has higher crime rates compared to Phoenix. Both cities exhibit a mixed bag in terms of neighborhood safety, with some areas safer than others. Police presence is generally strong in both cities, with community policing initiatives underway. For visitors, it is generally safe in tourist areas in both cities, but awareness and caution are always recommended.
Cost of Living
The cost of living is significantly higher in Brooklyn than Phoenix. Housing, groceries, transportation, and health care costs are typically more expensive in Brooklyn. However, salary scales often reflect this difference, with potentially higher wages offered in Brooklyn to offset the increased cost of living.
Income Tax
New York State and City have progressive income tax systems with rates generally higher than Arizona. This factor should be considered by those planning to work in either city.
Property Tax
Property taxes in Brooklyn are high, but rates can vary depending on the neighborhood. Phoenix has lower property taxes, which combined with lower home prices, makes home ownership more attainable for many.
Sales Tax
New York has a higher state and city sales tax compared to Arizona, which may impact the cost of goods and services. However, tourists should note that essential items like food and clothing are tax-free in New York.
Income
Type
Brooklyn
Phoenix
Estimated median household income
$67,567
$68,435
Estimated per capita income
$39,536
$35,073
Cost of living index (U.S. average is 100)
185.4
101.2
If you make $50,000 in Phoenix, you will have to make $91,601 in Brooklyn to maintain the same standard of living.
Geographical Conditions
Brooklyn is on the eastern seaboard, with diverse urban geography and close to beaches. Phoenix is landlocked in the desert, with unique desert landscapes and proximity to Grand Canyon.
Geographical information
Type
Brooklyn
Phoenix
Land area
70.6 sq. miles
474.9 sq. miles
Population density
35,956 people per sq. mile
3,421.1 people per sq. mile
Relative area comparison
Brooklyn, NY Phoenix, AZ
Education
Both Brooklyn and Phoenix have a range of public and private schools, with quality varying by district. Brooklyn is home to prestigious universities like the Pratt Institute and Brooklyn College. Phoenix also has quality higher education institutions, including Arizona State University.
Brooklyn's economy reflects the greater New York City area, with a high concentration of jobs in finance, healthcare, education, and the arts. Phoenix has a robust economy with strong sectors in healthcare, finance, and technology, and a growing tech startup scene.
Biggest Employers
In Brooklyn, the biggest employers include JP Morgan Chase, the City of New York, and Northwell Health. Phoenix is home to several large employers as well, including Banner Health, Walmart, and Wells Fargo.
In Brooklyn (Kings County), 82.1% voted for Democrats and 16.9% for Republicans in 2012 Presidential Election. In Phoenix (Maricopa County), 43.6% voted for Democrats and 54.3% for Republicans.
Elections
Type
Democrats
Republicans
Other
Year
Brooklyn
Phoenix
Brooklyn
Phoenix
Brooklyn
Phoenix
2020
76.9%
50.2%
22.2%
48.0%
1.0%
1.8%
2016
79.6%
44.9%
17.5%
47.7%
2.9%
7.5%
2012
82.1%
43.6%
16.9%
54.3%
0.9%
2.1%
2008
79.9%
44.0%
20.1%
54.5%
0.0%
1.5%
2004
75.0%
42.4%
24.3%
57.0%
0.7%
0.6%
2000
81.0%
43.0%
15.7%
53.4%
3.3%
3.6%
1996
80.1%
44.5%
15.1%
47.2%
4.9%
8.2%
Breakdown of population affiliated with a religious congregation
Type
Adherents
Congregations
Religion
Brooklyn
Phoenix
Brooklyn
Phoenix
CATHOLIC CHURCH
24.9%
13.6%
7.5%
4.3%
MUSLIM ESTIMATE
3.8%
0.2%
4.2%
1.0%
AMERICAN BAPTIST CHURCHES IN THE USA
1.9%
0.2%
3.8%
0.6%
SEVENTH DAY ADVENTIST CHURCH
1.0%
0.4%
5.2%
2.0%
EPISCOPAL CHURCH
0.7%
0.3%
2.3%
1.3%
EVANGELICAL LUTHERAN CHURCH IN AMERICA
0.2%
0.8%
2.0%
2.0%
SOUTHERN BAPTIST CONVENTION
0.2%
1.9%
2.4%
6.5%
LUTHERAN CHURCH
0.0%
0.5%
0.6%
1.5%
VINEYARD USA
0.0%
0.3%
0.1%
0.6%
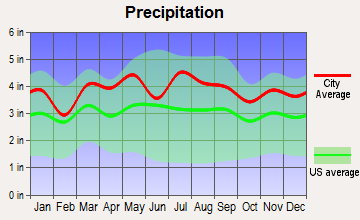
Weather
Weather contrasts starkly between the two cities. Brooklyn experiences all four seasons distinctly, with cold winters and hot, humid summers. Phoenix, in contrast, has a desert climate with very hot summers and mild winters. Whereas heavy snowfall in Brooklyn could potentially disrupt activities, extreme summer heat in Phoenix could be uncomfortable and may necessitate indoor activities or outings during cooler parts of the day.
Weather and climate
Type
Brooklyn
Phoenix
Temperature - Average
55.1°F
71.5°F
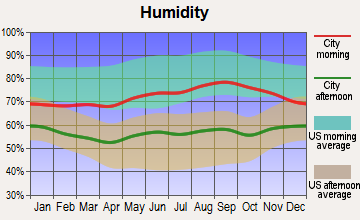
Humidity - Average morning or afternoon humidity
68.7%
37.5%
Humidity - Differences between morning and afternoon humidity
26.1%
48%
Humidity - Maximum monthly morning or afternoon humidity
76.8%
60%
Humidity - Minimum monthly morning or afternoon humidity
50.7%
12%
Precipitation - Yearly average
46.5 in
8.7 in
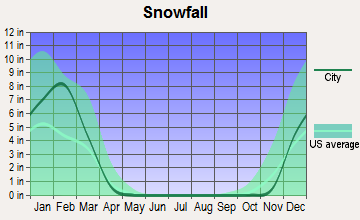
Snowfall - Yearly average
53.4 in
0 in
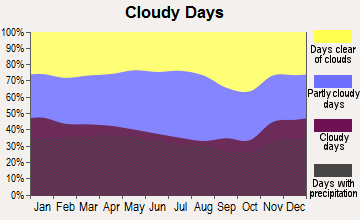
Clouds - Number of days clear of clouds
16.7%
35.3%
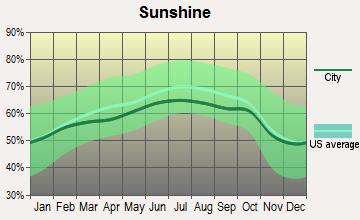
Sunshine amount - Average
60.2%
92.8%
Sunshine amount - Differences during a year
20%
16%
Sunshine amount - Maximum monthly
64%
95%
Sunshine amount - Minimum monthly
44%
79%
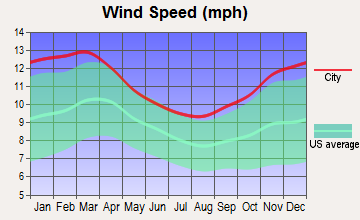
Wind speed - Average
10.6 mph
6.6 mph
Average climate in Brooklyn, New York
Average climate in Phoenix, Arizona
Air pollution
Type
AQI
CO
NO2
OZONE
PB
PM10
PM25
SO2
Year
Brooklyn
Phoenix
Brooklyn
Phoenix
Brooklyn
Phoenix
Brooklyn
Phoenix
Brooklyn
Brooklyn
Phoenix
Brooklyn
Phoenix
Brooklyn
Phoenix
2018
93
156
0.31
0.38
16.8
15.2
24.2
28.5
N/A
N/A
N/A
34.8
7.0
8.6
0.4
0.6
2017
95
120
0.25
0.41
17.0
15.9
24.5
28.6
N/A
N/A
N/A
34.9
7.1
7.6
0.3
1.4
2016
93
114
0.31
0.44
17.7
15.8
24.8
27.3
N/A
N/A
N/A
30.6
7.2
7.7
0.5
0.4
2015
100
102
0.38
0.46
18.2
17.6
24.1
27.1
N/A
N/A
N/A
26.2
8.0
7.9
0.7
0.9
2014
95
117
0.38
0.46
18.5
19.6
23.5
27.6
N/A
N/A
N/A
37.0
7.8
8.5
0.9
1.1
2013
96
130
0.41
0.43
18.9
19.9
24.4
27.9
N/A
N/A
N/A
35.3
8.5
8.4
1.0
0.9
2012
98
157
0.44
0.44
18.3
21.2
24.4
28.1
N/A
N/A
N/A
41.9
9.2
8.8
1.6
1.3
2011
107
203
0.43
0.47
20.7
20.0
23.6
28.3
N/A
N/A
N/A
41.3
10.3
9.6
2.4
0.9
2010
112
100
0.43
0.48
19.4
19.9
24.7
26.9
N/A
N/A
N/A
31.2
10.0
8.3
2.3
0.9
2009
104
108
0.43
0.52
21.5
20.1
20.7
25.6
N/A
N/A
N/A
38.2
10.2
N/A
3.1
1.8
2008
109
106
0.47
0.48
22.6
21.4
21.3
26.6
0.013
N/A
N/A
39.6
11.8
N/A
4.1
2.4
2007
121
129
0.53
0.54
23.5
23.5
20.8
25.2
0.016
N/A
N/A
47.6
12.4
N/A
4.8
2.4
2006
116
131
0.61
0.66
24.2
25.3
20.7
24.4
0.018
N/A
N/A
50.8
13.0
N/A
5.7
2.3
2005
107
109
0.74
0.74
26.1
25.9
19.6
22.2
N/A
N/A
N/A
44.6
N/A
N/A
7.5
2.5
2004
106
98
0.74
0.77
25.8
25.5
18.5
23.4
0.030
N/A
N/A
32.8
N/A
N/A
7.1
1.4
2003
107
101
0.81
0.90
27.4
26.8
18.4
23.7
0.021
N/A
26.9
42.6
N/A
N/A
7.4
1.4
2002
122
111
0.76
0.98
27.9
28.7
19.9
23.6
0.008
N/A
26.2
41.8
N/A
N/A
6.5
1.6
2001
121
106
0.80
1.00
29.5
28.6
22.3
22.3
0.020
N/A
27.3
37.8
N/A
N/A
7.8
1.5
2000
115
117
0.92
1.14
29.8
29.9
20.3
24.6
0.022
N/A
22.2
45.6
N/A
N/A
7.4
1.7
Natural disasters
Type
Brooklyn
Phoenix
Tornado activity compared to U.S. average
56.4%
18.3%
Earthquake activity compared to U.S. average
30.8%
2,597.6%
Natural disasters compared to U.S. average
17%
16%
Transportation
Brooklyn benefits from the extensive public transit system of New York City, providing easy access to Manhattan and other boroughs. Phoenix is much more car-centric, with less public transportation options but generally less congested roadways.
Transport
Type
Brooklyn
Phoenix
Amtrak stations
0
3
Amtrak stations nearby
3
3
FAA registered aircraft
149
1
FAA registered aircraft manufacturers and dealers
2
15
Means of transportation to work
Type
Brooklyn
Phoenix
Bicycle
0.5%
0.4%
Bus
10.4%
1.8%
Carpooled
8%
12.2%
Car alone
22.4%
81.8%
Motorcycle
0%
0.4%
Railroad
1.4%
0.2%
Streetcar
0.2%
0%
Subway
44.8%
0%
Taxicab
0.7%
0.1%
Walked
8.8%
1.4%
Average travel time to work
Type
Brooklyn
Phoenix
Average
44.5 min
28.6 min
Real Estate
The Brooklyn real estate market is significantly pricier than Phoenix, with higher home and rent prices. Brooklyn offers more historic and pre-war buildings, while Phoenix has more modern, spacious, and newer homes.
Neighborhoods
Brooklyn is known for its diverse neighborhoods, each with unique cultures and vibes. Phoenix also has a variety of neighborhoods, but spread over a larger geographic area, each offering different lifestyles and housing options.
Houses and residents
Type
Brooklyn
Phoenix
Houses
930,866
644,625
Average household size (people)
2.7
2.8
Houses occupied
880,727 (94.6%)
602,039 (93.4%)
Houses occupied by owners
238,290 (27.1%)
354,237 (58.8%)
Houses occupied by renters
642,437 (72.9%)
247,802 (41.2%)
Median rent asked for vacant for-rent units
$1,589
$1,605
Median price asked for vacant for-sale houses and condos
$1,621,117
$375,817
Estimated median house or condo value
$793,300
$352,600
Median number of rooms in apartments
3.6
4
Median number of rooms in houses and condos
5.2
6.1
Renting percentage
72.3%
42.4%
Housing density (houses/condos per square mile)
13,184
1,357.5
Household income disparities
48.5%
43.9%
Housing units without a mortgage
29,251 (32.9%)
3,634 (1.5%)
Housing units with both a second mortgage and home equity loan
183 (0.2%)
12,949 (5.2%)
Housing units with a mortgage
59,793 (67.1%)
246,434 (98.5%)
Housing units with a home equity loan
4,512 (5.1%)
624 (0.2%)
Housing units with a second mortgage
5,098 (5.7%)
16,890 (6.8%)
Housing units lacking complete kitchen facilities
1.5%
1.2%
Housing units lacking complete plumbing facilities
Self-employed workers in own not incorporated business
45,971
48,122
State government workers
27,527
30,385
Unpaid family workers
2,234
1,048
Industries and Occupations
Brooklyn is known for its finance, healthcare, and creative industries with occupations spread across these sectors. Phoenix is home to a diverse number of sectors including finance, education, technology, and healthcare.
Being part of New York City's metropolitan area, Brooklyn offers well-developed infrastructure. It does, however, face challenges of older buildings and public transit systems. Phoenix has a newer infrastructure, with less congestion but also sprawling, requiring more reliance on personal vehicles.
Infrastructure
Type
Brooklyn
Phoenix
Hospitals
104
48
TV stations
29
22
Bank branches located here
271
263
Bank institutions located here
41
41
Main business address for public companies
9
41
Drinking water stations with no reported violations in the past
12
2
Drinking water stations with reported violations in the past
75
80
Schools
School facilities
Type
Brooklyn
Phoenix
Private elementary/middle schools
151
31
Private high schools
128
16
Public elementary/middle schools
405
0
Public high schools
176
0
Colleges/Universities
48
49
Culture and Food
Brooklyn is known for its rich, diverse culture and food scene, with offerings from all over the world. Phoenix also has a diverse food scene with a strong influence of Mexican cuisine, and a growing arts and culture scene.
Sports Teams
Brooklyn is home to the Brooklyn Nets (NBA) and the New York Islanders (NHL). Phoenix is home to the Phoenix Suns (NBA), Arizona Cardinals (NFL), and the Arizona Diamondbacks (MLB).


 Brooklyn, NY
 Phoenix, AZ