When deciding to relocate or visit a new city, many factors come into play. This comparison between Charlotte, North Carolina, and Akron, Ohio covers diverse areas such as crime rate, cost of living, economic opportunities, healthcare, and more. Both cities have distinctive traits that make them appealing for different reasons. Charlotte is a rapidly growing city with a thriving economy, while Akron is a smaller city known for its prominent role in the rubber industry.
Distance between
Charlotte, NC and
Akron, OH : 407.0 miles
Charlotte's population is larger by 365%. Its population has grown by 338,881 people (62.7%) since 2000. The population of Akron has decreased by 27,727 people (12.8%) during that time.
In terms of safety, both cities face challenges. Charlotte's crime rate is higher than the national average but its crime rate is decreasing over time. On the other hand, Akron's crime rate is also above the national average and experiencing an upward trend. However, crime rates can vary significantly within a city, depending on the neighborhood. It's advisable to research specific neighborhoods when considering a relocation or visit.
Cost of Living
Typically, the cost of living in Akron tends to be lower than in Charlotte. Housing is particularly more affordable in Akron as compared to Charlotte. However, Charlotte offers higher salaries compensating for the higher cost of housing. Overall, both cities provide a decent quality of life, but your personal finances and job prospects may dictate which is more affordable for you.
Income Tax
Both North Carolina and Ohio have state income tax. Ohio's rates range from 1.98% to 4.797%, depending on income, while North Carolina has a flat rate of 5.25%.
Property Tax
Property tax rates are generally higher in Akron than in Charlotte. In Akron, the average property tax rate is about 2.22%, while in Charlotte, it's about 1.31%.
Sales Tax
North Carolina has a state sales tax rate of 4.75%, and Charlotte tacks on an additional 2.5%, for a total sales tax of 7.25%. Ohio's state sales tax is slightly higher, at 5.75%, but Akron's additional rate is lower, at 2.25%, for a combined total of 8%.
Income
Type
Charlotte
Akron
Estimated median household income
$70,869
$41,628
Estimated per capita income
$44,593
$25,307
Cost of living index (U.S. average is 100)
93.2
95.7
If you make $50,000 in Charlotte, you will have to make $51,341 in Akron to maintain the same standard of living.
Geographical Conditions
Charlotte, located in the Piedmont region, is characterized by gentle rolling hills. Akron is located in the Great Lakes region, which means it's prone to lake effect snow in the winter. Both cities have their own distinct natural beauty.
Charlotte boasts one of the top public school systems in North Carolina, and it's home to several universities and colleges, including the University of North Carolina at Charlotte. Akron, on the other hand, is home to The University of Akron known for its strong programs in Engineering and Business. Education options in both cities are relatively strong, with various opportunities for higher education.
Charlotte has a robust economy with a strong banking sector. It's the second-largest banking center in the U.S. after New York City. Alternately, Akron's economy has historically been centered around manufacturing, particularly rubber and tire production. However, it's been transitioning to a more diversified economy with growth in healthcare, education, and manufacturing.
Biggest Employers
In Charlotte, some of the biggest employers include Bank of America, Wells Fargo, and the Carolinas Healthcare System. In Akron, the major employers are Goodyear Tire & Rubber Company, Summa Health System, and the University of Akron.
In Charlotte (Mecklenburg County), 60.8% voted for Democrats and 38.3% for Republicans in 2012 Presidential Election. In Akron (Summit County), 57.3% voted for Democrats and 41.6% for Republicans.
Elections
Type
Democrats
Republicans
Other
Year
Charlotte
Akron
Charlotte
Akron
Charlotte
Akron
2020
66.8%
53.9%
31.6%
44.4%
1.6%
1.7%
2016
62.3%
51.7%
32.9%
43.2%
4.8%
5.1%
2012
60.8%
57.3%
38.3%
41.6%
0.9%
1.1%
2008
62.0%
57.9%
37.6%
40.8%
0.5%
1.3%
2004
51.7%
56.9%
48.0%
43.1%
0.3%
0.0%
2000
48.4%
53.4%
51.1%
43.1%
0.5%
3.5%
1996
48.6%
52.1%
45.9%
34.2%
5.5%
13.8%
Breakdown of population affiliated with a religious congregation
Type
Adherents
Congregations
Religion
Charlotte
Akron
Charlotte
Akron
SOUTHERN BAPTIST CONVENTION
9.0%
0.3%
19.0%
3.3%
CATHOLIC CHURCH
8.5%
21.6%
1.8%
6.8%
AMERICAN BAPTIST CHURCHES IN THE USA
2.3%
0.4%
1.1%
1.6%
EPISCOPAL CHURCH
1.2%
0.9%
1.3%
2.1%
EVANGELICAL LUTHERAN CHURCH IN AMERICA
0.9%
0.9%
1.8%
2.9%
PRESBYTERIAN CHURCH IN AMERICA
0.6%
0.1%
1.9%
0.6%
SEVENTH DAY ADVENTIST CHURCH
0.5%
0.2%
1.5%
1.0%
LUTHERAN CHURCH
0.3%
0.9%
0.9%
2.5%
MUSLIM ESTIMATE
0.3%
0.3%
1.2%
0.4%
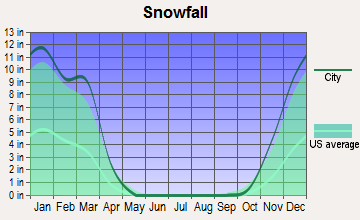
Weather
Weather is very different in these two cities. Charlotte enjoys a temperate climate, with hot summers and mild winters, making it a preferred destination for those who enjoy warmer weather. Akron, however, experiences more severe winter weather due to being in the Great Lakes region. Summers are mild and comfortable, but winters often come with large amounts of snow.
Weather and climate
Type
Charlotte
Akron
Temperature - Average
61°F
49.2°F
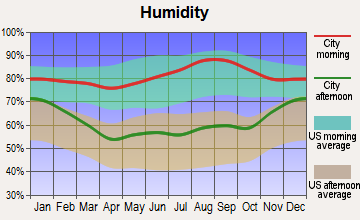
Humidity - Average morning or afternoon humidity
72.3%
76.7%
Humidity - Differences between morning and afternoon humidity
41%
32.8%
Humidity - Maximum monthly morning or afternoon humidity
87%
86.9%
Humidity - Minimum monthly morning or afternoon humidity
46%
54.1%
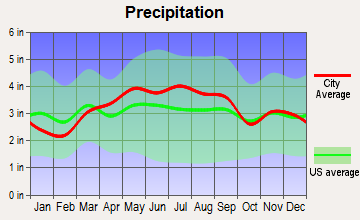
Precipitation - Yearly average
44.5 in
38.8 in
Snowfall - Yearly average
10.2 in
96.2 in
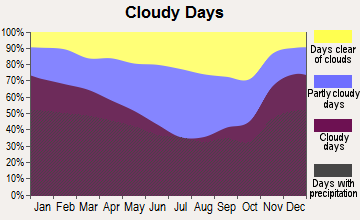
Clouds - Number of days clear of clouds
18.1%
11.2%
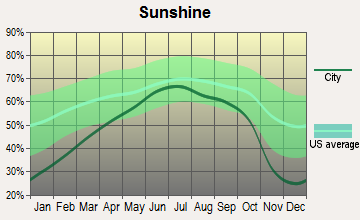
Sunshine amount - Average
69.8%
51.6%
Sunshine amount - Differences during a year
14%
43.6%
Sunshine amount - Maximum monthly
70%
65.7%
Sunshine amount - Minimum monthly
56%
22.1%
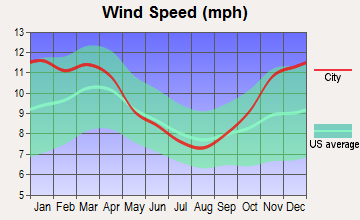
Wind speed - Average
6.9 mph
9.9 mph
Average climate in Charlotte, North Carolina
Average climate in Akron, Ohio
Air pollution
Type
AQI
CO
NO2
OZONE
PB
PM10
PM25
SO2
Year
Charlotte
Akron
Charlotte
Akron
Charlotte
Charlotte
Akron
Charlotte
Charlotte
Akron
Charlotte
Akron
Charlotte
Akron
2018
75
78
0.24
0.18
6.3
N/A
27.8
29.5
N/A
N/A
15.5
N/A
8.2
9.0
0.2
0.1
2017
77
76
0.25
0.06
7.0
N/A
28.0
31.0
N/A
N/A
16.3
N/A
8.8
8.5
0.2
0.1
2016
82
80
0.25
0.10
7.6
N/A
28.7
27.1
N/A
N/A
N/A
N/A
8.4
10.3
0.2
0.3
2015
76
92
0.25
0.12
8.1
N/A
27.6
27.8
N/A
N/A
N/A
N/A
8.6
13.9
0.2
1.0
2014
76
59
0.26
0.13
8.5
N/A
26.3
26.2
N/A
N/A
N/A
N/A
9.3
7.4
0.3
2.2
2013
71
62
0.29
0.18
8.4
N/A
25.5
26.2
N/A
N/A
N/A
N/A
8.6
8.9
0.3
2.9
2012
95
90
0.28
0.13
8.7
N/A
27.3
30.4
N/A
N/A
N/A
N/A
9.7
12.9
0.3
2.7
2011
94
91
0.34
0.09
10.1
N/A
28.9
31.0
N/A
N/A
N/A
N/A
11.2
10.8
0.6
3.2
2010
97
112
0.33
0.16
11.8
N/A
28.0
32.0
N/A
N/A
N/A
N/A
11.6
15.3
1.0
2.5
2009
82
64
0.30
0.27
10.0
N/A
25.4
26.9
N/A
N/A
N/A
N/A
11.1
N/A
0.9
1.9
2008
102
71
0.32
0.31
11.2
N/A
27.6
33.6
N/A
N/A
N/A
N/A
13.0
N/A
2.1
2.8
2007
108
77
0.37
0.29
13.9
N/A
29.1
36.1
0.001
N/A
N/A
N/A
14.5
N/A
3.0
3.2
2006
107
64
0.44
0.42
13.9
N/A
27.3
30.9
0.000
N/A
N/A
N/A
14.8
N/A
3.3
4.2
2005
109
88
0.53
0.42
14.6
N/A
30.6
33.1
0.000
N/A
N/A
N/A
15.2
N/A
2.7
4.5
2004
89
74
0.53
0.41
14.6
N/A
28.9
27.1
0.001
N/A
N/A
20.4
N/A
N/A
2.8
4.7
2003
85
84
0.57
0.39
15.6
N/A
27.6
28.3
0.003
N/A
N/A
20.5
N/A
N/A
3.0
7.3
2002
103
91
0.63
0.47
15.3
N/A
32.6
32.0
0.003
N/A
N/A
20.9
N/A
N/A
2.7
8.4
2001
108
91
0.72
0.51
17.5
N/A
32.3
31.7
0.005
N/A
N/A
21.9
N/A
N/A
3.9
8.6
2000
107
78
0.79
0.59
18.0
N/A
32.6
29.7
0.014
N/A
N/A
21.5
N/A
N/A
4.4
8.0
Natural disasters
Type
Charlotte
Akron
Tornado activity compared to U.S. average
111.5%
111.2%
Earthquake activity compared to U.S. average
79%
52.3%
Natural disasters compared to U.S. average
9%
11%
Transportation
Charlotte has more robust public transportation with a light rail system and a network of buses. Commute times tend to be shorter in Akron, but public transit options are more limited. In both cities, a significant proportion of residents commute by car, but Charlotte has made strides in promoting alternative forms of transportation, such as biking and walking.
Transport
Type
Charlotte
Akron
Amtrak stations
1
1
Amtrak stations nearby
2
1
FAA registered aircraft
439
112
FAA registered aircraft manufacturers and dealers
12
10
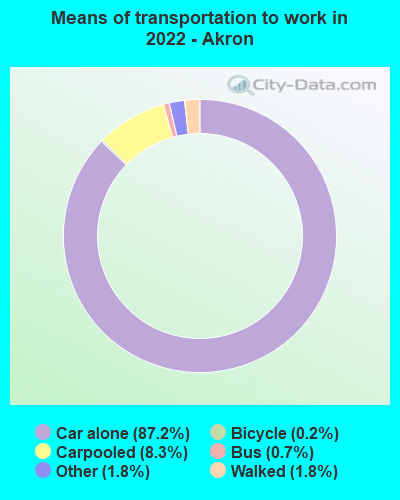
Means of transportation to work
Type
Charlotte
Akron
Bicycle
0.1%
0.2%
Bus
1.2%
1.4%
Carpooled
8.7%
7.7%
Car alone
86.2%
87.7%
Railroad
0.4%
0.2%
Taxicab
0.2%
0.2%
Walked
1.5%
1.6%
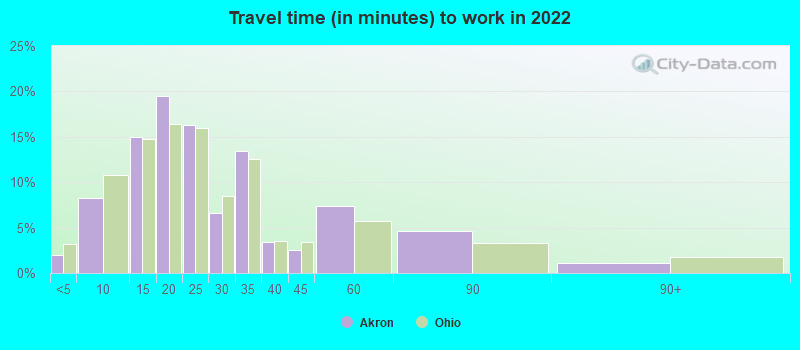
Average travel time to work
Type
Charlotte
Akron
Average
29.6 min
24.6 min
Other means
24.9 min
22 min
Public transportation
44.1 min
38 min
Private vehicle occupancy
Type
Charlotte
Akron
Average
1.2
1.2
Drove alone
90%
85.4%
In 2 person carpool
6.9%
12.4%
In 3 person carpool
1.8%
0.9%
In 4 person carpool
0.8%
0.5%
In 5-6 person carpool
0.5%
0.6%
In 7+ person carpool
0.1%
0.2%
How many people usually rode to work in the car, truck or van.
Real Estate
Real estate in Charlotte tends to be more expensive due to the city's rapid growth and the influx of newcomers. Akron, on the other hand, offers more affordable housing options, thanks in part to its slower growth. Both cities offer diverse housing options, from downtown apartments to suburban homes.
Neighborhoods
Both Charlotte and Akron offer diverse neighborhoods that range from vibrant downtown areas to quiet suburban enclaves. Charlotte's neighborhoods like Myers Park and Dilworth are known for their tree-lined streets and local amenities, while Akron's Highland Square and Wallhaven are known for their unique local businesses and strong community spirit.
Houses and residents
Type
Charlotte
Akron
Houses
393,631
93,546
Average household size (people)
2.5
2.3
Median year apartment built
1998
1960
Median year house/condo built
1993
1952
Length of stay in the house since moving in
11.8 years
15.6 years
Houses occupied
365,269 (92.8%)
84,914 (90.8%)
Houses occupied by owners
193,930 (53.1%)
42,714 (50.3%)
Houses occupied by renters
171,339 (46.9%)
42,200 (49.7%)
Median rent asked for vacant for-rent units
$1,482
$905.97
Median monthly housing costs
$1,302
$784
Median price asked for vacant for-sale houses and condos
$445,491
$81,314
Estimated median house or condo value
$321,400
$106,300
Median numbers of rooms
5.3
5.5
Median number of rooms in apartments
4
4.7
Median number of rooms in houses and condos
6.6
6.3
Median house price - detached houses
$388,029
$136,437
Median house price - in 2-unit structures
$184,325
$102,885
Median house price - in 3-to-4-unit structures
$178,624
$135,558
Median house price - in 5 or more unit structures
$433,957
$94,537
Median house price - mobile homes
$52,977
$44,110
Median house price - Townhouses or other attached units
$296,370
$181,576
Median house price - All housing units
$378,423
$137,428
Median house age
26
68
Renting percentage
42.6%
45.5%
Housing density (houses/condos per square mile)
1,624.8
1,507.1
House value disparities
33.3%
36.4%
Household income disparities
44.1%
45%
Median household income for houses/condes with a mortgage
$105,905
$71,904
Median household income for apartments without a mortgage
$70,681
$49,938
Housing units without a mortgage
3,089 (2.1%)
1,292 (4.8%)
Housing units with both a second mortgage and home equity loan
10,553 (7.2%)
2,419 (9%)
Housing units with a mortgage
142,912 (97.9%)
25,670 (95.2%)
Housing units with a home equity loan
171 (0.1%)
0 (0%)
Housing units with a second mortgage
13,532 (9.3%)
2,878 (10.7%)
House/condo owner moved in on average (years ago)
9
15
House/condo renter moved in on average (years ago)
1
3
Housing units lacking complete kitchen facilities
0.8%
3.6%
Housing units lacking complete plumbing facilities
0.2%
2.2%
Housing units in structures
Housing units in structures
Charlotte
Akron
One, detached
52.7%
67.7%
One, attached
9.1%
3.0%
Two
0.9%
6.8%
3 or 4
2.9%
4.5%
5 to 9
7.1%
4.9%
10 to 19
9.5%
3.9%
20 to 49
6.2%
2.9%
50 or more
10.3%
6.1%
Mobile homes
1.4%
0.2%
Median real estate property taxes paid for housing units
Self-employed workers in own not incorporated business
25,780
3,686
State government workers
16,519
2,025
Unpaid family workers
1,214
196
Industries and Occupations
Charlotte is a financial hub, providing ample opportunities in banking, finance, and technology. Other emerging sectors include energy, healthcare, and retail. Akron's economy, on the other hand, is more diverse, featuring strengths in manufacturing, healthcare, and education. Both cities offer job opportunities in numerous industries, catering to a wide range of skill sets.
Both cities have robust healthcare systems. Charlotte is served by two major healthcare systems, Atrium Health and Novant Health, providing top-notch medical services. Akron also has strong healthcare services provided by Cleveland Clinic Akron General and Summa Health System.
Health (county statistics)
Type
Charlotte
Akron
General health status score of residents in this county from 1 (poor) to 5 (excellent)
Akron's infrastructure benefits from its history as a manufacturing hub, with an established network of roads, rail, and public amenities. However, as a smaller city, it may lack some of the convenient infrastructure that Charlotte offers. As one of the fastest-growing cities in America, Charlotte has seen significant investment in infrastructure, including public parks, a light rail system, and an international airport.
Infrastructure
Type
Charlotte
Akron
Hospitals
37
11
TV stations
16
22
Arenas or stadiums
3
2
Bank branches located here
202
69
Bank institutions located here
26
12
Main business address for public companies
33
6
Nuclear power plants nearby
2
0
Drinking water stations with no reported violations in the past
24
15
Drinking water stations with reported violations in the past
HMDA - Conventional home purchase loans - Applications denied
Year
Charlotte
Akron
1999
3,049
674
2000
1,568
857
2001
1,382
599
2002
1,275
414
2003
1,879
644
2004
2,415
816
2005
3,078
1,353
2006
3,864
1,286
2007
3,106
734
2008
1,287
280
2009
617
85
Culture and Food
As for cultural activities and food, both cities have much to offer. Charlotte has a thriving food scene, with a particular emphasis on Southern cuisine. There is also an array of cultural institutions like art galleries, museums, and theaters. Akron, albeit smaller, has an active arts scene, well-known burger joints, and is close to the Cuyahoga Valley National Park, a popular spot for outdoor recreation.
Sports Teams
Sports fans will find plenty to cheer for in both cities. Charlotte is home to the Carolina Panthers (NFL), the Charlotte Hornets (NBA), and a host of minor league and collegiate teams. Akron doesn't have any major league teams, but proximity to Cleveland means easy access to the Cleveland Browns (NFL), Cleveland Cavaliers (NBA), and the Cleveland Indians (MLB).


 Charlotte, NC
 Akron, OH