Charlotte, North Carolina and Albuquerque, New Mexico offer distinct living experiences, both with their unique appeals. Charlotte is known for its high-powered finance sector and vibrant sports culture, while Albuquerque boasts rich cultural heritage and attractive outdoor activities. Ultimately, the choice between the two cities depends on one's lifestyle preferences, from climate and crime rates to career opportunities and cost of living.
Distance between
Charlotte, NC and
Albuquerque, NM : 1,452.1 miles
Charlotte's population is larger by 56%. Its population has grown by 338,881 people (62.7%) since 2000. The population of Albuquerque has grown by 113,992 people (25.4%) during that time.
Charlotte enjoys a lower crime rate than Albuquerque. Although Charlotte isn't among the safest cities in the US, its crime rate is significantly lower than Albuquerque's, which is higher than the national average. However, both cities have been implementing measures to combat crime and enhance safety. It's always advisable to research neighborhoods thoroughly before visiting or deciding to relocate.
Cost of Living
The cost of living is more affordable in Albuquerque than in Charlotte. The housing market in Albuquerque offers lower prices both for renters and homebuyers, and overall living expenses, including groceries, health care, and utilities are also lower. Nevertheless, Charlotte has a competitive cost of living compared to other major cities in the US.
Income Tax
North Carolina imposes a flat state income tax of 5.25%, which applies to Charlotte residents, while New Mexico has a graduated income tax rate from 1.7% to 4.9%.
Property Tax
The average effective property tax rate in Charlotte is around 1.1%, compared to Albuquerque's lower average rate of around 0.78%.
Sales Tax
The combined sales tax in Charlotte is 7.25%, lower than Albuquerque's combined rate of 7.88%. New Mexico's gross receipts tax is similar to a sales tax but is imposed on businesses.
Income
Type
Charlotte
Albuquerque
Estimated median household income
$70,869
$58,512
Estimated per capita income
$44,593
$35,738
Cost of living index (U.S. average is 100)
93.2
93.6
If you make $50,000 in Charlotte, you will have to make $50,215 in Albuquerque to maintain the same standard of living.
Geographical Conditions
Charlotte is located in the Piedmont region, known for its rolling hills and lush greenery. Albuquerque is set in the high desert, offering a beautiful backdrop of the Sandia Mountains and an abundance of outdoor activities.
Both cities provide access to quality education. In Charlotte, the public school system is robust, complemented by reputable private institutions. The city also boasts several colleges and universities, including the University of North Carolina at Charlotte. Albuquerque also has a strong education network, featuring excellent public schools and established institutions like the University of New Mexico.
Charlotte's economy centers around banking and finance, and it's the second-largest banking center in the US after New York. Other sectors include technology, healthcare, and retail. Albuquerque's economy is diverse, with a focus on healthcare, retail, education, and professional and scientific services, including the presence of institutions like Sandia National Laboratories.
Biggest Employers
Charlotte is home to several Fortune 1000 companies, including Bank of America and Duke Energy. Healthcare providers like Carolinas Healthcare System and Novant Health also offer numerous jobs. In Albuquerque, the biggest employers are the University of New Mexico, Sandia National Laboratories, and Presbyterian Health Services.
In Charlotte (Mecklenburg County), 60.8% voted for Democrats and 38.3% for Republicans in 2012 Presidential Election. In Albuquerque (Bernalillo County), 55.8% voted for Democrats and 39.4% for Republicans.
Elections
Type
Democrats
Republicans
Other
Year
Charlotte
Albuquerque
Charlotte
Albuquerque
Charlotte
Albuquerque
2020
66.8%
61.3%
31.6%
36.7%
1.6%
2.0%
2016
62.3%
52.4%
32.9%
34.6%
4.8%
13.0%
2012
60.8%
55.8%
38.3%
39.4%
0.9%
4.9%
2008
62.0%
60.2%
37.6%
38.8%
0.5%
1.0%
2004
51.7%
51.6%
48.0%
47.4%
0.3%
0.9%
2000
48.4%
48.8%
51.1%
46.8%
0.5%
4.4%
1996
48.6%
48.3%
45.9%
43.2%
5.5%
8.5%
Breakdown of population affiliated with a religious congregation
Type
Adherents
Congregations
Religion
Charlotte
Albuquerque
Charlotte
Albuquerque
SOUTHERN BAPTIST CONVENTION
9.0%
2.6%
19.0%
11.4%
CATHOLIC CHURCH
8.5%
26.5%
1.8%
10.7%
AMERICAN BAPTIST CHURCHES IN THE USA
2.3%
0.1%
1.1%
0.5%
EPISCOPAL CHURCH
1.2%
0.7%
1.3%
1.9%
EVANGELICAL LUTHERAN CHURCH IN AMERICA
0.9%
0.4%
1.8%
1.9%
PRESBYTERIAN CHURCH IN AMERICA
0.6%
0.0%
1.9%
0.5%
SEVENTH DAY ADVENTIST CHURCH
0.5%
0.4%
1.5%
1.9%
LUTHERAN CHURCH
0.3%
0.3%
0.9%
1.7%
MUSLIM ESTIMATE
0.3%
0.3%
1.2%
0.5%
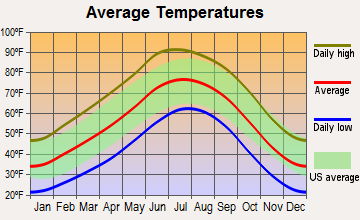
Weather
In terms of climate, Charlotte offers four distinct seasons, including a hot summer and a mild winter. On the other hand, Albuquerque experiences a semi-arid climate, featuring mild to cool winters and hot summers. Albuquerque's high altitude also means lower humidity and cool evenings, even in summertime, making it an ideal place for people who enjoy outdoor activities.
Weather and climate
Type
Charlotte
Albuquerque
Temperature - Average
61°F
55.6°F
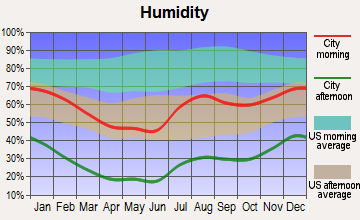
Humidity - Average morning or afternoon humidity
72.3%
44.3%
Humidity - Differences between morning and afternoon humidity
41%
46%
Humidity - Maximum monthly morning or afternoon humidity
87%
63%
Humidity - Minimum monthly morning or afternoon humidity
46%
17%
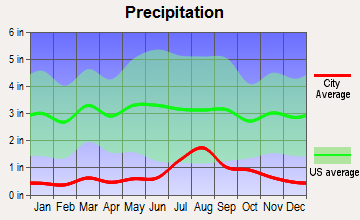
Precipitation - Yearly average
44.5 in
9.4 in
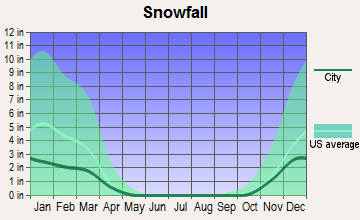
Snowfall - Yearly average
10.2 in
19.2 in
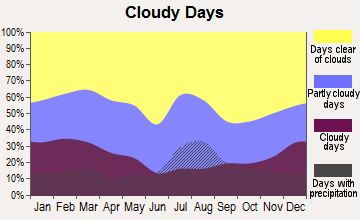
Clouds - Number of days clear of clouds
18.1%
27.8%
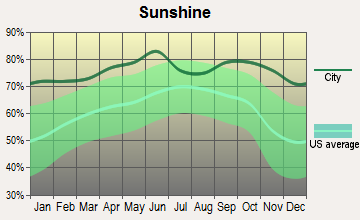
Sunshine amount - Average
69.8%
82.7%
Sunshine amount - Differences during a year
14%
9%
Sunshine amount - Maximum monthly
70%
82%
Sunshine amount - Minimum monthly
56%
73%
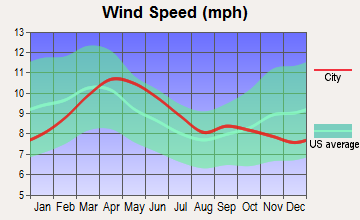
Wind speed - Average
6.9 mph
8.9 mph
Average climate in Charlotte, North Carolina
Average climate in Albuquerque, New Mexico
Air pollution
Type
AQI
CO
NO2
OZONE
PB
PM10
PM25
SO2
Year
Charlotte
Albuquerque
Charlotte
Albuquerque
Charlotte
Albuquerque
Charlotte
Albuquerque
Charlotte
Albuquerque
Charlotte
Albuquerque
Charlotte
Albuquerque
Charlotte
Albuquerque
2018
75
95
0.24
0.23
6.3
10.3
27.8
35.3
N/A
N/A
15.5
20.3
8.2
4.3
0.2
0.5
2017
77
82
0.25
0.24
7.0
10.4
28.0
33.5
N/A
N/A
16.3
18.4
8.8
5.7
0.2
0.4
2016
82
86
0.25
0.22
7.6
10.4
28.7
33.2
N/A
N/A
N/A
16.0
8.4
5.3
0.2
0.8
2015
76
84
0.25
0.23
8.1
11.2
27.6
30.8
N/A
N/A
N/A
16.0
8.6
6.1
0.2
0.7
2014
76
89
0.26
0.22
8.5
11.7
26.3
31.8
N/A
N/A
N/A
22.0
9.3
6.1
0.3
0.6
2013
71
91
0.29
0.22
8.4
11.8
25.5
34.1
N/A
N/A
N/A
21.8
8.6
5.7
0.3
0.8
2012
95
116
0.28
0.18
8.7
13.7
27.3
33.6
N/A
N/A
N/A
26.6
9.7
9.3
0.3
0.7
2011
94
130
0.34
0.21
10.1
13.5
28.9
34.0
N/A
N/A
N/A
28.6
11.2
9.9
0.6
0.4
2010
97
92
0.33
0.15
11.8
12.2
28.0
32.1
N/A
N/A
N/A
25.1
11.6
6.8
1.0
N/A
2009
82
81
0.30
0.16
10.0
12.5
25.4
30.4
N/A
N/A
N/A
26.2
11.1
6.9
0.9
N/A
2008
102
91
0.32
0.21
11.2
11.8
27.6
31.5
N/A
N/A
N/A
20.8
13.0
6.5
2.1
N/A
2007
108
112
0.37
0.29
13.9
13.0
29.1
31.4
0.001
N/A
N/A
19.7
14.5
6.7
3.0
N/A
2006
107
103
0.44
0.33
13.9
14.2
27.3
31.8
0.000
N/A
N/A
21.1
14.8
N/A
3.3
N/A
2005
109
85
0.53
0.32
14.6
13.9
30.6
29.7
0.000
N/A
N/A
20.0
15.2
N/A
2.7
N/A
2004
89
89
0.53
0.32
14.6
16.6
28.9
29.8
0.001
0.003
N/A
21.5
N/A
N/A
2.8
N/A
2003
85
115
0.57
0.37
15.6
17.6
27.6
31.9
0.003
0.004
N/A
25.1
N/A
N/A
3.0
N/A
2002
103
91
0.63
0.43
15.3
18.9
32.6
29.1
0.003
0.005
N/A
23.1
N/A
N/A
2.7
N/A
2001
108
81
0.72
0.67
17.5
17.2
32.3
29.4
0.005
N/A
N/A
20.9
N/A
N/A
3.9
N/A
2000
107
95
0.79
0.81
18.0
17.0
32.6
27.9
0.014
N/A
N/A
17.7
N/A
N/A
4.4
N/A
Natural disasters
Type
Charlotte
Albuquerque
Tornado activity compared to U.S. average
111.5%
6.4%
Earthquake activity compared to U.S. average
79%
802.6%
Natural disasters compared to U.S. average
9%
9%
Transportation
Both cities provide efficient public transit options. In Charlotte, the Charlotte Area Transit System (CATS) offers bus and light rail services. Albuquerque's public transit includes buses and a commuter rail line, the New Mexico Rail Runner Express.
Transport
Type
Charlotte
Albuquerque
Amtrak stations
1
1
Amtrak stations nearby
2
1
FAA registered aircraft
439
1
FAA registered aircraft manufacturers and dealers
12
17
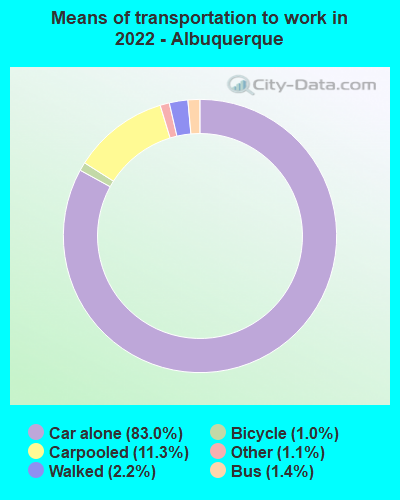
Means of transportation to work
Type
Charlotte
Albuquerque
Bicycle
0.1%
0.9%
Bus
1.2%
0.8%
Carpooled
8.7%
9.6%
Car alone
86.2%
85.1%
Motorcycle
0.1%
0.2%
Railroad
0.4%
0%
Taxicab
0.2%
0%
Walked
1.5%
2.3%
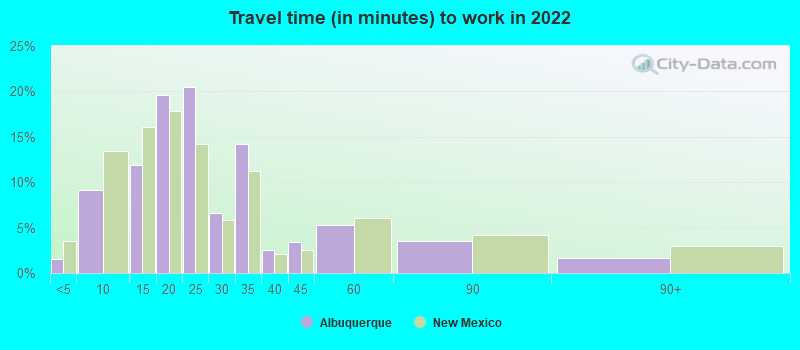
Average travel time to work
Type
Charlotte
Albuquerque
Average
29.6 min
24.5 min
Other means
24.9 min
20.8 min
Public transportation
44.1 min
37.8 min
Private vehicle occupancy
Type
Charlotte
Albuquerque
Average
1.2
1.1
Drove alone
90%
91.6%
In 2 person carpool
6.9%
6.6%
In 3 person carpool
1.8%
1.2%
In 4 person carpool
0.8%
0.3%
In 5-6 person carpool
0.5%
0.1%
In 7+ person carpool
0.1%
0.2%
How many people usually rode to work in the car, truck or van.
Real Estate
Charlotte's real estate market is competitive, with a mix of affordable and luxury properties. However, due to the city's growth, prices have been increasing. Albuquerque's real estate market is more affordable, and it provides a wide range of options from historic adobe homes to modern townhouses.
Neighborhoods
Both cities offer diverse neighborhoods catering to different lifestyles. In Charlotte, Myers Park and Dilworth are known for their historic charm, while NoDa and South End cater to the younger crowd. Albuquerque offers historic neighborhoods like Old Town and Nob Hill, while the North Valley and Northeast Heights are desirable for their family-friendly environments.
Houses and residents
Type
Charlotte
Albuquerque
Houses
393,631
256,814
Average household size (people)
2.5
2.4
Median year apartment built
1998
1983
Median year house/condo built
1993
1984
Length of stay in the house since moving in
11.8 years
12.6 years
Houses occupied
365,269 (92.8%)
243,582 (94.8%)
Houses occupied by owners
193,930 (53.1%)
147,964 (60.7%)
Houses occupied by renters
171,339 (46.9%)
95,618 (39.3%)
Median rent asked for vacant for-rent units
$1,482
$893.82
Median monthly housing costs
$1,302
$1,021
Median price asked for vacant for-sale houses and condos
$445,491
$171,149
Estimated median house or condo value
$321,400
$251,500
Median numbers of rooms
5.3
5.3
Median number of rooms in apartments
4
3.9
Median number of rooms in houses and condos
6.6
6.2
Median house price - detached houses
$388,029
$290,578
Median house price - in 2-unit structures
$184,325
$636,758
Median house price - in 3-to-4-unit structures
$178,624
$274,794
Median house price - in 5 or more unit structures
$433,957
$224,872
Median house price - mobile homes
$52,977
$52,392
Median house price - Townhouses or other attached units
$296,370
$209,825
Median house price - All housing units
$378,423
$271,083
Median house age
26
38
Renting percentage
42.6%
39.7%
Housing density (houses/condos per square mile)
1,624.8
1,421.7
House value disparities
33.3%
29.8%
Household income disparities
44.1%
45.9%
Median household income for houses/condes with a mortgage
$105,905
$87,851
Median household income for apartments without a mortgage
$70,681
$63,195
Housing units without a mortgage
3,089 (2.1%)
1,631 (1.6%)
Housing units with both a second mortgage and home equity loan
10,553 (7.2%)
3,560 (3.6%)
Housing units with a mortgage
142,912 (97.9%)
97,744 (98.4%)
Housing units with a home equity loan
171 (0.1%)
309 (0.3%)
Housing units with a second mortgage
13,532 (9.3%)
6,864 (6.9%)
House/condo owner moved in on average (years ago)
9
11
House/condo renter moved in on average (years ago)
1
1
Housing units lacking complete kitchen facilities
0.8%
1.1%
Housing units lacking complete plumbing facilities
0.2%
0.3%
Housing units in structures
Housing units in structures
Charlotte
Albuquerque
One, detached
52.7%
61.4%
One, attached
9.1%
6.6%
Two
0.9%
1.0%
3 or 4
2.9%
6.1%
5 to 9
7.1%
4.7%
10 to 19
9.5%
4.7%
20 to 49
6.2%
4.8%
50 or more
10.3%
6.3%
Mobile homes
1.4%
4.2%
Median real estate property taxes paid for housing units
Self-employed workers in own not incorporated business
25,780
14,060
State government workers
16,519
20,531
Unpaid family workers
1,214
359
Industries and Occupations
In Charlotte, the finance sector plays a significant role, providing many job opportunities. Other key sectors include technology and healthcare. Albuquerque's leading industries include healthcare, education, retail trade, and scientific and technical services.
Both cities have excellent healthcare facilities. Charlotte boasts leading healthcare providers like the Carolinas Healthcare System and Novant Health. Albuquerque offers reputable services from providers like Presbyterian Health Services and the University of New Mexico Hospital.
Health (county statistics)
Type
Charlotte
Albuquerque
General health status score of residents in this county from 1 (poor) to 5 (excellent)
Charlotte boasts an impressive modern infrastructure, with an international airport, interstates, and mass transit options. Albuquerque, on the other hand, is geared more toward outdoor living. However, it also has good infrastructure, including an international airport and an efficient public transit system.
Infrastructure
Type
Charlotte
Albuquerque
Hospitals
37
36
TV stations
16
18
Arenas or stadiums
3
1
Bank branches located here
202
137
Bank institutions located here
26
24
Main business address for public companies
33
8
Nuclear power plants nearby
2
0
Drinking water stations with no reported violations in the past
24
7
Drinking water stations with reported violations in the past
HMDA - Conventional home purchase loans - Applications denied
Year
Charlotte
Albuquerque
1999
3,049
2,651
2000
1,568
1,303
2001
1,382
752
2002
1,275
693
2003
1,879
1,022
2004
2,415
1,729
2005
3,078
2,199
2006
3,864
2,639
2007
3,106
1,575
2008
1,287
654
2009
617
368
Culture and Food
Charlotte has a rich cultural scene with museums, music venues, and performing arts centers. The food scene is diverse, influenced by a southern culinary tradition. Meanwhile, Albuquerque is known for its thriving arts scene and distinct New Mexican cuisine, characterized by the use of Hatch chiles.
Sports Teams
Charlotte is home to the NFL's Carolina Panthers and the NBA's Charlotte Hornets, making it a favorite among sports fans. Albuquerque doesn't host any major league sports teams, but it has the AAA baseball team Albuquerque Isotopes and New Mexico United in the USL Championship league.


 Charlotte, NC
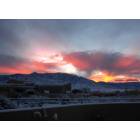
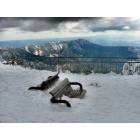
 Albuquerque, NM