Charlotte, North Carolina and Des Moines, Iowa, two diverse American cities, offer various opportunities and experiences for both residents and visitors alike. Charlotte is known for being a leading financial hub and sports center, while Des Moines is renowned for its insurance sector and agricultural industry. Although Charlotte has a higher cost of living, it offers more job opportunities and warmer weather. In contrast, Des Moines offers a more affordable lifestyle with a slower pace. This comparison will delve into the unique characteristics of each place, focusing on factors that may influence decisions of relocation or visitation.
Distance between
Charlotte, NC and
Des Moines, IA : 819.8 miles
Charlotte's population is larger by 315%. Its population has grown by 338,881 people (62.7%) since 2000. The population of Des Moines has grown by 13,349 people (6.7%) during that time.
Charlotte has a higher crime rate compared to Des Moines, making safety a concern for potential residents and visitors. Although Charlotte's police department is taking steps to enhance safety, potential movers might want to consider neighborhoods with lower crime rates. Des Moines, on the other hand, has a lower crime rate, making it relatively safer for residents and tourists alike.
Cost of Living
The cost of living in Des Moines is significantly lower than in Charlotte. The cheaper housing, groceries, and healthcare in Des Moines make it more affordable, especially for families and retirees. On the other hand, while living in Charlotte is moderately expensive, it offers a higher average salary to compensate.
Income Tax
There are differences in income tax as well. North Carolina has a flat rate, while Iowa operates on a progressive income tax system.
Property Tax
Property tax in both states is typically close to the national average, with slight variations depending on the location within the state and the exact value of the property.
Sales Tax
In terms of sales tax, North Carolina's combined state and local sales tax rate is somewhat higher than in Iowa.
Income
Type
Charlotte
Des Moines
Estimated median household income
$70,869
$60,693
Estimated per capita income
$44,593
$33,498
Cost of living index (U.S. average is 100)
93.2
89.7
If you make $50,000 in Des Moines, you will have to make $51,951 in Charlotte to maintain the same standard of living.
Geographical Conditions
Charlotte is located in the Piedmont region, enjoying proximity to both mountains and the coast. Conversely, Des Moines is located in the heart of the Midwest, characterized by flat terrains and fertile farmland.
There is a significant focus on education in both cities. Charlotte offers numerous public and private schools, including top-rated magnet schools. Des Moines also offers a strong public school system and boasts several universities, including Drake University.
Charlotte is home to numerous Fortune 500 companies, including Bank of America, making it a hub for banking and finance. Des Moines, on the other hand, is recognized as a global insurance center with numerous insurance companies. Therefore, job opportunities greatly skew towards these sectors in each city respectively.
Biggest Employers
Charlotte's biggest employers are in the finance sector, with Bank of America and Wells Fargo leading the pack. Meanwhile, Des Moines' economy is heavily centred around insurance, with companies like Principal Financial Group and Nationwide having a significant presence.
In Charlotte (Mecklenburg County), 60.8% voted for Democrats and 38.3% for Republicans in 2012 Presidential Election. In Des Moines (Polk County), 56.4% voted for Democrats and 42.2% for Republicans.
Elections
Type
Democrats
Republicans
Other
Year
Charlotte
Des Moines
Charlotte
Des Moines
Charlotte
Des Moines
2020
66.8%
56.9%
31.6%
41.5%
1.6%
1.6%
2016
62.3%
51.9%
32.9%
40.5%
4.8%
7.7%
2012
60.8%
56.4%
38.3%
42.2%
0.9%
1.4%
2008
62.0%
56.5%
37.6%
41.9%
0.5%
1.6%
2004
51.7%
52.1%
48.0%
47.4%
0.3%
0.5%
2000
48.4%
51.9%
51.1%
46.2%
0.5%
1.9%
1996
48.6%
78.5%
45.9%
18.2%
5.5%
3.4%
Breakdown of population affiliated with a religious congregation
Type
Adherents
Congregations
Religion
Charlotte
Des Moines
Charlotte
Des Moines
SOUTHERN BAPTIST CONVENTION
9.0%
1.1%
19.0%
3.2%
CATHOLIC CHURCH
8.5%
14.6%
1.8%
4.7%
AMERICAN BAPTIST CHURCHES IN THE USA
2.3%
0.3%
1.1%
2.0%
EPISCOPAL CHURCH
1.2%
0.5%
1.3%
1.5%
EVANGELICAL LUTHERAN CHURCH IN AMERICA
0.9%
3.8%
1.8%
4.2%
PRESBYTERIAN CHURCH IN AMERICA
0.6%
0.0%
1.9%
0.2%
SEVENTH DAY ADVENTIST CHURCH
0.5%
0.3%
1.5%
1.2%
LUTHERAN CHURCH
0.3%
1.8%
0.9%
3.7%
MUSLIM ESTIMATE
0.3%
0.4%
1.2%
1.0%
REFORMED CHURCH IN AMERICA
0.0%
0.8%
0.0%
1.0%
Weather
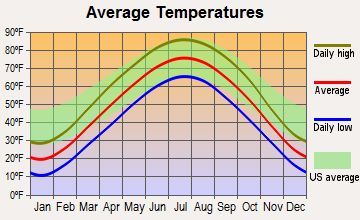
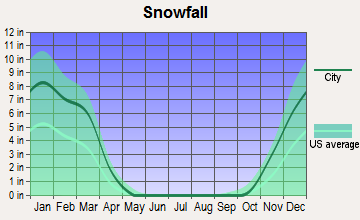
When it comes to weather, both cities offer four distinct seasons. However, Charlotte tends to have milder winters and longer, hotter summers. In contrast, Des Moines experiences colder winters, which can be a major consideration for those who prefer milder weather.
Weather and climate
Type
Charlotte
Des Moines
Temperature - Average
61°F
49.6°F
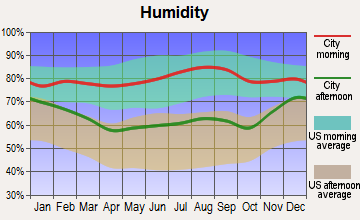
Humidity - Average morning or afternoon humidity
72.3%
76.2%
Humidity - Differences between morning and afternoon humidity
41%
32%
Humidity - Maximum monthly morning or afternoon humidity
87%
86%
Humidity - Minimum monthly morning or afternoon humidity
46%
54%
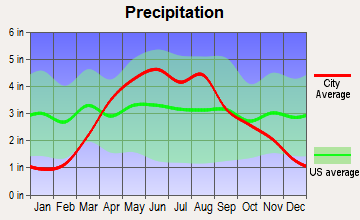
Precipitation - Yearly average
44.5 in
34.5 in
Snowfall - Yearly average
10.2 in
68.6 in
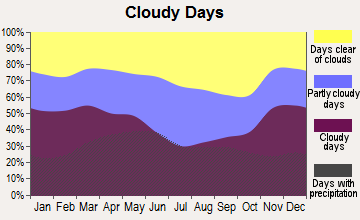
Clouds - Number of days clear of clouds
18.1%
17.5%
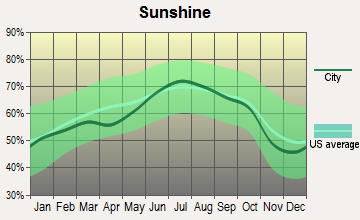
Sunshine amount - Average
69.8%
63.3%
Sunshine amount - Differences during a year
14%
31%
Sunshine amount - Maximum monthly
70%
74%
Sunshine amount - Minimum monthly
56%
43%
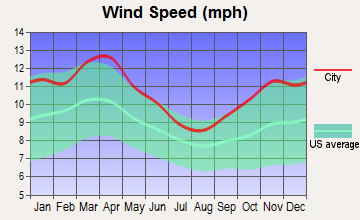
Wind speed - Average
6.9 mph
10.6 mph
Average climate in Charlotte, North Carolina
Average climate in Des Moines, Iowa
Air pollution
Type
AQI
CO
NO2
OZONE
PB
PM10
PM25
SO2
Year
Charlotte
Des Moines
Charlotte
Des Moines
Charlotte
Des Moines
Charlotte
Des Moines
Charlotte
Charlotte
Charlotte
Des Moines
Charlotte
Des Moines
2018
75
67
0.24
0.21
6.3
6.8
27.8
27.6
N/A
N/A
15.5
N/A
8.2
7.1
0.2
0.0
2017
77
76
0.25
0.21
7.0
6.4
28.0
28.2
N/A
N/A
16.3
N/A
8.8
7.5
0.2
0.1
2016
82
69
0.25
0.21
7.6
6.2
28.7
30.3
N/A
N/A
N/A
N/A
8.4
7.6
0.2
0.0
2015
76
68
0.25
0.21
8.1
6.4
27.6
30.4
N/A
N/A
N/A
N/A
8.6
7.2
0.2
0.1
2014
76
71
0.26
0.21
8.5
6.5
26.3
28.6
N/A
N/A
N/A
N/A
9.3
7.1
0.3
0.0
2013
71
69
0.29
0.21
8.4
7.0
25.5
31.0
N/A
N/A
N/A
N/A
8.6
9.1
0.3
0.0
2012
95
77
0.28
0.22
8.7
8.1
27.3
32.9
N/A
N/A
N/A
N/A
9.7
9.0
0.3
0.1
2011
94
76
0.34
0.21
10.1
8.0
28.9
28.9
N/A
N/A
N/A
N/A
11.2
9.2
0.6
0.1
2010
97
74
0.33
0.29
11.8
9.3
28.0
27.0
N/A
N/A
N/A
N/A
11.6
10.1
1.0
0.3
2009
82
70
0.30
0.28
10.0
9.0
25.4
25.0
N/A
N/A
N/A
N/A
11.1
9.9
0.9
0.3
2008
102
79
0.32
0.31
11.2
9.1
27.6
26.7
N/A
N/A
N/A
N/A
13.0
10.5
2.1
0.3
2007
108
72
0.37
0.34
13.9
8.9
29.1
30.2
0.001
N/A
N/A
N/A
14.5
N/A
3.0
0.3
2006
107
50
0.44
0.36
13.9
9.9
27.3
27.1
0.000
N/A
N/A
N/A
14.8
N/A
3.3
N/A
2005
109
66
0.53
0.48
14.6
10.7
30.6
29.4
0.000
N/A
N/A
N/A
15.2
N/A
2.7
N/A
2004
89
42
0.53
0.79
14.6
11.1
28.9
24.1
0.001
N/A
N/A
N/A
N/A
N/A
2.8
N/A
2003
85
47
0.57
0.83
15.6
12.3
27.6
19.7
0.003
N/A
N/A
N/A
N/A
N/A
3.0
N/A
2002
103
51
0.63
0.80
15.3
12.0
32.6
23.9
0.003
N/A
N/A
N/A
N/A
N/A
2.7
N/A
2001
108
52
0.72
0.82
17.5
12.4
32.3
25.3
0.005
N/A
N/A
N/A
N/A
N/A
3.9
N/A
2000
107
68
0.79
0.77
18.0
N/A
32.6
24.3
0.014
N/A
N/A
N/A
N/A
N/A
4.4
N/A
Natural disasters
Type
Charlotte
Des Moines
Tornado activity compared to U.S. average
111.5%
205.8%
Earthquake activity compared to U.S. average
79%
317.2%
Natural disasters compared to U.S. average
9%
17%
Transportation
Both cities have strong public transportation networks. Charlotte has an efficient light rail system, bus system, and biking routes while Des Moines offers an extensive bus network and growing bike-sharing program.
Transport
Type
Charlotte
Des Moines
Amtrak stations
1
0
Amtrak stations nearby
2
0
FAA registered aircraft
439
142
FAA registered aircraft manufacturers and dealers
12
8
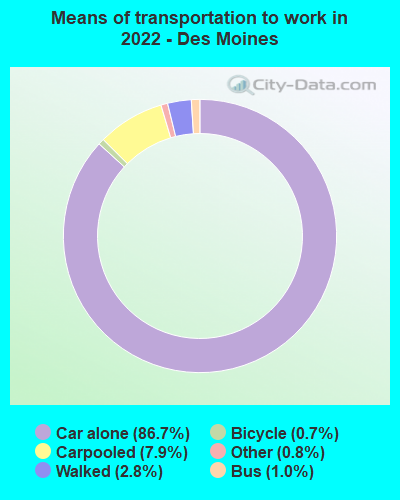
Means of transportation to work
Type
Charlotte
Des Moines
Bicycle
0.1%
0.8%
Bus
1.2%
0.9%
Carpooled
8.7%
9.7%
Car alone
86.2%
84.9%
Railroad
0.4%
0%
Taxicab
0.2%
0.1%
Walked
1.5%
1.8%
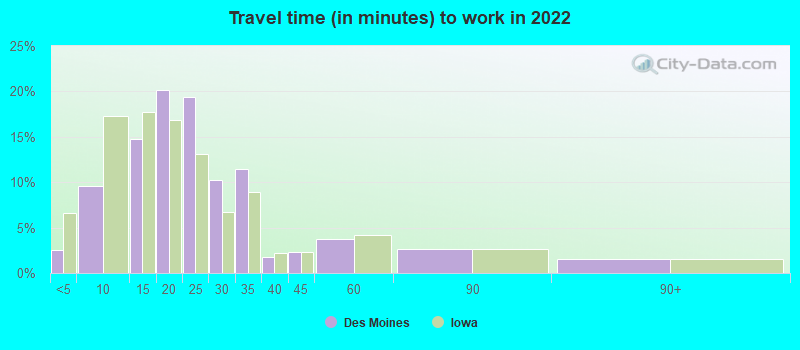
Average travel time to work
Type
Charlotte
Des Moines
Average
29.6 min
23.5 min
Other means
24.9 min
18.7 min
Public transportation
44.1 min
29.5 min
Private vehicle occupancy
Type
Charlotte
Des Moines
Average
1.2
1.2
Drove alone
90%
86.6%
In 2 person carpool
6.9%
9.9%
In 3 person carpool
1.8%
2.7%
In 4 person carpool
0.8%
0.5%
In 5-6 person carpool
0.5%
0.1%
In 7+ person carpool
0.1%
0.1%
How many people usually rode to work in the car, truck or van.
Real Estate
Real estate in Charlotte tends to be more expensive than in Des Moines due to its growth and popularity. However, both cities offer a range of housing options, from downtown apartments to suburban family homes.
Neighborhoods
Charlotte’s neighborhoods, such as Myers Park and Dilworth, offer a variety of amenities and have distinct characters. Meanwhile, Des Moines offers neighborhoods like Beaverdale and Sherman Hill, known for their strong sense of community and unique charm.
Houses and residents
Type
Charlotte
Des Moines
Houses
393,631
97,957
Average household size (people)
2.5
2.4
Median year apartment built
1998
1973
Median year house/condo built
1993
1955
Length of stay in the house since moving in
11.8 years
11.9 years
Houses occupied
365,269 (92.8%)
90,416 (92.3%)
Houses occupied by owners
193,930 (53.1%)
57,606 (63.7%)
Houses occupied by renters
171,339 (46.9%)
32,810 (36.3%)
Median rent asked for vacant for-rent units
$1,482
$1,302
Median monthly housing costs
$1,302
$1,020
Median price asked for vacant for-sale houses and condos
$445,491
$248,725
Estimated median house or condo value
$321,400
$165,100
Median numbers of rooms
5.3
5.2
Median number of rooms in apartments
4
3.8
Median number of rooms in houses and condos
6.6
6.1
Median house price - detached houses
$388,029
$179,065
Median house price - in 2-unit structures
$184,325
$116,964
Median house price - in 3-to-4-unit structures
$178,624
$235,107
Median house price - in 5 or more unit structures
$433,957
$284,995
Median house price - mobile homes
$52,977
$21,893
Median house price - Townhouses or other attached units
$296,370
$192,190
Median house price - All housing units
$378,423
$180,640
Median house age
26
62
Renting percentage
42.6%
37.2%
Housing density (houses/condos per square mile)
1,624.8
1,292.4
House value disparities
33.3%
31.7%
Household income disparities
44.1%
41.3%
Median household income for houses/condes with a mortgage
$105,905
$83,033
Median household income for apartments without a mortgage
$70,681
$57,585
Housing units without a mortgage
3,089 (2.1%)
649 (1.6%)
Housing units with both a second mortgage and home equity loan
10,553 (7.2%)
2,590 (6.5%)
Housing units with a mortgage
142,912 (97.9%)
39,110 (98.4%)
Housing units with a home equity loan
171 (0.1%)
414 (1%)
Housing units with a second mortgage
13,532 (9.3%)
3,409 (8.6%)
House/condo owner moved in on average (years ago)
9
10
House/condo renter moved in on average (years ago)
1
1
Housing units lacking complete kitchen facilities
0.8%
1.5%
Housing units lacking complete plumbing facilities
0.2%
1%
Housing units in structures
Housing units in structures
Charlotte
Des Moines
One, detached
52.7%
64.4%
One, attached
9.1%
3.7%
Two
0.9%
3.6%
3 or 4
2.9%
2.3%
5 to 9
7.1%
2.9%
10 to 19
9.5%
3.8%
20 to 49
6.2%
7.8%
50 or more
10.3%
9.0%
Mobile homes
1.4%
1.7%
Boats, RVs, vans, etc.
0.0%
0.6%
Median real estate property taxes paid for housing units
Self-employed workers in own not incorporated business
25,780
4,833
State government workers
16,519
3,844
Unpaid family workers
1,214
222
Industries and Occupations
In both cities, the leading industries correlate with their largest employers. In Charlotte, the banking, healthcare, and motorsports sectors dominate, while in Des Moines, the leading industries are insurance, finance, and agriculture.
For healthcare, both cities offer excellent medical facilities. Charlotte has renowned hospitals like the Atrium Health and Levine Children's Hospital. Des Moines has top-rated hospitals like UnityPoint Health and MercyOne.
Health (county statistics)
Type
Charlotte
Des Moines
General health status score of residents in this county from 1 (poor) to 5 (excellent)
In terms of infrastructure, both cities have invested in improving their downtown areas and public transit. Charlotte has an efficient light rail system, while Des Moines has an extensive bus network and bike-sharing program.
Infrastructure
Type
Charlotte
Des Moines
Hospitals
37
12
TV stations
16
14
Arenas or stadiums
3
2
Bank branches located here
202
61
Bank institutions located here
26
19
Main business address for public companies
33
7
Nuclear power plants nearby
2
0
Drinking water stations with no reported violations in the past
24
2
Drinking water stations with reported violations in the past
HMDA - Conventional home purchase loans - Applications denied
Year
Charlotte
Des Moines
1999
3,049
791
2000
1,568
658
2001
1,382
629
2002
1,275
665
2003
1,879
573
2004
2,415
725
2005
3,078
892
2006
3,864
895
2007
3,106
671
2008
1,287
284
2009
617
158
Culture and Food
Charlotte offers a mix of Southern and cosmopolitan cultures. The city's thriving culinary scene ranges from traditional Southern fare to globally influenced cuisine. Des Moines offers a variety of cultural experiences, too, especially the influences of its agricultural roots reflected in its farm-to-table dining scene.
Sports Teams
For sports enthusiasts, both cities have a lot to offer. Charlotte is home to key sports teams like the Carolina Panthers and Charlotte Hornets. Des Moines, while not hosting any major league teams, hosts minor league teams and is popular for college sports.


 Charlotte, NC
 Des Moines, IA