Charlotte, North Carolina, and Fort Wayne, Indiana, are two uniquely different cities, each with its own charm and appeal. For those looking to relocate and tourists alike, understanding the aspects of life such as safety, weather, cost of living, education, economy, and more will help in choosing between the two. This detailed comparison will give you insights into what to expect in either city and assist you in your decision-making process.
Distance between
Charlotte, NC and
Fort Wayne, IN : 467.9 miles
Charlotte's population is larger by 231%. Its population has grown by 338,881 people (62.7%) since 2000. The population of Fort Wayne has grown by 60,247 people (29.3%) during that time.
Relative to North Carolina's size, crime in Charlotte is slightly above average. It isn't the safest, but concerted efforts by the local government ensure that safety is prioritized. Fort Wayne's crime rates are moderately low but have seen recent increases. Regardless, both cities have areas that are safer than others, and getting local information before moving is advisable.
Cost of Living
The cost of living in Charlotte is slightly above the national average, with housing being a primary factor. On the other hand, Fort Wayne's cost of living is significantly lower, making it a more affordable choice overall. Groceries, housing, and utilities are particularly cheaper in Fort Wayne compared to Charlotte.
Income Tax
North Carolina has a flat income tax rate of 5.25%. Indiana has a state income tax rate of 3.23%, with an additional county tax rate which varies but can be up to 3.38% in Fort Wayne.
Property Tax
Charlotte has a slightly higher property tax rate than Fort Wayne, but this largely depends on the assessed value of the home. Fort Wayne, while having a lower rate, can present higher total costs for larger properties due to Indiana's tax cap rules.
Sales Tax
North Carolina has a state sales tax of 4.75% and Charlotte adds an additional 2.25%, making it a total of 7%. Indiana's state sales tax is 7%, with no additional city sales tax in Fort Wayne.
Income
Type
Charlotte
Fort Wayne
Estimated median household income
$70,869
$54,737
Estimated per capita income
$44,593
$29,282
Cost of living index (U.S. average is 100)
93.2
82.8
If you make $50,000 in Fort Wayne, you will have to make $56,280 in Charlotte to maintain the same standard of living.
Geographical Conditions
Charlotte is in the Piedmont region near the Appalachian Mountains and has numerous green spaces and a man-made lake. Fort Wayne, located in northeastern Indiana, has a more flat topography with several rivers running through the city.
Both cities boast good education systems. Charlotte has numerous public and private schools and is home to the University of North Carolina at Charlotte. Conversely, Fort Wayne has a significant number of public, private, and parochial schools and houses Indiana University-Purdue University Fort Wayne.
Charlotte's economy is robust, with a focus on the banking and finance sector, as it's the second largest banking center in the U.S after New York City. In contrast, Fort Wayne has a diversified economy with manufacturing, health care, and retail among the top sectors providing employment.
Biggest Employers
The biggest employers in Charlotte are Atrium Health and Wells Fargo. On the other hand, in Fort Wayne, the largest employers include Parkview Health System and Lutheran Health Network.
In Charlotte (Mecklenburg County), 60.8% voted for Democrats and 38.3% for Republicans in 2012 Presidential Election. In Fort Wayne (Allen County), 40.9% voted for Democrats and 57.6% for Republicans.
Elections
Type
Democrats
Republicans
Other
Year
Charlotte
Fort Wayne
Charlotte
Fort Wayne
Charlotte
Fort Wayne
2020
66.8%
43.3%
31.6%
54.5%
1.6%
2.2%
2016
62.3%
37.3%
32.9%
56.6%
4.8%
6.1%
2012
60.8%
40.9%
38.3%
57.6%
0.9%
1.5%
2008
62.0%
47.5%
37.6%
51.8%
0.5%
0.7%
2004
51.7%
36.1%
48.0%
63.4%
0.3%
0.6%
2000
48.4%
36.4%
51.1%
61.6%
0.5%
2.0%
1996
48.6%
37.8%
45.9%
54.1%
5.5%
8.0%
Breakdown of population affiliated with a religious congregation
Type
Adherents
Congregations
Religion
Charlotte
Fort Wayne
Charlotte
Fort Wayne
SOUTHERN BAPTIST CONVENTION
9.0%
1.2%
19.0%
3.8%
CATHOLIC CHURCH
8.5%
16.0%
1.8%
5.6%
AMERICAN BAPTIST CHURCHES IN THE USA
2.3%
1.1%
1.1%
2.0%
EPISCOPAL CHURCH
1.2%
0.2%
1.3%
0.8%
EVANGELICAL LUTHERAN CHURCH IN AMERICA
0.9%
2.3%
1.8%
3.5%
PRESBYTERIAN CHURCH IN AMERICA
0.6%
0.0%
1.9%
0.3%
SEVENTH DAY ADVENTIST CHURCH
0.5%
0.2%
1.5%
0.8%
LUTHERAN CHURCH
0.3%
6.8%
0.9%
8.9%
MUSLIM ESTIMATE
0.3%
0.3%
1.2%
0.5%
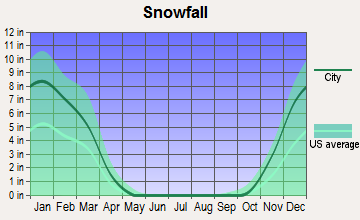
Weather
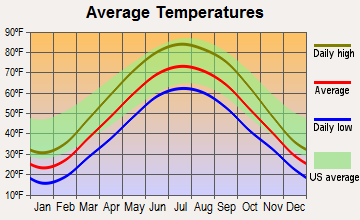
Charlotte has a humid subtropical climate with hot, humid summers and mild winters. In contrast, in Fort Wayne, you'll experience all four seasons, including a white winter. Winter can be particularly harsh for those not used to colder climates, making Charlotte's milder winters more appealing for some.
Weather and climate
Type
Charlotte
Fort Wayne
Temperature - Average
61°F
49.9°F
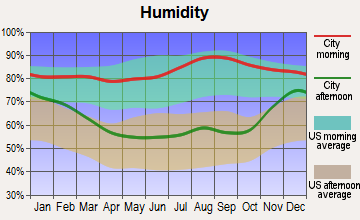
Humidity - Average morning or afternoon humidity
72.3%
77.5%
Humidity - Differences between morning and afternoon humidity
41%
33%
Humidity - Maximum monthly morning or afternoon humidity
87%
87%
Humidity - Minimum monthly morning or afternoon humidity
46%
54%
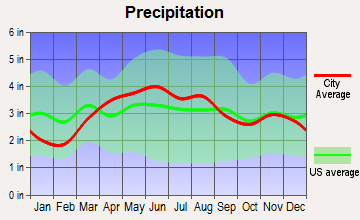
Precipitation - Yearly average
44.5 in
36.5 in
Snowfall - Yearly average
10.2 in
64.8 in
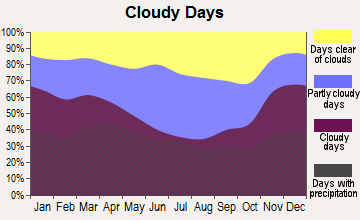
Clouds - Number of days clear of clouds
18.1%
13.1%
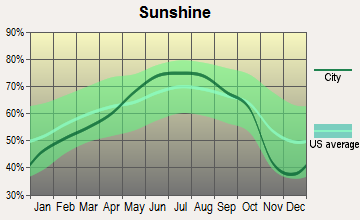
Sunshine amount - Average
69.8%
65.2%
Sunshine amount - Differences during a year
14%
40%
Sunshine amount - Maximum monthly
70%
76%
Sunshine amount - Minimum monthly
56%
36%
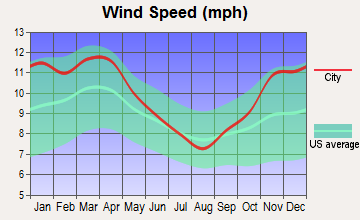
Wind speed - Average
6.9 mph
9.9 mph
Average climate in Charlotte, North Carolina
Average climate in Fort Wayne, Indiana
Air pollution
Type
AQI
CO
NO2
OZONE
PB
PM10
PM25
SO2
Year
Charlotte
Fort Wayne
Charlotte
Fort Wayne
Charlotte
Charlotte
Fort Wayne
Charlotte
Charlotte
Charlotte
Fort Wayne
Charlotte
2018
75
74
0.24
N/A
6.3
N/A
27.8
27.2
N/A
N/A
15.5
N/A
8.2
8.8
0.2
N/A
2017
77
68
0.25
N/A
7.0
N/A
28.0
28.3
N/A
N/A
16.3
N/A
8.8
8.2
0.2
N/A
2016
82
78
0.25
N/A
7.6
N/A
28.7
N/A
N/A
N/A
N/A
N/A
8.4
8.8
0.2
N/A
2015
76
85
0.25
N/A
8.1
N/A
27.6
N/A
N/A
N/A
N/A
N/A
8.6
10.8
0.2
N/A
2014
76
93
0.26
N/A
8.5
N/A
26.3
N/A
N/A
N/A
N/A
N/A
9.3
13.1
0.3
N/A
2013
71
74
0.29
0.45
8.4
N/A
25.5
N/A
N/A
N/A
N/A
N/A
8.6
9.9
0.3
N/A
2012
95
91
0.28
0.64
8.7
N/A
27.3
N/A
N/A
N/A
N/A
N/A
9.7
13.9
0.3
N/A
2011
94
87
0.34
0.37
10.1
N/A
28.9
N/A
N/A
N/A
N/A
N/A
11.2
12.2
0.6
N/A
2010
97
98
0.33
0.34
11.8
N/A
28.0
N/A
N/A
N/A
N/A
N/A
11.6
15.8
1.0
N/A
2009
82
96
0.30
0.62
10.0
N/A
25.4
N/A
N/A
N/A
N/A
N/A
11.1
16.5
0.9
N/A
2008
102
96
0.32
0.79
11.2
N/A
27.6
N/A
N/A
N/A
N/A
N/A
13.0
15.7
2.1
N/A
2007
108
103
0.37
0.47
13.9
N/A
29.1
N/A
0.001
N/A
N/A
N/A
14.5
13.4
3.0
N/A
2006
107
81
0.44
0.61
13.9
N/A
27.3
N/A
0.000
N/A
N/A
N/A
14.8
11.8
3.3
N/A
2005
109
107
0.53
0.67
14.6
N/A
30.6
N/A
0.000
N/A
N/A
N/A
15.2
14.4
2.7
N/A
2004
89
75
0.53
0.85
14.6
N/A
28.9
N/A
0.001
N/A
N/A
N/A
N/A
N/A
2.8
N/A
2003
85
101
0.57
0.70
15.6
N/A
27.6
N/A
0.003
N/A
N/A
N/A
N/A
12.2
3.0
N/A
2002
103
101
0.63
0.71
15.3
N/A
32.6
N/A
0.003
N/A
N/A
N/A
N/A
13.2
2.7
N/A
2001
108
65
0.72
0.65
17.5
N/A
32.3
N/A
0.005
N/A
N/A
N/A
N/A
N/A
3.9
N/A
2000
107
73
0.79
0.83
18.0
N/A
32.6
N/A
0.014
N/A
N/A
N/A
N/A
N/A
4.4
N/A
Natural disasters
Type
Charlotte
Fort Wayne
Tornado activity compared to U.S. average
111.5%
174.8%
Earthquake activity compared to U.S. average
79%
101.2%
Natural disasters compared to U.S. average
9%
14%
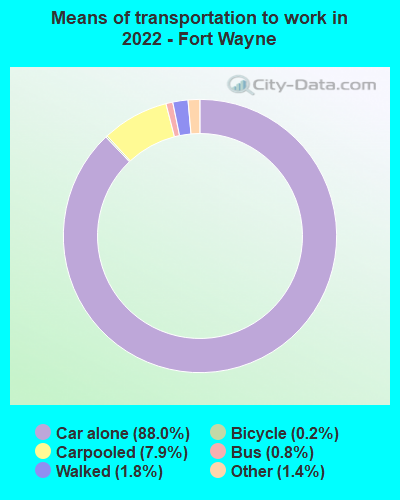
Transportation
Both Charlotte and Fort Wayne offer a variety of transit options. Charlotte has a more extensive subway system and various bus routes. Fort Wayne, while having reliable bus service, leans more toward personal vehicles for commuting.
Transport
Type
Charlotte
Fort Wayne
Amtrak stations
1
0
Amtrak stations nearby
2
0
FAA registered aircraft
439
209
FAA registered aircraft manufacturers and dealers
12
1
Means of transportation to work
Type
Charlotte
Fort Wayne
Bicycle
0.1%
0.4%
Bus
1.2%
0.4%
Carpooled
8.7%
7.4%
Car alone
86.2%
89.6%
Railroad
0.4%
0%
Taxicab
0.2%
0%
Walked
1.5%
1.4%
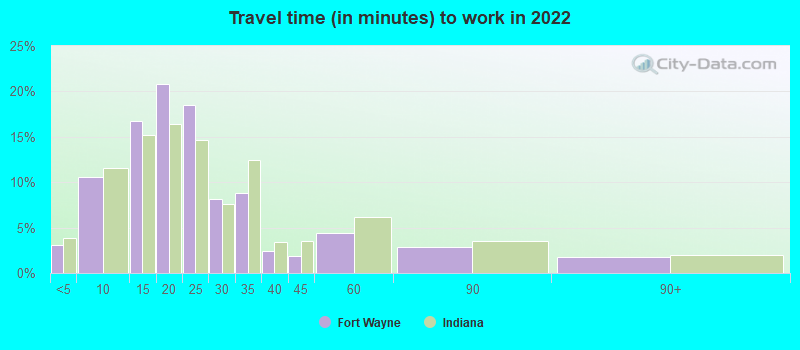
Average travel time to work
Type
Charlotte
Fort Wayne
Average
29.6 min
23.9 min
Other means
24.9 min
20.5 min
Public transportation
44.1 min
38.1 min
Private vehicle occupancy
Type
Charlotte
Fort Wayne
Average
1.2
1.1
Drove alone
90%
91.1%
In 2 person carpool
6.9%
7.4%
In 3 person carpool
1.8%
0.4%
In 4 person carpool
0.8%
0.3%
In 5-6 person carpool
0.5%
0.6%
In 7+ person carpool
0.1%
0.2%
How many people usually rode to work in the car, truck or van.
Real Estate
Charlotte’s real estate market is thriving, but house prices can be relatively high compared to national averages. Fort Wayne offers a more affordable housing market, making it attractive for those looking for lower property prices.
Neighborhoods
Charlotte has various neighborhoods, each with its unique ambiance, including the bustling Uptown and the artsy NoDa. Fort Wayne boasts historical neighborhoods like West Central and quaint areas like Northside.
Houses and residents
Type
Charlotte
Fort Wayne
Houses
393,631
117,245
Average household size (people)
2.5
2.4
Median year apartment built
1998
1976
Median year house/condo built
1993
1972
Length of stay in the house since moving in
11.8 years
12.2 years
Houses occupied
365,269 (92.8%)
109,640 (93.5%)
Houses occupied by owners
193,930 (53.1%)
68,004 (62%)
Houses occupied by renters
171,339 (46.9%)
41,636 (38%)
Median rent asked for vacant for-rent units
$1,482
$729.05
Median monthly housing costs
$1,302
$844
Median price asked for vacant for-sale houses and condos
$445,491
$135,711
Estimated median house or condo value
$321,400
$155,600
Median numbers of rooms
5.3
5.9
Median number of rooms in apartments
4
4.2
Median number of rooms in houses and condos
6.6
6.8
Median house price - detached houses
$388,029
$167,457
Median house price - in 2-unit structures
$184,325
$66,481
Median house price - in 3-to-4-unit structures
$178,624
$136,033
Median house price - in 5 or more unit structures
$433,957
$154,215
Median house price - mobile homes
$52,977
$54,382
Median house price - Townhouses or other attached units
$296,370
$138,742
Median house price - All housing units
$378,423
$164,476
Median house age
26
48
Renting percentage
42.6%
36.7%
Housing density (houses/condos per square mile)
1,624.8
1,485
House value disparities
33.3%
31.9%
Household income disparities
44.1%
42.5%
Median household income for houses/condes with a mortgage
$105,905
$72,350
Median household income for apartments without a mortgage
$70,681
$59,128
Housing units without a mortgage
3,089 (2.1%)
811 (1.8%)
Housing units with both a second mortgage and home equity loan
10,553 (7.2%)
3,282 (7.3%)
Housing units with a mortgage
142,912 (97.9%)
43,922 (98.2%)
Housing units with a home equity loan
171 (0.1%)
0 (0%)
Housing units with a second mortgage
13,532 (9.3%)
3,996 (8.9%)
House/condo owner moved in on average (years ago)
9
10
House/condo renter moved in on average (years ago)
1
1
Housing units lacking complete kitchen facilities
0.8%
1%
Housing units lacking complete plumbing facilities
0.2%
0.5%
Housing units in structures
Housing units in structures
Charlotte
Fort Wayne
One, detached
52.7%
69.2%
One, attached
9.1%
2.6%
Two
0.9%
2.4%
3 or 4
2.9%
5.3%
5 to 9
7.1%
6.3%
10 to 19
9.5%
5.6%
20 to 49
6.2%
2.8%
50 or more
10.3%
3.7%
Mobile homes
1.4%
2.1%
Median real estate property taxes paid for housing units
Self-employed workers in own not incorporated business
25,780
6,040
State government workers
16,519
2,352
Unpaid family workers
1,214
430
Industries and Occupations
Charlotte is renowned for its financial sector, with Bank of America and Wells Fargo among the biggest employers. It also has notable energy, technology, and health care sectors. Fort Wayne's economy is more diversified, with top employers in health care, manufacturing, insurance, and retail.
Both cities offer excellent health care services. Charlotte has the Atrium Health Carolinas Medical Center, which is nationally ranked in several specialties, while Fort Wayne is served by the top-rated Parkview regional medical center.
Health (county statistics)
Type
Charlotte
Fort Wayne
General health status score of residents in this county from 1 (poor) to 5 (excellent)
Charlotte boasts excellent infrastructure, including a robust industry-supported transportation system and burgeoning tech landscape. Conversely, Fort Wayne, while smaller, is a modern city with dependable infrastructure and a growing emphasis on technology and sustainability.
Infrastructure
Type
Charlotte
Fort Wayne
Hospitals
37
21
TV stations
16
11
Arenas or stadiums
3
1
Bank branches located here
202
93
Bank institutions located here
26
20
Main business address for public companies
33
3
Nuclear power plants nearby
2
0
Drinking water stations with no reported violations in the past
24
1
Drinking water stations with reported violations in the past
HMDA - Conventional home purchase loans - Applications denied
Year
Charlotte
Fort Wayne
1999
3,049
1,000
2000
1,568
865
2001
1,382
592
2002
1,275
355
2003
1,879
476
2004
2,415
748
2005
3,078
940
2006
3,864
1,055
2007
3,106
614
2008
1,287
234
2009
617
113
Culture and Food
Charlotte offers a vibrant cultural scene with concerts, theatres, and a thriving culinary sector known for its southern cuisine. Fort Wayne has a laid-back and budding arts scene with food choices representing American and international cuisines.
Sports Teams
Sports enthusiasts will love Charlotte, home to the Carolina Panthers (NFL) and Charlotte Hornets (NBA). Fort Wayne, though smaller, hosts minor league sports teams and has a rich local sports culture.


 Charlotte, NC
 Fort Wayne, IN