Comparing two diverse cities like Charlotte, NC, and Fresno, CA, offers a comprehensive look into various aspects of city life such as climate, cost of living, education, etc. While Charlotte is known for its strong banking sector, lower cost of living, and diverse sports culture, Fresno stands out with its rich agricultural industry, unique cultural blend, and proximity to some of California's stunning natural attractions. Both cities provide their unique set of opportunities and lifestyle choices, and the choice between the two will depend on personal preference and lifestyle.
Distance between
Charlotte, NC and
Fresno, CA : 2,165.6 miles
Charlotte's population is larger by 62%. Its population has grown by 338,881 people (62.7%) since 2000. The population of Fresno has grown by 116,858 people (27.3%) during that time.
Like any large city, both Charlotte and Fresno have areas with higher crime rates than the national average, but they also have neighborhoods that are extremely safe. Fresno's crime rate is slightly higher than Charlotte’s, and it's ranked safer than just 7% of US cities. On the other hand, Charlotte is ranked safer than 15% of US cities. Safety measures and community initiatives constantly work towards amplifying public safety in both cities.
Cost of Living
In general, Charlotte has a lower cost of living compared to Fresno. Although housing costs in both cities are slightly above the national average, you'll find that your dollar stretches further in Charlotte. Everyday amenities like food, healthcare, and utilities also tend to be cheaper in Charlotte than in Fresno.
Income Tax
North Carolina has a flat state income tax rate of 5.25%, regardless of income level, while California operates on a progressive income tax system, with rates ranging from 1% to 13.3%. For many, this could mean higher income taxes in Fresno compared to Charlotte.
Property Tax
Mecklenburg County, has a property tax rate of 0.8237 per $100 of assessed value making property taxes in Charlotte higher than the national average. Fresno County has a property tax rate of around 0.68% which is lower in comparison to Charlotte but still higher than the national average.
Sales Tax
North Carolina's state sales tax is 4.75%, and Mecklenburg County, where Charlotte is located, adds a 2% sales tax for a combined 6.75% rate. California has a state sales tax of 7.25%, which is increased by Fresno's local tax rate, taking the total sales tax to 7.98%.
Income
Type
Charlotte
Fresno
Estimated median household income
$70,869
$61,250
Estimated per capita income
$44,593
$28,499
Cost of living index (U.S. average is 100)
93.2
96.3
If you make $50,000 in Charlotte, you will have to make $51,663 in Fresno to maintain the same standard of living.
Geographical Conditions
Charlotte is located near the Catawba River and Lake Norman, the largest man-made lake in North Carolina, providing plenty of water activities. Fresno enjoys a unique geographical location, with proximity to eminent nature reserves like Yosemite National Park and Sierra National Forest.
Both Charlotte and Fresno have a good mix of public and private schools, although Charlotte's public school district is larger. Charlotte is also home to several renowned universities including the University of North Carolina at Charlotte. Fresno also has strong higher education institutions, like California State University, Fresno, known for its research and agriculture programs.
Charlotte is the second-largest banking center in the US, behind New York, with banks like Bank of America and Wells Fargo having a major presence. Other sectors such as healthcare, energy, and technology are also robust. Fresno's economy is diverse, grounded in agriculture, healthcare, and education with a growing technology and logistics sector.
Biggest Employers
In Charlotte, Atrium Health, Wells Fargo, and Bank of America are among the biggest employers. In Fresco, notable employers include Community Medical Centers, Saint Agnes Medical Center, and the City of Fresno.
In Charlotte (Mecklenburg County), 60.8% voted for Democrats and 38.3% for Republicans in 2012 Presidential Election. In Fresno (Fresno County), 49.8% voted for Democrats and 48.0% for Republicans.
Elections
Type
Democrats
Republicans
Other
Year
Charlotte
Fresno
Charlotte
Fresno
Charlotte
Fresno
2020
66.8%
53.0%
31.6%
45.2%
1.6%
1.8%
2016
62.3%
49.2%
32.9%
43.2%
4.8%
7.5%
2012
60.8%
49.8%
38.3%
48.0%
0.9%
2.2%
2008
62.0%
50.2%
37.6%
48.1%
0.5%
1.8%
2004
51.7%
42.0%
48.0%
57.8%
0.3%
0.3%
2000
48.4%
43.2%
51.1%
53.3%
0.5%
3.5%
1996
48.6%
45.3%
45.9%
47.4%
5.5%
7.3%
Breakdown of population affiliated with a religious congregation
Type
Adherents
Congregations
Religion
Charlotte
Fresno
Charlotte
Fresno
SOUTHERN BAPTIST CONVENTION
9.0%
1.6%
19.0%
8.1%
CATHOLIC CHURCH
8.5%
31.0%
1.8%
6.1%
AMERICAN BAPTIST CHURCHES IN THE USA
2.3%
0.6%
1.1%
2.4%
EPISCOPAL CHURCH
1.2%
0.0%
1.3%
0.1%
EVANGELICAL LUTHERAN CHURCH IN AMERICA
0.9%
0.5%
1.8%
2.0%
PRESBYTERIAN CHURCH IN AMERICA
0.6%
0.0%
1.9%
0.1%
SEVENTH DAY ADVENTIST CHURCH
0.5%
0.7%
1.5%
2.6%
MUSLIM ESTIMATE
0.3%
0.3%
1.2%
0.6%
Weather
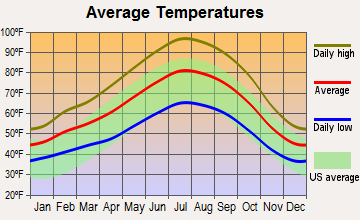
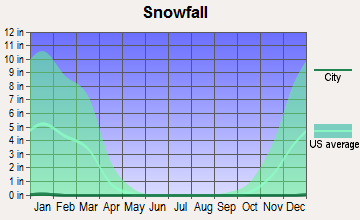
Fresno, located in California's Central Valley, has a hot and dry climate with scorching summers that can often reach above 100°F. Winters are mild and short, with very little rain. In contrast, Charlotte experiences all four seasons. Summers are hot and humid while winters are usually mild with occasional snowfall. Spring and autumn are beautiful, with vibrant colors making a scenic cityscape.
Weather and climate
Type
Charlotte
Fresno
Temperature - Average
61°F
63°F
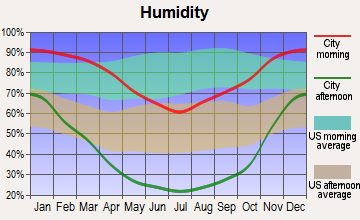
Humidity - Average morning or afternoon humidity
72.3%
60.9%
Humidity - Differences between morning and afternoon humidity
41%
67%
Humidity - Maximum monthly morning or afternoon humidity
87%
88%
Humidity - Minimum monthly morning or afternoon humidity
46%
21%
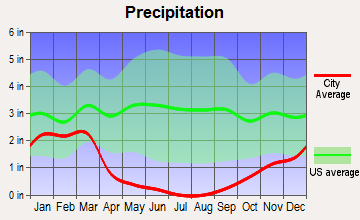
Precipitation - Yearly average
44.5 in
11.6 in
Snowfall - Yearly average
10.2 in
0 in
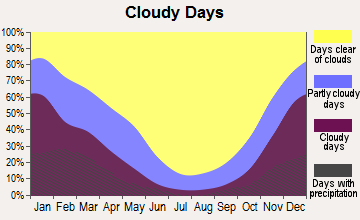
Clouds - Number of days clear of clouds
18.1%
32.4%
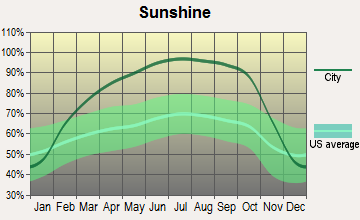
Sunshine amount - Average
69.8%
82.8%
Sunshine amount - Differences during a year
14%
52%
Sunshine amount - Maximum monthly
70%
96%
Sunshine amount - Minimum monthly
56%
44%
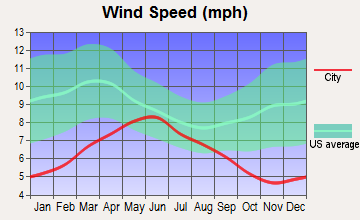
Wind speed - Average
6.9 mph
6.5 mph
Average climate in Charlotte, North Carolina
Average climate in Fresno, California
Air pollution
Type
AQI
CO
NO2
OZONE
PB
PM10
PM25
SO2
Year
Charlotte
Fresno
Charlotte
Fresno
Charlotte
Fresno
Charlotte
Fresno
Charlotte
Fresno
Charlotte
Fresno
Charlotte
Fresno
Charlotte
Fresno
2018
75
128
0.24
0.35
6.3
9.7
27.8
31.7
N/A
N/A
15.5
39.7
8.2
14.8
0.2
0.6
2017
77
132
0.25
0.35
7.0
9.2
28.0
33.2
N/A
N/A
16.3
38.3
8.8
14.3
0.2
0.6
2016
82
128
0.25
0.35
7.6
8.4
28.7
31.4
N/A
N/A
N/A
34.7
8.4
13.5
0.2
0.5
2015
76
134
0.25
0.32
8.1
8.7
27.6
31.1
N/A
N/A
N/A
34.2
8.6
13.9
0.2
0.5
2014
76
139
0.26
0.33
8.5
10.1
26.3
32.4
N/A
0.004
N/A
39.3
9.3
16.4
0.3
0.5
2013
71
136
0.29
0.37
8.4
11.1
25.5
31.0
N/A
0.005
N/A
43.3
8.6
19.1
0.3
0.6
2012
95
140
0.28
0.36
8.7
9.7
27.3
31.9
N/A
0.004
N/A
36.1
9.7
14.2
0.3
0.6
2011
94
139
0.34
0.34
10.1
8.7
28.9
33.5
N/A
N/A
N/A
30.2
11.2
21.1
0.6
0.8
2010
97
121
0.33
0.27
11.8
6.9
28.0
31.1
N/A
N/A
N/A
N/A
11.6
N/A
1.0
0.7
2009
82
107
0.30
0.31
10.0
7.3
25.4
29.6
N/A
N/A
N/A
N/A
11.1
N/A
0.9
1.6
2008
102
130
0.32
0.33
11.2
9.3
27.6
31.1
N/A
N/A
N/A
N/A
13.0
22.2
2.1
1.0
2007
108
146
0.37
0.34
13.9
10.0
29.1
28.4
0.001
N/A
N/A
N/A
14.5
26.0
3.0
0.7
2006
107
104
0.44
0.36
13.9
11.3
27.3
29.7
0.000
0.006
N/A
N/A
14.8
N/A
3.3
N/A
2005
109
101
0.53
0.33
14.6
10.7
30.6
28.1
0.000
N/A
N/A
N/A
15.2
N/A
2.7
N/A
2004
89
103
0.53
0.34
14.6
11.5
28.9
30.8
0.001
N/A
N/A
N/A
N/A
N/A
2.8
N/A
2003
85
115
0.57
0.44
15.6
15.0
27.6
31.2
0.003
N/A
N/A
N/A
N/A
N/A
3.0
1.2
2002
103
139
0.63
0.43
15.3
15.2
32.6
44.8
0.003
N/A
N/A
N/A
N/A
N/A
2.7
N/A
2001
108
143
0.72
0.42
17.5
15.1
32.3
47.3
0.005
N/A
N/A
N/A
N/A
N/A
3.9
N/A
2000
107
136
0.79
0.51
18.0
15.4
32.6
41.0
0.014
N/A
N/A
N/A
N/A
N/A
4.4
N/A
Natural disasters
Type
Charlotte
Fresno
Tornado activity compared to U.S. average
111.5%
9.9%
Earthquake activity compared to U.S. average
79%
8,613%
Natural disasters compared to U.S. average
9%
12%
Transportation
Charlotte boasts a good public transit system featuring buses, light rail, and streetcars, with plans for expansion. Additionally, the city is served by Charlotte Douglas International Airport. Fresno's public transit is mostly bus-based, operated by Fresno Area Express. Both cities suffer from traffic congestion, but commute times in general are shorter in Fresno.
Transport
Type
Charlotte
Fresno
Amtrak stations
1
1
Amtrak stations nearby
2
2
FAA registered aircraft
439
408
FAA registered aircraft manufacturers and dealers
12
36
Means of transportation to work
Type
Charlotte
Fresno
Bicycle
0.1%
0.8%
Bus
1.2%
1.3%
Carpooled
8.7%
10.7%
Car alone
86.2%
84.4%
Motorcycle
0.1%
0.2%
Railroad
0.4%
0%
Taxicab
0.2%
0.1%
Walked
1.5%
1.4%
Average travel time to work
Type
Charlotte
Fresno
Average
29.6 min
23.7 min
Other means
24.9 min
21.5 min
Public transportation
44.1 min
45.3 min
Private vehicle occupancy
Type
Charlotte
Fresno
Average
1.2
1.2
Drove alone
90%
88.3%
In 2 person carpool
6.9%
8.5%
In 3 person carpool
1.8%
1.8%
In 4 person carpool
0.8%
0.8%
In 5-6 person carpool
0.5%
0.5%
In 7+ person carpool
0.1%
0.1%
How many people usually rode to work in the car, truck or van.
Real Estate
The real estate market in Charlotte is larger and more active than Fresno, with a variety of housing options from urban apartments to suburban single-family homes. In contrast, Fresno’s market is quieter, but its close proximity to nature makes it appealing, especially for those seeking a slower pace of life.
Neighborhoods
Charlotte is comprised of various neighborhoods each with their vibe, from the bustling Uptown to the historic Dilworth. Fresno has a diverse array of neighborhoods as well, from the upscale Woodward Park to the artsy Tower District.
Houses and residents
Type
Charlotte
Fresno
Houses
393,631
188,756
Average household size (people)
2.5
3.1
Median year apartment built
1998
1977
Median year house/condo built
1993
1983
Length of stay in the house since moving in
11.8 years
12.6 years
Houses occupied
365,269 (92.8%)
181,841 (96.3%)
Houses occupied by owners
193,930 (53.1%)
91,233 (50.2%)
Houses occupied by renters
171,339 (46.9%)
90,608 (49.8%)
Median rent asked for vacant for-rent units
$1,482
$958.34
Median monthly housing costs
$1,302
$1,209
Median price asked for vacant for-sale houses and condos
$445,491
$285,919
Estimated median house or condo value
$321,400
$321,300
Median numbers of rooms
5.3
5
Median number of rooms in apartments
4
4
Median number of rooms in houses and condos
6.6
5.9
Median house price - detached houses
$388,029
$375,492
Median house price - in 2-unit structures
$184,325
$184,112
Median house price - in 3-to-4-unit structures
$178,624
$196,355
Median house price - in 5 or more unit structures
$433,957
$287,684
Median house price - mobile homes
$52,977
$100,122
Median house price - Townhouses or other attached units
$296,370
$260,277
Median house price - All housing units
$378,423
$358,028
Median house age
26
42
Renting percentage
42.6%
50.9%
Housing density (houses/condos per square mile)
1,624.8
1,808.6
House value disparities
33.3%
29.4%
Household income disparities
44.1%
46.4%
Median household income for houses/condes with a mortgage
$105,905
$97,354
Median household income for apartments without a mortgage
$70,681
$73,445
Housing units without a mortgage
3,089 (2.1%)
1,037 (1.7%)
Housing units with both a second mortgage and home equity loan
10,553 (7.2%)
2,880 (4.8%)
Housing units with a mortgage
142,912 (97.9%)
59,354 (98.3%)
Housing units with a home equity loan
171 (0.1%)
68 (0.1%)
Housing units with a second mortgage
13,532 (9.3%)
4,120 (6.8%)
House/condo owner moved in on average (years ago)
9
10
House/condo renter moved in on average (years ago)
1
3
Housing units lacking complete kitchen facilities
0.8%
1.5%
Housing units lacking complete plumbing facilities
0.2%
0.4%
Housing units in structures
Housing units in structures
Charlotte
Fresno
One, detached
52.7%
59.0%
One, attached
9.1%
3.2%
Two
0.9%
3.0%
3 or 4
2.9%
7.8%
5 to 9
7.1%
9.6%
10 to 19
9.5%
3.6%
20 to 49
6.2%
3.4%
50 or more
10.3%
7.5%
Mobile homes
1.4%
2.6%
Boats, RVs, vans, etc.
0.0%
0.1%
Median real estate property taxes paid for housing units
Self-employed workers in own not incorporated business
25,780
14,428
State government workers
16,519
9,836
Unpaid family workers
1,214
890
Industries and Occupations
Finance dominates Charlotte with prominent banks headquartered in the city. Healthcare, education, and energy are other significant sectors. Fresno is an agricultural powerhouse, known as the "Food Capital of the World". Healthcare and education sectors also provide substantial employment opportunities.
Charlotte is home to some nationally recognized hospitals, including Atrium Health and Novant Health Presbyterian Medical Center. Fresno also has a strong healthcare system, led by institutions like Community Medical Centers, which is the region's largest healthcare provider.
In the last decade, Charlotte has seen significant growth and development in its infrastructure, reflecting its growing population and economy. New business complexes, public parks, and transportation systems have been launched. Fresno, on the other hand, has older infrastructure with ongoing initiatives towards upgrades and modernization.
Infrastructure
Type
Charlotte
Fresno
Hospitals
37
32
TV stations
16
4
Arenas or stadiums
3
2
Bank branches located here
202
98
Bank institutions located here
26
25
Main business address for public companies
33
1
Nuclear power plants nearby
2
0
Drinking water stations with no reported violations in the past
24
5
Drinking water stations with reported violations in the past
HMDA - Conventional home purchase loans - Applications denied
Year
Charlotte
Fresno
1999
3,049
717
2000
1,568
484
2001
1,382
462
2002
1,275
569
2003
1,879
1,510
2004
2,415
2,462
2005
3,078
3,394
2006
3,864
3,441
2007
3,106
2,138
2008
1,287
760
2009
617
354
Culture and Food
Charlotte's food scene is a mix of traditional southern fare and innovative culinary creations. The city also hosts many cultural events and festivals throughout the year. Fresno boasts a vibrant culture due to its diverse population with influences from Hispanic, Armenian and other cultures. The food scene in Fresno is also diverse, with a strong emphasis on fresh, locally-sourced foods given its agricultural backdrop.
Sports Teams
Charlotte is home to the Carolina Panthers (NFL), Charlotte Hornets (NBA), and Charlotte FC (MLS). Fresno is primarily a college sports city, with Fresno State Bulldogs garnering significant local support. Fresno does have minor league baseball and hockey teams.


 Charlotte, NC
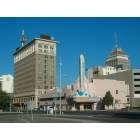
 Fresno, CA