Charlotte, NC, and Jackson, MS, are two vibrant southern cities with unique charms. Both popular destinations for tourists and potential relocation sites, they offer rich histories, cultural attractions, and robust economies. However, they differ in several key areas such as crime rates, weather conditions, cost of living, education, job opportunities, and infrastructure, which affect the overall quality of life. This comprehensive comparison offers insights into the distinct characteristics of each city to help inform decisions on whether to visit or make a more permanent move.
Distance between
Charlotte, NC and
Jackson, MS : 573.9 miles
Charlotte's population is larger by 487%. Its population has grown by 338,881 people (62.7%) since 2000. The population of Jackson has decreased by 34,495 people (18.7%) during that time.
In terms of safety, Charlotte, NC scores higher than Jackson, MS. While both cities have areas with higher crime rates, like most urban areas, Charlotte's overall crime rate tends to be lower than Jackson's. Visitors and residents are always encouraged to stay informed and remain vigilant in any city. In Jackson, safety remains a significant issue, with crime rates considerably higher than the national average.
Cost of Living
Compared to Charlotte, Jackson offers a lower cost of living. Despite Charlotte's larger size and economic growth, the cost of necessities such as housing, groceries, and healthcare are notably higher than in Jackson. However, Charlotte's median income tends to be higher, putting it on par with the cost of living there.
Income Tax
North Carolina has a flat state income tax rate of 5.25%, while Mississippi has a bracketed income tax system ranging from 0% to 5%.
Property Tax
Charlotte's property tax rate is significantly higher at 0.91%, compared to Jackson's 0.81%. However, the higher cost is typically offset by the greater home values and economic opportunities in Charlotte.
Sales Tax
North Carolina's state sales tax is lower at 4.75% compared to Mississippi's 7%. However, combined with Charlotte's local tax, the total sales tax in both cities is similar, around 7%.
Income
Type
Charlotte
Jackson
Estimated median household income
$70,869
$35,070
Estimated per capita income
$44,593
$21,684
Cost of living index (U.S. average is 100)
93.2
83.7
If you make $50,000 in Jackson, you will have to make $55,675 in Charlotte to maintain the same standard of living.
Geographical Conditions
Charlotte's location in the Piedmont region means a lush, hilly terrain and proximity to both mountains and beaches. Jackson is situated on the Pearl River and features a flat landscape typical of the Mississippi Delta.
In terms of educational opportunities, Charlotte outshines Jackson. Charlotte-Mecklenburg Schools is one of the largest school districts in the country, offering a diverse range of educational experiences. Charlotte also boasts several reputable universities like the University of North Carolina at Charlotte. While Jackson has good schools and universities, including Jackson State University, education outcomes in Charlotte tend to be higher.
Charlotte's economy, driven by a strong financial sector, is more robust than Jackson's. Home to multiple Fortune 500 companies, Charlotte offers diverse job opportunities. Jackson's economy is government-based with decent job prospects, but it doesn't quite match Charlotte's dynamic job market.
Biggest Employers
Charlotte's largest employers are Wells Fargo and Bank of America, highlighting the city's financial strength. Atrium Health and Charlotte-Mecklenburg Schools also employ a significant number of residents. In Jackson, the top employers include the State of Mississippi, University of Mississippi Medical Center, and the Federal Government.
In Charlotte (Mecklenburg County), 60.8% voted for Democrats and 38.3% for Republicans in 2012 Presidential Election. In Jackson (Hinds County), 71.7% voted for Democrats and 27.9% for Republicans.
Elections
Type
Democrats
Republicans
Other
Year
Charlotte
Jackson
Charlotte
Jackson
Charlotte
Jackson
2020
66.8%
73.9%
31.6%
25.3%
1.6%
0.8%
2016
62.3%
71.1%
32.9%
26.6%
4.8%
2.3%
2012
60.8%
71.7%
38.3%
27.9%
0.9%
0.3%
2008
62.0%
69.6%
37.6%
30.4%
0.5%
0.0%
2004
51.7%
59.7%
48.0%
40.3%
0.3%
0.0%
2000
48.4%
53.6%
51.1%
43.3%
0.5%
3.1%
1996
48.6%
53.7%
45.9%
42.2%
5.5%
4.1%
Breakdown of population affiliated with a religious congregation
Type
Adherents
Congregations
Religion
Charlotte
Jackson
Charlotte
Jackson
SOUTHERN BAPTIST CONVENTION
9.0%
20.1%
19.0%
17.3%
CATHOLIC CHURCH
8.5%
3.0%
1.8%
2.2%
AMERICAN BAPTIST CHURCHES IN THE USA
2.3%
0.0%
1.1%
0.0%
EPISCOPAL CHURCH
1.2%
2.1%
1.3%
2.5%
EVANGELICAL LUTHERAN CHURCH IN AMERICA
0.9%
0.1%
1.8%
0.5%
PRESBYTERIAN CHURCH IN AMERICA
0.6%
1.9%
1.9%
3.2%
SEVENTH DAY ADVENTIST CHURCH
0.5%
0.8%
1.5%
0.7%
MUSLIM ESTIMATE
0.3%
0.3%
1.2%
0.5%
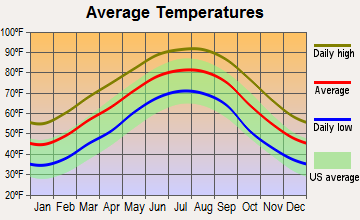
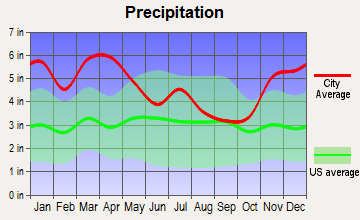
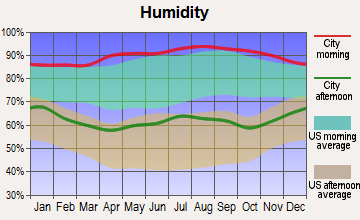
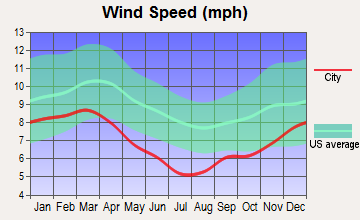
Weather
Jackson, MS, experiences warmer temperatures throughout the year compared to Charlotte, NC. Both cities experience hot summers, with Jackson's being slightly hotter. Winters in Charlotte can be cooler with the occasional snowfall, which is a rarity in Jackson. Both cities receive substantial rainfall throughout the year but are unlikely to be affected by severe weather like hurricanes.
Weather and climate
Type
Charlotte
Jackson
Temperature - Average
61°F
64.1°F
Humidity - Average morning or afternoon humidity
72.3%
79.4%
Humidity - Differences between morning and afternoon humidity
41%
40%
Humidity - Maximum monthly morning or afternoon humidity
87%
93%
Humidity - Minimum monthly morning or afternoon humidity
46%
53%
Precipitation - Yearly average
44.5 in
56 in
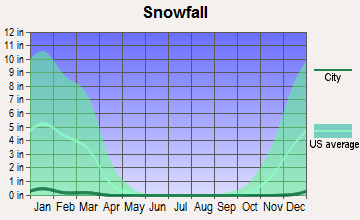
Snowfall - Yearly average
10.2 in
2 in
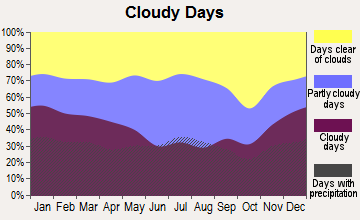
Clouds - Number of days clear of clouds
18.1%
18.6%
Sunshine amount - Average
69.8%
64.5%
Sunshine amount - Differences during a year
14%
23%
Sunshine amount - Maximum monthly
70%
70%
Sunshine amount - Minimum monthly
56%
47%
Wind speed - Average
6.9 mph
6.7 mph
Average climate in Charlotte, North Carolina
Average climate in Jackson, Mississippi
Air pollution
Type
AQI
CO
NO2
OZONE
PB
PM10
PM25
SO2
Year
Charlotte
Jackson
Charlotte
Jackson
Charlotte
Jackson
Charlotte
Jackson
Charlotte
Charlotte
Jackson
Charlotte
Jackson
Charlotte
Jackson
2018
75
80
0.24
0.14
6.3
6.8
27.8
26.5
N/A
N/A
15.5
20.4
8.2
9.8
0.2
0.5
2017
77
73
0.25
0.26
7.0
6.8
28.0
25.6
N/A
N/A
16.3
N/A
8.8
9.5
0.2
0.6
2016
82
70
0.25
0.22
7.6
6.4
28.7
27.0
N/A
N/A
N/A
N/A
8.4
9.5
0.2
0.5
2015
76
76
0.25
0.33
8.1
N/A
27.6
26.1
N/A
N/A
N/A
N/A
8.6
10.5
0.2
0.7
2014
76
75
0.26
0.22
8.5
N/A
26.3
25.3
N/A
N/A
N/A
N/A
9.3
10.9
0.3
0.7
2013
71
71
0.29
N/A
8.4
N/A
25.5
25.9
N/A
N/A
N/A
N/A
8.6
10.1
0.3
N/A
2012
95
73
0.28
N/A
8.7
N/A
27.3
27.9
N/A
N/A
N/A
N/A
9.7
10.5
0.3
N/A
2011
94
85
0.34
0.24
10.1
N/A
28.9
28.4
N/A
N/A
N/A
N/A
11.2
11.9
0.6
0.7
2010
97
73
0.33
N/A
11.8
N/A
28.0
27.6
N/A
N/A
N/A
N/A
11.6
11.0
1.0
N/A
2009
82
71
0.30
N/A
10.0
N/A
25.4
25.9
N/A
N/A
N/A
N/A
11.1
10.8
0.9
N/A
2008
102
74
0.32
N/A
11.2
N/A
27.6
27.8
N/A
N/A
N/A
N/A
13.0
11.7
2.1
N/A
2007
108
83
0.37
N/A
13.9
N/A
29.1
28.2
0.001
N/A
N/A
N/A
14.5
12.9
3.0
N/A
2006
107
85
0.44
N/A
13.9
N/A
27.3
32.5
0.000
N/A
N/A
N/A
14.8
12.0
3.3
N/A
2005
109
89
0.53
N/A
14.6
N/A
30.6
29.3
0.000
N/A
N/A
N/A
15.2
14.0
2.7
1.1
2004
89
84
0.53
N/A
14.6
N/A
28.9
25.2
0.001
N/A
N/A
N/A
N/A
12.5
2.8
0.9
2003
85
79
0.57
N/A
15.6
N/A
27.6
26.0
0.003
N/A
N/A
N/A
N/A
13.1
3.0
1.3
2002
103
72
0.63
N/A
15.3
N/A
32.6
25.4
0.003
N/A
N/A
N/A
N/A
12.9
2.7
1.5
2001
108
62
0.72
N/A
17.5
N/A
32.3
28.3
0.005
N/A
N/A
N/A
N/A
N/A
3.9
1.6
2000
107
73
0.79
N/A
18.0
N/A
32.6
31.4
0.014
N/A
N/A
N/A
N/A
N/A
4.4
1.5
Natural disasters
Type
Charlotte
Jackson
Tornado activity compared to U.S. average
111.5%
268.3%
Earthquake activity compared to U.S. average
79%
301.5%
Natural disasters compared to U.S. average
9%
14%
Transportation
Charlotte provides more comprehensive public transportation with a light rail system, bus service, and bike-sharing options, making commuting in the city easier. Jackson's public transportation system is limited to bus service, and most residents prefer to drive.
Transport
Type
Charlotte
Jackson
Amtrak stations
1
1
Amtrak stations nearby
2
1
FAA registered aircraft
439
102
FAA registered aircraft manufacturers and dealers
12
0
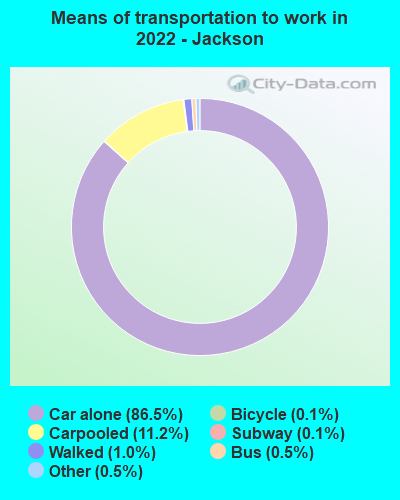
Means of transportation to work
Type
Charlotte
Jackson
Bicycle
0.1%
0.1%
Bus
1.2%
0.5%
Carpooled
8.7%
10.8%
Car alone
86.2%
86.9%
Railroad
0.4%
0%
Subway
0%
0.1%
Taxicab
0.2%
0.2%
Walked
1.5%
1%
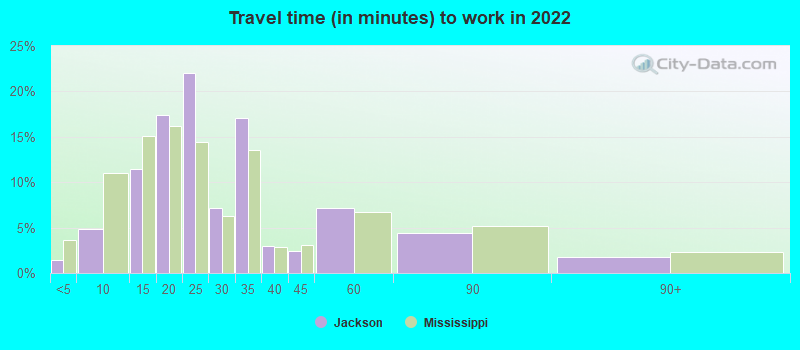
Average travel time to work
Type
Charlotte
Jackson
Average
29.6 min
26.9 min
Other means
24.9 min
20.4 min
Public transportation
44.1 min
37.7 min
Private vehicle occupancy
Type
Charlotte
Jackson
Average
1.2
1.2
Drove alone
90%
87.3%
In 2 person carpool
6.9%
9.7%
In 3 person carpool
1.8%
1.8%
In 4 person carpool
0.8%
0.5%
In 5-6 person carpool
0.5%
0.2%
How many people usually rode to work in the car, truck or van.
Real Estate
Real estate in Charlotte is more expensive than in Jackson due to high demand and a booming economy. Charlotte has a competitive market with a variety of housing options from city apartments to suburban homes. Jackson's real estate market, though cheaper, has been stagnant in recent years.
Neighborhoods
Each city offers distinct neighborhoods with their own charm. In Charlotte, Uptown is the thriving city center while Myers Park or Dilworth provide quieter, more residential atmospheres. Jackson has culturally rich neighborhoods like Fondren and LeFleur East, known for their arts scene and culinary offerings.
Houses and residents
Type
Charlotte
Jackson
Houses
393,631
74,637
Average household size (people)
2.5
2.6
Median year apartment built
1998
1969
Median year house/condo built
1993
1966
Length of stay in the house since moving in
11.8 years
16.8 years
Houses occupied
365,269 (92.8%)
62,140 (83.3%)
Houses occupied by owners
193,930 (53.1%)
28,891 (46.5%)
Houses occupied by renters
171,339 (46.9%)
33,249 (53.5%)
Median rent asked for vacant for-rent units
$1,482
$636.86
Median monthly housing costs
$1,302
$887
Median price asked for vacant for-sale houses and condos
$445,491
$93,133
Estimated median house or condo value
$321,400
$101,500
Median numbers of rooms
5.3
5.3
Median number of rooms in apartments
4
4.7
Median number of rooms in houses and condos
6.6
6.7
Median house price - detached houses
$388,029
$157,221
Median house price - in 2-unit structures
$184,325
$112,007
Median house price - in 3-to-4-unit structures
$178,624
$66,599
Median house price - in 5 or more unit structures
$433,957
$140,616
Median house price - mobile homes
$52,977
$50,741
Median house price - Townhouses or other attached units
$296,370
$230,182
Median house price - All housing units
$378,423
$155,015
Median house age
26
54
Renting percentage
42.6%
46.9%
Housing density (houses/condos per square mile)
1,624.8
711.5
House value disparities
33.3%
48.4%
Household income disparities
44.1%
48.8%
Median household income for houses/condes with a mortgage
$105,905
$60,786
Median household income for apartments without a mortgage
$70,681
$38,610
Housing units without a mortgage
3,089 (2.1%)
211 (1.4%)
Housing units with both a second mortgage and home equity loan
10,553 (7.2%)
748 (5.1%)
Housing units with a mortgage
142,912 (97.9%)
14,400 (98.6%)
Housing units with a home equity loan
171 (0.1%)
219 (1.5%)
Housing units with a second mortgage
13,532 (9.3%)
1,482 (10.1%)
House/condo owner moved in on average (years ago)
9
18
House/condo renter moved in on average (years ago)
1
1
Housing units lacking complete kitchen facilities
0.8%
6.7%
Housing units lacking complete plumbing facilities
0.2%
9.2%
Housing units in structures
Housing units in structures
Charlotte
Jackson
One, detached
52.7%
68.3%
One, attached
9.1%
1.4%
Two
0.9%
2.0%
3 or 4
2.9%
5.3%
5 to 9
7.1%
9.7%
10 to 19
9.5%
4.8%
20 to 49
6.2%
3.5%
50 or more
10.3%
4.0%
Mobile homes
1.4%
1.2%
Median real estate property taxes paid for housing units
Self-employed workers in own not incorporated business
25,780
4,044
State government workers
16,519
7,585
Unpaid family workers
1,214
34
Industries and Occupations
Both cities have diverse industries and occupations. Charlotte is a major banking city, second only to New York, with finance being one of the top industries. Healthcare, education, and technology are also strong. Jackson's economy revolves around government, healthcare, and manufacturing sectors.
Charlotte is known for its excellent healthcare facilities, spearheaded by Atrium Health. Jackson also offers quality healthcare through the University of Mississippi Medical Center and St. Dominic Hospital.
Health (county statistics)
Type
Charlotte
Jackson
General health status score of residents in this county from 1 (poor) to 5 (excellent)
Charlotte, a rapidly growing city, continuously invests in its infrastructure. The city is home to a major international airport and boasts an extensive light rail system. In contrast, Jackson's infrastructure faces challenges due to its ageing facilities, which the city is striving to improve.
Infrastructure
Type
Charlotte
Jackson
Hospitals
37
24
TV stations
16
13
Arenas or stadiums
3
2
Bank branches located here
202
61
Bank institutions located here
26
12
Main business address for public companies
33
4
Nuclear power plants nearby
2
0
Drinking water stations with no reported violations in the past
24
1
Drinking water stations with reported violations in the past
HMDA - Conventional home purchase loans - Applications denied
Year
Charlotte
Jackson
1999
3,049
742
2000
1,568
683
2001
1,382
665
2002
1,275
611
2003
1,879
674
2004
2,415
1,025
2005
3,078
1,673
2006
3,864
1,699
2007
3,106
925
2008
1,287
319
2009
617
94
Culture and Food
Both cities have vibrant cultural scenes. Charlotte is known for its arts and culture with various museums, theaters, and live music venues. Jackson is recognized for its rich history, blues music, and southern cuisine.
Sports Teams
Charlotte is home to multiple professional sports teams such as the Charlotte Hornets (NBA) and the Carolina Panthers (NFL). Jackson doesn't have major league teams, but sports fans enjoy college athletics, particularly football.


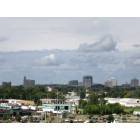
 Charlotte, NC
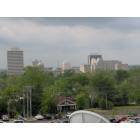
 Jackson, MS