Charlotte, North Carolina, and Madison, Wisconsin, are two unique and lively cities. Each offers a distinct blend of culture, lifestyle, and community, influenced by its geographical location, local industries, and historical roots. Both cities have thriving economies, quality educational institutions, and various recreational and cultural pursuits. While Charlotte is a major financial hub with a warmer climate, Madison is renowned for its educational assets and progressive values. Both offer unique pros and cons for residents and tourists alike.
Distance between
Charlotte, NC and
Madison, WI : 710.6 miles
Charlotte's population is larger by 227%. Its population has grown by 338,881 people (62.7%) since 2000. The population of Madison has grown by 61,142 people (29.4%) during that time.
Safety is a priority for both residents and visitors. Charlotte's overall crime rate is higher than the national average and higher than Madison's. However, it's essential to note that crime rates can vary significantly within city neighborhoods. Madison generally has lower crime rates and is regarded as one of the safest cities in the U.S. Both cities have robust law enforcement systems with community-centered policies aimed at ensuring the safety of citizens.
Cost of Living
In terms of cost of living, Madison is generally more expensive than Charlotte. Housing costs contribute significantly to this difference, with homes in Madison being pricier. However, health care and groceries are slightly more expensive in Charlotte. Utilities and transportation costs are comparable in both cities.
Income Tax
North Carolina has a flat state income tax rate of 5.25%. On the other hand, Wisconsin's state income tax is progressive, ranging from 4% to 7.65% depending on income.
Property Tax
Both cities have property taxes, with Madison generally having higher rates than Charlotte. Average property tax rate in Madison is around 2.02% of assessed home value, whereas it's approximately 0.98% in Charlotte.
Sales Tax
North Carolina has a state sales tax of 4.75% and Charlotte has an additional 2.25% for a total of 7%. Wisconsin's state sales tax sits at 5%, with an additional 0.5% at the county level in Madison, making a total of 5.5%.
Income
Type
Charlotte
Madison
Estimated median household income
$70,869
$67,270
Estimated per capita income
$44,593
$42,473
Cost of living index (U.S. average is 100)
93.2
98.2
If you make $50,000 in Charlotte, you will have to make $52,682 in Madison to maintain the same standard of living.
Geographical Conditions
Charlotte lies in the Piedmont region, near the Appalachian Mountains. Its location provides opportunities for hiking and other outdoor activities. Madison is nestled between two large lakes, offering a range of water-related activities.
Both cities boast strong educational systems and facilities. Charlotte is served by the Charlotte-Mecklenburg School system, the second-largest public school district in North Carolina. It's also home to well-respected higher education institutes like University of North Carolina at Charlotte. Madison is famously home to the University of Wisconsin-Madison, one of the nation's top public universities. The Madison Metropolitan School District caters to the primary and secondary educational needs of the city.
Charlotte has a booming economy, bolstered by the banking and finance sector. It's the second-largest banking center in the U.S. after New York City. In contrast, Madison's economy is balanced between manufacturing, agriculture, and government services. Madison is also known for its technology and health sectors.
Biggest Employers
In Charlotte, some of the largest employers are Bank of America, Wells Fargo, and Atrium Health. Madison’s biggest employers include the University of Wisconsin–Madison, American Family Insurance, and Epic Systems Corporation.
In Charlotte (Mecklenburg County), 60.8% voted for Democrats and 38.3% for Republicans in 2012 Presidential Election. In Madison (Dane County), 71.2% voted for Democrats and 27.6% for Republicans.
Elections
Type
Democrats
Republicans
Other
Year
Charlotte
Madison
Charlotte
Madison
Charlotte
Madison
2020
66.8%
75.9%
31.6%
23.0%
1.6%
1.1%
2016
62.3%
70.5%
32.9%
23.1%
4.8%
6.5%
2012
60.8%
71.2%
38.3%
27.6%
0.9%
1.2%
2008
62.0%
73.2%
37.6%
26.0%
0.5%
0.9%
2004
51.7%
66.2%
48.0%
33.0%
0.3%
0.8%
2000
48.4%
61.4%
51.1%
32.7%
0.5%
6.0%
1996
48.6%
56.9%
45.9%
30.9%
5.5%
12.2%
Breakdown of population affiliated with a religious congregation
Type
Adherents
Congregations
Religion
Charlotte
Madison
Charlotte
Madison
SOUTHERN BAPTIST CONVENTION
9.0%
0.1%
19.0%
2.3%
CATHOLIC CHURCH
8.5%
21.7%
1.8%
9.7%
AMERICAN BAPTIST CHURCHES IN THE USA
2.3%
0.8%
1.1%
0.9%
EPISCOPAL CHURCH
1.2%
0.3%
1.3%
1.4%
EVANGELICAL LUTHERAN CHURCH IN AMERICA
0.9%
10.0%
1.8%
13.7%
PRESBYTERIAN CHURCH IN AMERICA
0.6%
0.0%
1.9%
0.9%
SEVENTH DAY ADVENTIST CHURCH
0.5%
0.2%
1.5%
0.9%
LUTHERAN CHURCH
0.3%
0.8%
0.9%
3.4%
MUSLIM ESTIMATE
0.3%
0.5%
1.2%
0.9%
WISCONSIN EVANGELICAL LUTHERAN SYNOD
0.0%
0.9%
0.1%
3.1%
Weather
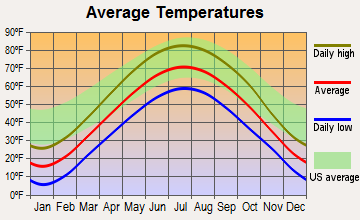
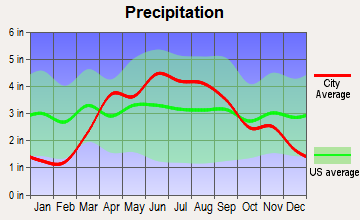
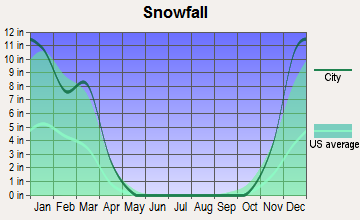
Weather could play a major role in your relocation decision. Charlotte presents a humid subtropical climate, with mild winters and hot, humid summers. Rainfall is evenly distributed throughout the year. Madison, on the other hand, faces a humid continental climate, with hot, humid summers and chilly, snowy winters. Madison's winters can be particularly harsh, particularly for those not used to such conditions.
Weather and climate
Type
Charlotte
Madison
Temperature - Average
61°F
45.4°F
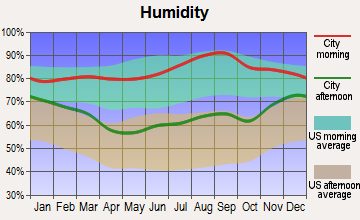
Humidity - Average morning or afternoon humidity
72.3%
77.7%
Humidity - Differences between morning and afternoon humidity
41%
37%
Humidity - Maximum monthly morning or afternoon humidity
87%
90%
Humidity - Minimum monthly morning or afternoon humidity
46%
53%
Precipitation - Yearly average
44.5 in
35.2 in
Snowfall - Yearly average
10.2 in
88.6 in
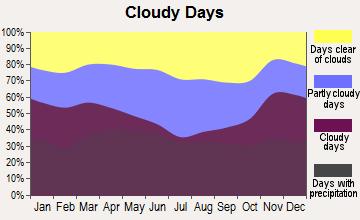
Clouds - Number of days clear of clouds
18.1%
14.7%
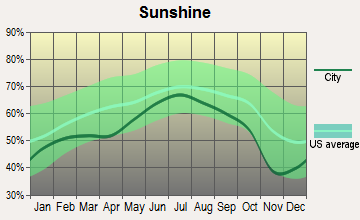
Sunshine amount - Average
69.8%
56.6%
Sunshine amount - Differences during a year
14%
31%
Sunshine amount - Maximum monthly
70%
67%
Sunshine amount - Minimum monthly
56%
36%
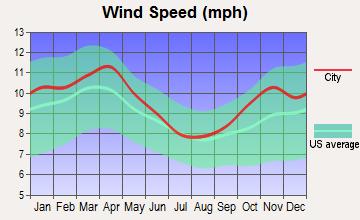
Wind speed - Average
6.9 mph
8.8 mph
Average climate in Charlotte, North Carolina
Average climate in Madison, Wisconsin
Air pollution
Type
AQI
CO
NO2
OZONE
PB
PM10
PM25
SO2
Year
Charlotte
Madison
Charlotte
Charlotte
Charlotte
Madison
Charlotte
Madison
Charlotte
Charlotte
Madison
Charlotte
Madison
2018
75
72
0.24
N/A
6.3
N/A
27.8
31.7
N/A
N/A
15.5
N/A
8.2
8.6
0.2
0.2
2017
77
67
0.25
N/A
7.0
N/A
28.0
31.0
N/A
N/A
16.3
N/A
8.8
7.4
0.2
0.8
2016
82
68
0.25
N/A
7.6
N/A
28.7
31.3
N/A
N/A
N/A
N/A
8.4
8.5
0.2
0.0
2015
76
72
0.25
N/A
8.1
N/A
27.6
32.2
N/A
N/A
N/A
N/A
8.6
7.6
0.2
0.1
2014
76
79
0.26
N/A
8.5
N/A
26.3
32.2
N/A
N/A
N/A
N/A
9.3
8.8
0.3
1.1
2013
71
75
0.29
N/A
8.4
N/A
25.5
34.0
N/A
N/A
N/A
N/A
8.6
9.2
0.3
1.4
2012
95
92
0.28
N/A
8.7
N/A
27.3
36.6
N/A
N/A
N/A
N/A
9.7
9.3
0.3
N/A
2011
94
85
0.34
N/A
10.1
N/A
28.9
32.0
N/A
N/A
N/A
N/A
11.2
10.5
0.6
N/A
2010
97
81
0.33
N/A
11.8
N/A
28.0
30.9
N/A
N/A
N/A
N/A
11.6
12.6
1.0
N/A
2009
82
49
0.30
N/A
10.0
N/A
25.4
27.9
N/A
N/A
N/A
N/A
11.1
N/A
0.9
N/A
2008
102
54
0.32
N/A
11.2
N/A
27.6
29.3
N/A
N/A
N/A
N/A
13.0
N/A
2.1
N/A
2007
108
68
0.37
N/A
13.9
N/A
29.1
29.0
0.001
N/A
N/A
N/A
14.5
N/A
3.0
N/A
2006
107
56
0.44
N/A
13.9
N/A
27.3
27.8
0.000
N/A
N/A
N/A
14.8
N/A
3.3
N/A
2005
109
88
0.53
N/A
14.6
N/A
30.6
34.6
0.000
0.004
N/A
N/A
15.2
N/A
2.7
N/A
2004
89
62
0.53
N/A
14.6
N/A
28.9
29.2
0.001
N/A
N/A
N/A
N/A
N/A
2.8
N/A
2003
85
85
0.57
N/A
15.6
N/A
27.6
34.2
0.003
0.005
N/A
N/A
N/A
N/A
3.0
N/A
2002
103
89
0.63
N/A
15.3
N/A
32.6
33.3
0.003
0.005
N/A
N/A
N/A
N/A
2.7
N/A
2001
108
83
0.72
N/A
17.5
N/A
32.3
33.6
0.005
N/A
N/A
N/A
N/A
N/A
3.9
N/A
2000
107
78
0.79
N/A
18.0
N/A
32.6
28.5
0.014
N/A
N/A
N/A
N/A
N/A
4.4
N/A
Natural disasters
Type
Charlotte
Madison
Tornado activity compared to U.S. average
111.5%
172.3%
Earthquake activity compared to U.S. average
79%
137.1%
Natural disasters compared to U.S. average
9%
18%
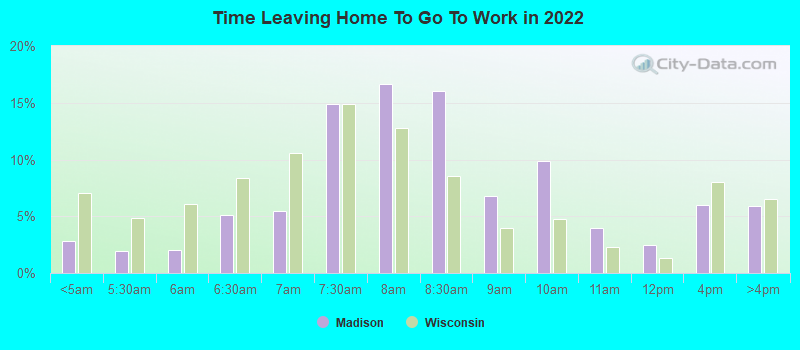
Transportation
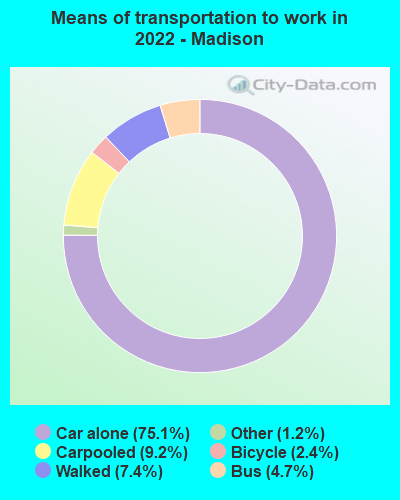
Charlotte offers various transit options, such as buses, trams, and light rail, making commuting relatively easy. Madison's public transit system is primarily bus-based. Both cities offer bike-friendly paths and are easily navigable on foot or by car.
Transport
Type
Charlotte
Madison
Amtrak stations
1
1
Amtrak stations nearby
2
1
FAA registered aircraft
439
192
FAA registered aircraft manufacturers and dealers
12
0
Means of transportation to work
Type
Charlotte
Madison
Bicycle
0.1%
2.6%
Bus
1.2%
2.7%
Carpooled
8.7%
6%
Car alone
86.2%
78.7%
Motorcycle
0.1%
0.2%
Railroad
0.4%
0%
Taxicab
0.2%
0.2%
Walked
1.5%
8%
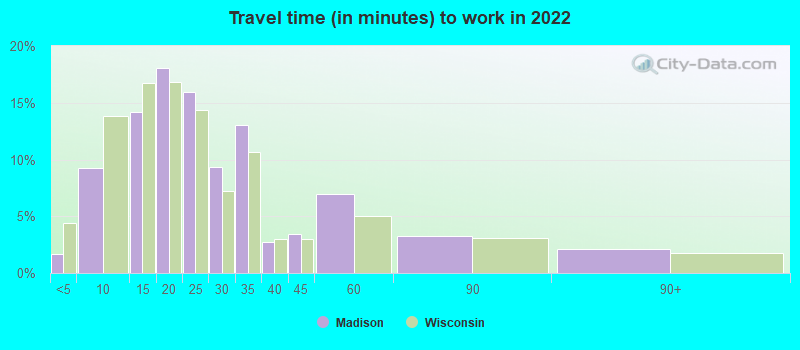
Average travel time to work
Type
Charlotte
Madison
Average
29.6 min
24.5 min
Other means
24.9 min
19 min
Public transportation
44.1 min
29.2 min
Private vehicle occupancy
Type
Charlotte
Madison
Average
1.2
1.1
Drove alone
90%
91.8%
In 2 person carpool
6.9%
6.5%
In 3 person carpool
1.8%
0.9%
In 4 person carpool
0.8%
0.2%
In 5-6 person carpool
0.5%
0.2%
How many people usually rode to work in the car, truck or van.
Real Estate
Real estate in Charlotte offers a mix of suburban, urban, and rural properties. Although the cost of housing in Charlotte has seen a rise, it's still more affordable compared to Madison. Madison's real estate market is competitive, with a high demand for housing, especially near the university and downtown areas.
Neighborhoods
Charlotte has many distinctive neighborhoods such as Dilworth with its bungalow-style homes and Myers Park with its historic mansions. Madison's neighborhoods are equally diverse, with the hipster Williamson-Marquette and the family-friendly Middleton Hills among its highlights.
Houses and residents
Type
Charlotte
Madison
Houses
393,631
129,717
Average household size (people)
2.5
2.2
Median year apartment built
1998
1982
Median year house/condo built
1993
1974
Length of stay in the house since moving in
11.8 years
13.2 years
Houses occupied
365,269 (92.8%)
123,938 (95.5%)
Houses occupied by owners
193,930 (53.1%)
60,243 (48.6%)
Houses occupied by renters
171,339 (46.9%)
63,695 (51.4%)
Median rent asked for vacant for-rent units
$1,482
$2,135
Median monthly housing costs
$1,302
$1,351
Median price asked for vacant for-sale houses and condos
$445,491
$175,077
Estimated median house or condo value
$321,400
$321,800
Median numbers of rooms
5.3
4.9
Median number of rooms in apartments
4
3.7
Median number of rooms in houses and condos
6.6
6.5
Median house price - detached houses
$388,029
$351,769
Median house price - in 2-unit structures
$184,325
$350,485
Median house price - in 3-to-4-unit structures
$178,624
$238,103
Median house price - in 5 or more unit structures
$433,957
$277,140
Median house price - mobile homes
$52,977
$9,290
Median house price - Townhouses or other attached units
$296,370
$258,266
Median house price - All housing units
$378,423
$335,361
Median house age
26
43
Renting percentage
42.6%
50.7%
Housing density (houses/condos per square mile)
1,624.8
1,888.9
House value disparities
33.3%
27.2%
Household income disparities
44.1%
45.9%
Median household income for houses/condes with a mortgage
$105,905
$112,726
Median household income for apartments without a mortgage
$70,681
$80,181
Housing units without a mortgage
3,089 (2.1%)
1,001 (2.3%)
Housing units with both a second mortgage and home equity loan
10,553 (7.2%)
5,840 (13.7%)
Housing units with a mortgage
142,912 (97.9%)
41,600 (97.7%)
Housing units with a home equity loan
171 (0.1%)
44 (0.1%)
Housing units with a second mortgage
13,532 (9.3%)
6,790 (15.9%)
House/condo owner moved in on average (years ago)
9
11
House/condo renter moved in on average (years ago)
1
1
Housing units lacking complete kitchen facilities
0.8%
0.6%
Housing units lacking complete plumbing facilities
0.2%
0.2%
Housing units in structures
Housing units in structures
Charlotte
Madison
One, detached
52.7%
41.5%
One, attached
9.1%
5.7%
Two
0.9%
4.5%
3 or 4
2.9%
7.1%
5 to 9
7.1%
8.0%
10 to 19
9.5%
5.2%
20 to 49
6.2%
12.3%
50 or more
10.3%
15.4%
Mobile homes
1.4%
0.2%
Median real estate property taxes paid for housing units
Self-employed workers in own not incorporated business
25,780
7,087
State government workers
16,519
26,258
Unpaid family workers
1,214
73
Industries and Occupations
The dominant industries in Charlotte are finance, technology, and healthcare. Top occupations include roles related to management, business, science, and arts. Madison's economy revolves around education, healthcare, government, and manufacturing. It is known for its high-tech jobs and innovative startup culture.
Both cities offer excellent healthcare services. Charlotte is home to several highly-ranked hospitals, including Atrium Health's Carolinas Medical Center. Madison also has top-rated facilities, such as the University of Wisconsin Hospitals.
Health (county statistics)
Type
Charlotte
Madison
General health status score of residents in this county from 1 (poor) to 5 (excellent)
Charlotte has developed infrastructure with skyscrapers, highways, and an international airport. Light rail and streetcar services render the city easily navigable. Madison, though smaller in size, is considered a well-planned city, famous for its lakes, parks, and bike trails. High-quality public services and amenities are easily accessible.
Infrastructure
Type
Charlotte
Madison
Hospitals
37
10
TV stations
16
9
Arenas or stadiums
3
2
Bank branches located here
202
90
Bank institutions located here
26
23
Main business address for public companies
33
7
Nuclear power plants nearby
2
0
Drinking water stations with no reported violations in the past
24
169
Drinking water stations with reported violations in the past
HMDA - Conventional home purchase loans - Applications denied
Year
Charlotte
Madison
1999
3,049
218
2000
1,568
210
2001
1,382
157
2002
1,275
167
2003
1,879
305
2004
2,415
398
2005
3,078
532
2006
3,864
453
2007
3,106
354
2008
1,287
196
2009
617
160
Culture and Food
Culturally, Charlotte offers a taste of the South, from its food to its music. It's known for its barbeque and soul food. Madison boasts a diverse food scene with an emphasis on farm-to-table dining and artisanal foods. Both cities offer a range of cultural festivals, theaters, and museums.
Sports Teams
Charlotte is home to the Carolina Panthers (NFL) and the Charlotte Hornets (NBA). Madison, while not hosting any major league teams, has a vibrant sports culture centered around the University of Wisconsin-Madison's Badgers.


 Charlotte, NC
 Madison, WI