Charlotte, North Carolina, and Overland Park, Kansas are two diverse US cities, both offering unique features and strengths in areas such as cost of living, education, economy, and safety. Charlotte, a bustling city with a vibrant cultural and sports scene, contrasts with Overland Park's suburban feel and excellent public safety ratings. As we explore these cities further, it is clear how this contrast manifests in differences in real estate, infrastructure, tax, and healthcare.
Distance between
Charlotte, NC and
Overland Park, KS : 804.9 miles
Charlotte's population is larger by 346%. Its population has grown by 338,881 people (62.7%) since 2000. The population of Overland Park has grown by 48,026 people (32.2%) during that time.
Overland Park, KS is known for its exceptionally low crime rates, making it attractive for families and individuals who prioritize safety. While it doesn't completely lack crime, it consistently ranks among the nation's safest cities. The situation in Charlotte, NC, is complex. While the city has a higher crime rate than many other US cities, strategies for crime reduction and prevention have been implemented to help address this. It's always suggested for potential residents and visitors to exercise caution and utilize resources like local neighborhood crime maps and reports to stay informed.
Cost of Living
The cost of living in Charlotte, NC, is slightly higher than that in Overland Park, KS. However, home prices tend to be lower in Charlotte, and salaries are typically higher, which may balance out costs for many residents. Energy costs, groceries, and health care are often pricier in Overland Park.
Income Tax
North Carolina has a flat income tax rate of 5.25%, which applies to residents in Charlotte. In contrast, Kansas has a progressive income tax and Overland Park residents could pay a rate ranging from 3.1% to 5.7% depending on their income level.
Property Tax
Property taxes differ, with Charlotte homeowners facing an average rate of 0.83%, while in Overland Park, the average rate is slightly less, at 0.793%.
Sales Tax
Overland, KS, has a city sales tax of 9.475%, which is higher than Charlotte's, NC, which is 7.25%. These rates are in addition to the state sales tax, changing the total tax percentage.
Income
Type
Charlotte
Overland Park
Estimated median household income
$70,869
$89,280
Estimated per capita income
$44,593
$50,828
Cost of living index (U.S. average is 100)
93.2
88.1
If you make $50,000 in Overland Park, you will have to make $52,894 in Charlotte to maintain the same standard of living.
Geographical Conditions
Overland Park is located in the Great Plains region and has a landscape of flat river valleys and hills. Charlotte, on the other hand, is situated in the piedmont region, between coastal plains and the Appalachian Mountains.
Both cities have strong educational systems. Overland Park offers some of the top high schools in Kansas, while Charlotte provides a range of educational opportunities, including some highly rated public and private schools. Both cities have quality post-secondary educational facilities as well, with the University of North Carolina at Charlotte and Johnson County Community College in Overland Park.
Charlotte's economy is robust, with a strong job market driven by sectors such as finance, technology, and energy. It is home to the corporate headquarters of Bank of America and the East Coast operations of Wells Fargo. Overland Park has a diverse economy, with key industries including telecommunications, healthcare, and retail. It is home to the global headquarters of telecom giant Sprint.
Biggest Employers
Bank of America, Wells Fargo, and American Airlines are some of the largest employers in Charlotte. Sprint, AdventHealth Shawnee Mission, and Black & Veatch define the employment environment in Overland Park.
In Charlotte (Mecklenburg County), 60.8% voted for Democrats and 38.3% for Republicans in 2012 Presidential Election. In Overland Park (Johnson County), 40.3% voted for Democrats and 57.8% for Republicans.
Elections
Type
Democrats
Republicans
Other
Year
Charlotte
Overland Park
Charlotte
Overland Park
Charlotte
Overland Park
2020
66.8%
53.1%
31.6%
44.8%
1.6%
2.1%
2016
62.3%
44.1%
32.9%
46.7%
4.8%
9.1%
2012
60.8%
40.3%
38.3%
57.8%
0.9%
1.9%
2008
62.0%
44.8%
37.6%
53.8%
0.5%
1.3%
2004
51.7%
37.9%
48.0%
61.2%
0.3%
0.9%
2000
48.4%
36.4%
51.1%
59.8%
0.5%
3.7%
1996
48.6%
35.7%
45.9%
57.8%
5.5%
6.5%
Breakdown of population affiliated with a religious congregation
Type
Adherents
Congregations
Religion
Charlotte
Overland Park
Charlotte
Overland Park
SOUTHERN BAPTIST CONVENTION
9.0%
4.5%
19.0%
7.4%
CATHOLIC CHURCH
8.5%
18.8%
1.8%
5.1%
AMERICAN BAPTIST CHURCHES IN THE USA
2.3%
0.9%
1.1%
3.7%
EPISCOPAL CHURCH
1.2%
0.7%
1.3%
1.4%
EVANGELICAL LUTHERAN CHURCH IN AMERICA
0.9%
1.4%
1.8%
3.4%
PRESBYTERIAN CHURCH IN AMERICA
0.6%
0.2%
1.9%
1.1%
SEVENTH DAY ADVENTIST CHURCH
0.5%
0.3%
1.5%
1.7%
LUTHERAN CHURCH
0.3%
1.8%
0.9%
2.6%
MUSLIM ESTIMATE
0.3%
0.5%
1.2%
0.9%
Weather
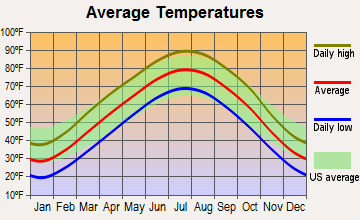
Charlotte, NC, has a humid subtropical climate, with four distinct seasons, including hot, humid summers, and mild winters. Overland Park, KS, also has four seasons but the weather tends to be more extreme. The summers are hot and muggy, but the winters can be bitter with consistent snowfall. Overall, Charlotte might be more appealing to those who prefer milder winters.
Weather and climate
Type
Charlotte
Overland Park
Temperature - Average
61°F
55.5°F
Humidity - Average morning or afternoon humidity
72.3%
76.3%
Humidity - Differences between morning and afternoon humidity
41%
30.4%
Humidity - Maximum monthly morning or afternoon humidity
87%
86.2%
Humidity - Minimum monthly morning or afternoon humidity
46%
55.7%
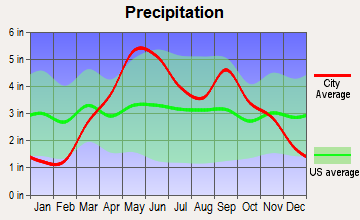
Precipitation - Yearly average
44.5 in
39.6 in
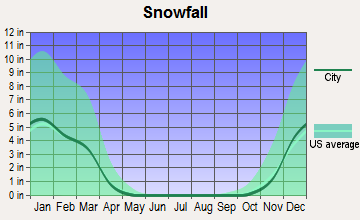
Snowfall - Yearly average
10.2 in
38.1 in
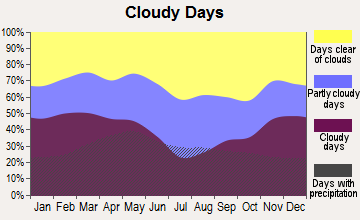
Clouds - Number of days clear of clouds
18.1%
20.1%
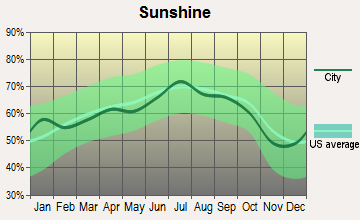
Sunshine amount - Average
69.8%
67%
Sunshine amount - Differences during a year
14%
25.7%
Sunshine amount - Maximum monthly
70%
73.8%
Sunshine amount - Minimum monthly
56%
48.2%
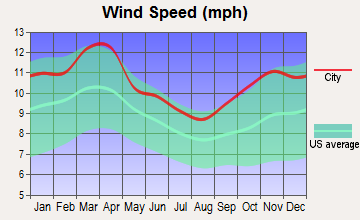
Wind speed - Average
6.9 mph
11 mph
Average climate in Charlotte, North Carolina
Average climate in Overland Park, Kansas
Air pollution
Type
AQI
CO
NO2
OZONE
PB
PM10
PM25
SO2
Year
Charlotte
Overland Park
Charlotte
Overland Park
Charlotte
Overland Park
Charlotte
Overland Park
Charlotte
Charlotte
Overland Park
Charlotte
Overland Park
Charlotte
Overland Park
2018
75
85
0.24
0.24
6.3
10.6
27.8
28.5
N/A
N/A
15.5
22.0
8.2
7.6
0.2
0.7
2017
77
87
0.25
0.23
7.0
10.7
28.0
29.0
N/A
N/A
16.3
22.5
8.8
7.4
0.2
1.0
2016
82
80
0.25
0.26
7.6
11.5
28.7
27.6
N/A
N/A
N/A
22.2
8.4
7.5
0.2
1.2
2015
76
89
0.25
0.29
8.1
12.2
27.6
27.9
N/A
N/A
N/A
33.6
8.6
9.3
0.2
3.0
2014
76
88
0.26
0.27
8.5
12.3
26.3
28.4
N/A
N/A
N/A
28.5
9.3
10.4
0.3
3.3
2013
71
83
0.29
0.42
8.4
12.5
25.5
30.1
N/A
N/A
N/A
30.8
8.6
10.5
0.3
3.8
2012
95
97
0.28
0.52
8.7
13.2
27.3
32.4
N/A
N/A
N/A
N/A
9.7
10.9
0.3
4.7
2011
94
97
0.34
0.45
10.1
14.0
28.9
30.2
N/A
N/A
N/A
N/A
11.2
11.3
0.6
4.2
2010
97
89
0.33
0.40
11.8
14.1
28.0
28.9
N/A
N/A
N/A
N/A
11.6
11.3
1.0
5.3
2009
82
87
0.30
0.29
10.0
13.5
25.4
27.9
N/A
N/A
N/A
N/A
11.1
9.8
0.9
5.4
2008
102
86
0.32
0.40
11.2
17.1
27.6
26.9
N/A
N/A
N/A
N/A
13.0
11.3
2.1
4.9
2007
108
92
0.37
0.42
13.9
15.9
29.1
27.8
0.001
N/A
N/A
N/A
14.5
13.1
3.0
4.2
2006
107
93
0.44
0.38
13.9
16.7
27.3
30.0
0.000
N/A
N/A
N/A
14.8
12.4
3.3
4.8
2005
109
105
0.53
0.54
14.6
17.9
30.6
29.4
0.000
N/A
N/A
N/A
15.2
N/A
2.7
4.4
2004
89
81
0.53
0.47
14.6
16.3
28.9
27.1
0.001
N/A
N/A
N/A
N/A
N/A
2.8
4.1
2003
85
95
0.57
0.43
15.6
16.8
27.6
28.2
0.003
N/A
N/A
N/A
N/A
N/A
3.0
4.0
2002
103
91
0.63
0.52
15.3
15.7
32.6
26.7
0.003
N/A
N/A
N/A
N/A
N/A
2.7
2.7
2001
108
85
0.72
0.53
17.5
16.0
32.3
26.5
0.005
N/A
N/A
N/A
N/A
N/A
3.9
1.4
2000
107
97
0.79
0.80
18.0
14.9
32.6
27.9
0.014
N/A
N/A
N/A
N/A
N/A
4.4
2.1
Natural disasters
Type
Charlotte
Overland Park
Tornado activity compared to U.S. average
111.5%
201.8%
Earthquake activity compared to U.S. average
79%
619%
Natural disasters compared to U.S. average
9%
10%
Transportation
Charlotte's transportation system provides buses, light rail, and streetcar services, making commuting easier for residents. Overland Park also offers a range of public transportation options, including bus services, though many residents rely on cars in this suburban city.
Transport
Type
Charlotte
Overland Park
Amtrak stations
1
0
Amtrak stations nearby
2
3
FAA registered aircraft
439
201
FAA registered aircraft manufacturers and dealers
12
9
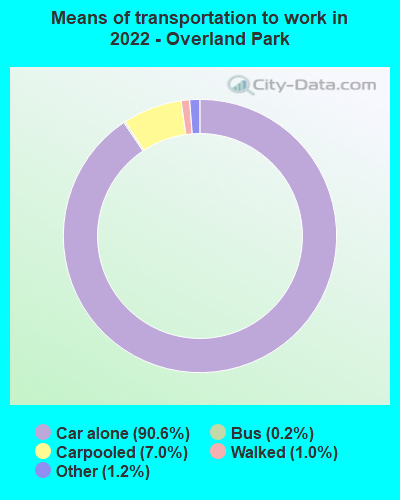
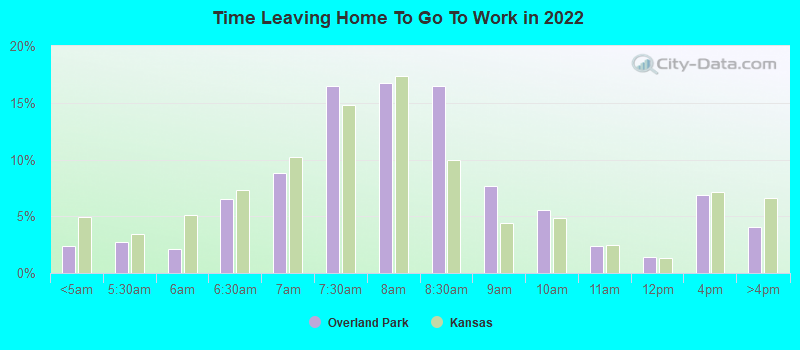
Means of transportation to work
Type
Charlotte
Overland Park
Bicycle
0.1%
0.2%
Bus
1.2%
0.5%
Carpooled
8.7%
5.6%
Car alone
86.2%
90.5%
Railroad
0.4%
0%
Taxicab
0.2%
0%
Walked
1.5%
1.9%
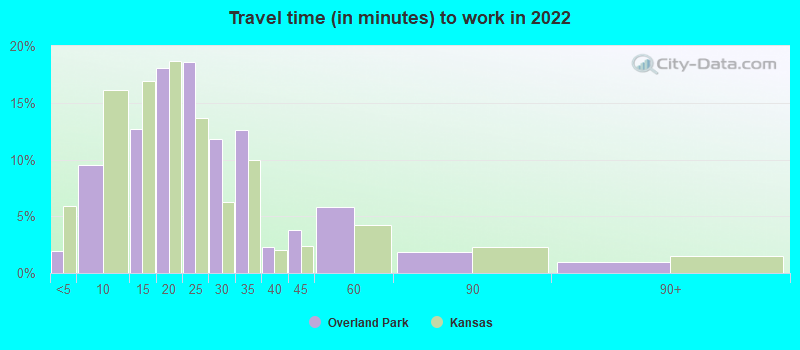
Average travel time to work
Type
Charlotte
Overland Park
Average
29.6 min
23.5 min
Other means
24.9 min
20.4 min
Public transportation
44.1 min
33.8 min
Private vehicle occupancy
Type
Charlotte
Overland Park
Average
1.2
1.1
Drove alone
90%
93.1%
In 2 person carpool
6.9%
5.3%
In 3 person carpool
1.8%
1%
In 4 person carpool
0.8%
0.2%
In 5-6 person carpool
0.5%
0.1%
In 7+ person carpool
0.1%
0.2%
How many people usually rode to work in the car, truck or van.
Real Estate
Real estate in Charlotte is diverse, with a mix of styles from charming historic homes to high-rise condominiums downtown. The city's booming economy makes real estate a popular choice for investors. Overland Park's real estate market is healthy, with a mix of single-family homes, townhouses, and apartments available for purchase.
Neighborhoods
Both cities offer diverse neighborhoods. Charlotte boasts NoDa, known for its artistic influence, Dilworth for its charming historic homes, and Uptown for those seeking an urban lifestyle. Overland Park offers family-friendly living in areas like Blue Valley, mature landscapes in neighborhoods like Nall Hills, and modern amenities in Lionsgate.
Houses and residents
Type
Charlotte
Overland Park
Houses
393,631
85,708
Average household size (people)
2.5
2.4
Median year apartment built
1998
1994
Median year house/condo built
1993
1986
Length of stay in the house since moving in
11.8 years
11.8 years
Houses occupied
365,269 (92.8%)
82,593 (96.4%)
Houses occupied by owners
193,930 (53.1%)
50,359 (61%)
Houses occupied by renters
171,339 (46.9%)
32,234 (39%)
Median rent asked for vacant for-rent units
$1,482
$2,193
Median monthly housing costs
$1,302
$1,378
Median price asked for vacant for-sale houses and condos
$445,491
$298,188
Estimated median house or condo value
$321,400
$352,000
Median numbers of rooms
5.3
6.2
Median number of rooms in apartments
4
3.7
Median number of rooms in houses and condos
6.6
7.9
Median house price - detached houses
$388,029
$369,400
Median house price - in 2-unit structures
$184,325
$192,477
Median house price - in 3-to-4-unit structures
$178,624
$187,166
Median house price - in 5 or more unit structures
$433,957
$237,623
Median house price - mobile homes
$52,977
$162,267
Median house price - Townhouses or other attached units
$296,370
$246,600
Median house price - All housing units
$378,423
$355,351
Median house age
26
32
Renting percentage
42.6%
34.8%
Housing density (houses/condos per square mile)
1,624.8
1,510.3
House value disparities
33.3%
28.5%
Household income disparities
44.1%
40.2%
Median household income for houses/condes with a mortgage
$105,905
$137,694
Median household income for apartments without a mortgage
$70,681
$88,940
Housing units without a mortgage
3,089 (2.1%)
641 (1.9%)
Housing units with both a second mortgage and home equity loan
10,553 (7.2%)
3,500 (10.3%)
Housing units with a mortgage
142,912 (97.9%)
33,381 (98.1%)
Housing units with a home equity loan
171 (0.1%)
134 (0.4%)
Housing units with a second mortgage
13,532 (9.3%)
3,937 (11.6%)
House/condo owner moved in on average (years ago)
9
9
House/condo renter moved in on average (years ago)
1
1
Housing units lacking complete kitchen facilities
0.8%
1.1%
Housing units lacking complete plumbing facilities
0.2%
0.1%
Housing units in structures
Housing units in structures
Charlotte
Overland Park
One, detached
52.7%
56.8%
One, attached
9.1%
7.6%
Two
0.9%
1.4%
3 or 4
2.9%
8.1%
5 to 9
7.1%
10.7%
10 to 19
9.5%
5.7%
20 to 49
6.2%
2.6%
50 or more
10.3%
6.5%
Mobile homes
1.4%
0.5%
Median real estate property taxes paid for housing units
Self-employed workers in own not incorporated business
25,780
6,111
State government workers
16,519
4,203
Unpaid family workers
1,214
0
Industries and Occupations
Charlotte has a notable presence of the finance sector but is also seeing significant growth in health care, professional and business services, and retail trade. Overland Park holds a strong position in the telecommunication industry, apart from health care and retail.
Both cities offer high-quality health care, with Charlotte hosting several large hospitals and health care systems, such as Atrium Health and Novant Health. Overland Park's main health care providers include AdventHealth Shawnee Mission and Overland Park Regional Medical Center.
Health (county statistics)
Type
Charlotte
Overland Park
General health status score of residents in this county from 1 (poor) to 5 (excellent)
Charlotte is known for its skyline filled with modern skyscrapers, a testament to its robust infrastructure. Overland Park, on the other hand, has more of a suburban feel but is not lacking when it comes to infrastructure. Both cities have excellent infrastructure in terms of utilities, transportation, and public services.
HMDA - Conventional home purchase loans - Applications denied
Year
Charlotte
Overland Park
1999
3,049
257
2000
1,568
142
2001
1,382
106
2002
1,275
122
2003
1,879
292
2004
2,415
394
2005
3,078
425
2006
3,864
380
2007
3,106
265
2008
1,287
140
2009
617
78
Culture and Food
Charlotte offers a vibrant scene, from museums and performances to culinary delights. Known as a foodie city, its restaurant scene caters to all tastes. Overland Park offers a quieter cultural feel, with an emphasis on family-friendly activities and a food scene that satisfies all palates.
Sports Teams
Sports enthusiasts will love Charlotte, which is home to the Carolina Panthers (NFL), Charlotte Hornets (NBA), and Charlotte FC (MLS). Overland Park doesn't host any major league sports teams, but the nearby Kansas City hosts the Chiefs (NFL) and Royals (MLB).


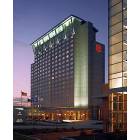

 Charlotte, NC
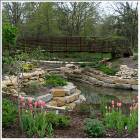
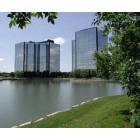
 Overland Park, KS