Charlotte, NC and Rochester, NY, both have unique offerings that can appeal to individuals seeking to relocate or just visit. Both cities offer a blend of cultural, economic, and residential experiences, but each comes with its own set of characteristics. Factors like weather, cost of living, educational opportunities, work and economic conditions, and recreational options can all be deciding factors when considering a move or visit. This comparison assesses all these aspects and more to offer a comprehensive perspective.
Distance between
Charlotte, NC and
Rochester, NY : 576.1 miles
Charlotte's population is larger by 318%. Its population has grown by 338,881 people (62.7%) since 2000. The population of Rochester has decreased by 9,167 people (4.2%) during that time.
Regarding crime and safety, both cities have their challenges. According to the FBI's latest crime report, Charlotte has a higher rate of property crimes compared to Rochester. However, Rochester's violent crime rate is relatively higher. Charlotte is making strides in its fight against crime with a significant increase in law enforcement personnel. Rochester, on the other hand, is doubling down on community-based policing strategies.
Cost of Living
The cost of living in Charlotte is slightly lower than Rochester. While household expenses, groceries, utilities, and transportation are fairly similar, housing costs in Charlotte are significantly less, making Charlotte a more economical choice.
Income Tax
For income tax, North Carolina has a flat rate of 5.25% regardless of income, whereas New York operates a graduated system with rates up to 8.82% for higher income brackets.
Property Tax
Property taxes are higher in Rochester, with an average rate of 3.66% compared to Charlotte's more moderate 0.83%.
Sales Tax
Sales tax in Charlotte, NC amounts to 7.25%, whereas Rochester, NY stands notably higher at 8%. This difference can cause a significant effect on overall expenses for residents and visitors.
Income
Type
Charlotte
Rochester
Estimated median household income
$70,869
$41,980
Estimated per capita income
$44,593
$26,950
Cost of living index (U.S. average is 100)
93.2
102.1
If you make $50,000 in Charlotte, you will have to make $54,775 in Rochester to maintain the same standard of living.
Geographical Conditions
Situated near the Appalachian Mountains, Charlotte offers opportunities for outdoor activities like hiking and camping. Rochester, near the shores of Lake Ontario, also provides avenues for outdoor entertainment like boating and fishing.
When it comes to educational opportunities; both cities have reputable institutions. Rochester is notable for its excellent college-preparatory schools and world-renown higher learning institutions like the University of Rochester and Rochester Institute of Technology (RIT). Charlotte also offers a variety of high-ranking public, private, and charter schools, and houses top-rated universities such as the University of North Carolina Charlotte (UNCC).
The economy of both cities differ significantly. Charlotte, home to multiple Fortune 500 companies, is a major commercial hub in the finance sector with Bank of America and Wells Fargo as top employers. Rochester, once a boomtown due to Kodak, Xerox, and Bausch + Lomb, has shifted focus towards healthcare and education.
Biggest Employers
Charlotte's biggest employers include Bank of America, Wells Fargo, and Atrium Health. In contrast, Rochester's largest employers are the University of Rochester Medical Center and Rochester Regional Health.
In Charlotte (Mecklenburg County), 60.8% voted for Democrats and 38.3% for Republicans in 2012 Presidential Election. In Rochester (Monroe County), 58.2% voted for Democrats and 40.1% for Republicans.
Elections
Type
Democrats
Republicans
Other
Year
Charlotte
Rochester
Charlotte
Rochester
Charlotte
Rochester
2020
66.8%
59.5%
31.6%
38.4%
1.6%
2.2%
2016
62.3%
54.3%
32.9%
39.3%
4.8%
6.5%
2012
60.8%
58.2%
38.3%
40.1%
0.9%
1.7%
2008
62.0%
58.4%
37.6%
40.6%
0.5%
1.0%
2004
51.7%
50.7%
48.0%
47.8%
0.3%
1.5%
2000
48.4%
51.0%
51.1%
44.5%
0.5%
4.5%
1996
48.6%
53.2%
45.9%
37.3%
5.5%
9.5%
Breakdown of population affiliated with a religious congregation
Type
Adherents
Congregations
Religion
Charlotte
Rochester
Charlotte
Rochester
SOUTHERN BAPTIST CONVENTION
9.0%
0.1%
19.0%
2.1%
CATHOLIC CHURCH
8.5%
25.7%
1.8%
11.2%
AMERICAN BAPTIST CHURCHES IN THE USA
2.3%
1.6%
1.1%
5.1%
EPISCOPAL CHURCH
1.2%
0.7%
1.3%
3.5%
EVANGELICAL LUTHERAN CHURCH IN AMERICA
0.9%
1.1%
1.8%
3.3%
PRESBYTERIAN CHURCH IN AMERICA
0.6%
0.0%
1.9%
0.2%
SEVENTH DAY ADVENTIST CHURCH
0.5%
0.2%
1.5%
1.4%
LUTHERAN CHURCH
0.3%
1.0%
0.9%
1.9%
MUSLIM ESTIMATE
0.3%
1.2%
1.2%
1.1%
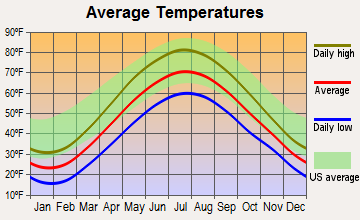
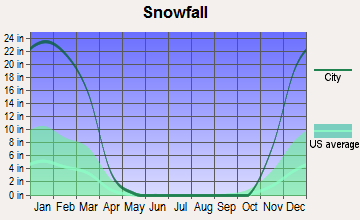
Weather
Weatherwise, Charlotte boasts a milder and more pleasant climate than Rochester. Charlotte enjoys warm, humid summers and mild winters, while Rochester has cold, snowy winters due to its proximity to the Great Lakes, which could be a deciding factor for those sensitive to colder climates.
Weather and climate
Type
Charlotte
Rochester
Temperature - Average
61°F
47.6°F
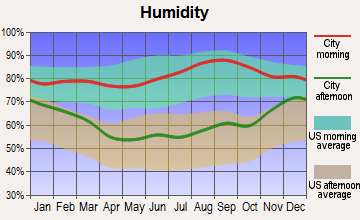
Humidity - Average morning or afternoon humidity
72.3%
76.5%
Humidity - Differences between morning and afternoon humidity
41%
34%
Humidity - Maximum monthly morning or afternoon humidity
87%
87%
Humidity - Minimum monthly morning or afternoon humidity
46%
53%
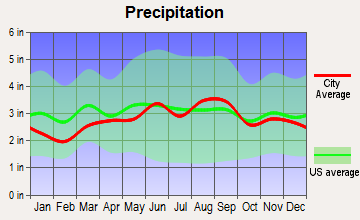
Precipitation - Yearly average
44.5 in
33.7 in
Snowfall - Yearly average
10.2 in
178.7 in
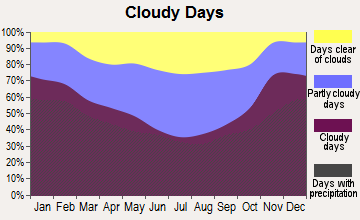
Clouds - Number of days clear of clouds
18.1%
10.2%
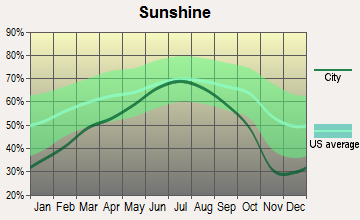
Sunshine amount - Average
69.8%
52.1%
Sunshine amount - Differences during a year
14%
43%
Sunshine amount - Maximum monthly
70%
67%
Sunshine amount - Minimum monthly
56%
24%
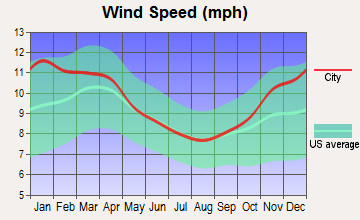
Wind speed - Average
6.9 mph
9.7 mph
Average climate in Charlotte, North Carolina
Average climate in Rochester, New York
Air pollution
Type
AQI
CO
NO2
OZONE
PB
PM10
PM25
SO2
Year
Charlotte
Rochester
Charlotte
Rochester
Charlotte
Rochester
Charlotte
Rochester
Charlotte
Charlotte
Charlotte
Rochester
Charlotte
Rochester
2018
75
65
0.24
0.24
6.3
N/A
27.8
27.4
N/A
N/A
15.5
N/A
8.2
6.1
0.2
0.2
2017
77
67
0.25
0.23
7.0
N/A
28.0
29.3
N/A
N/A
16.3
N/A
8.8
6.2
0.2
0.5
2016
82
67
0.25
0.21
7.6
N/A
28.7
28.1
N/A
N/A
N/A
N/A
8.4
6.1
0.2
0.7
2015
76
65
0.25
0.21
8.1
N/A
27.6
26.4
N/A
N/A
N/A
N/A
8.6
7.1
0.2
0.8
2014
76
62
0.26
0.20
8.5
N/A
26.3
26.8
N/A
N/A
N/A
N/A
9.3
6.8
0.3
1.0
2013
71
64
0.29
0.20
8.4
N/A
25.5
27.5
N/A
N/A
N/A
N/A
8.6
7.7
0.3
0.9
2012
95
73
0.28
0.21
8.7
N/A
27.3
27.9
N/A
N/A
N/A
N/A
9.7
6.8
0.3
1.0
2011
94
67
0.34
0.19
10.1
8.1
28.9
27.2
N/A
N/A
N/A
N/A
11.2
6.8
0.6
1.1
2010
97
74
0.33
0.43
11.8
N/A
28.0
27.7
N/A
N/A
N/A
N/A
11.6
7.3
1.0
2.2
2009
82
64
0.30
0.42
10.0
N/A
25.4
24.4
N/A
N/A
N/A
N/A
11.1
6.9
0.9
2.5
2008
102
83
0.32
0.38
11.2
N/A
27.6
26.6
N/A
N/A
N/A
N/A
13.0
8.5
2.1
2.9
2007
108
86
0.37
0.42
13.9
N/A
29.1
25.6
0.001
N/A
N/A
N/A
14.5
9.2
3.0
4.1
2006
107
58
0.44
0.49
13.9
N/A
27.3
23.6
0.000
N/A
N/A
N/A
14.8
N/A
3.3
4.2
2005
109
67
0.53
0.46
14.6
N/A
30.6
23.5
0.000
N/A
N/A
N/A
15.2
N/A
2.7
4.2
2004
89
43
0.53
0.48
14.6
N/A
28.9
21.6
0.001
N/A
N/A
N/A
N/A
N/A
2.8
5.1
2003
85
66
0.57
0.49
15.6
N/A
27.6
24.9
0.003
N/A
N/A
N/A
N/A
N/A
3.0
5.4
2002
103
84
0.63
0.43
15.3
N/A
32.6
27.7
0.003
N/A
N/A
N/A
N/A
N/A
2.7
5.2
2001
108
70
0.72
0.42
17.5
N/A
32.3
25.7
0.005
N/A
N/A
N/A
N/A
N/A
3.9
7.6
2000
107
62
0.79
0.42
18.0
N/A
32.6
23.3
0.014
N/A
N/A
N/A
N/A
N/A
4.4
5.7
Natural disasters
Type
Charlotte
Rochester
Tornado activity compared to U.S. average
111.5%
17.1%
Earthquake activity compared to U.S. average
79%
31.8%
Natural disasters compared to U.S. average
9%
17%
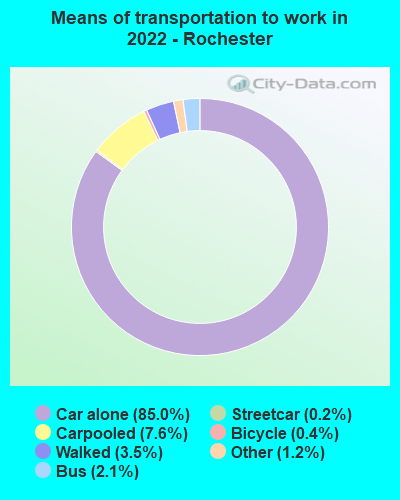
Transportation
Both cities have robust transportation systems. Charlotte has a light rail system, bus services, and an international airport. Rochester offers bus services, an international airport, and easy access to major freeways and Amtrak services.
Transport
Type
Charlotte
Rochester
Amtrak stations
1
1
Amtrak stations nearby
2
1
FAA registered aircraft
439
151
FAA registered aircraft manufacturers and dealers
12
1
Means of transportation to work
Type
Charlotte
Rochester
Bicycle
0.1%
0.7%
Bus
1.2%
2.9%
Carpooled
8.7%
10%
Car alone
86.2%
81.8%
Motorcycle
0.1%
0.1%
Railroad
0.4%
0%
Streetcar
0%
0.2%
Taxicab
0.2%
0.3%
Walked
1.5%
2.8%
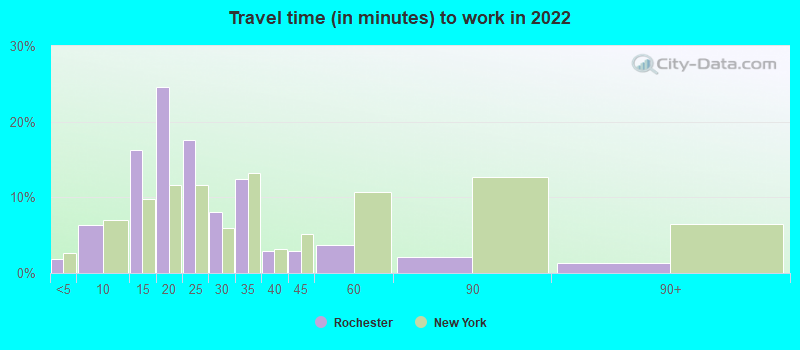
Average travel time to work
Type
Charlotte
Rochester
Average
29.6 min
22.3 min
Other means
24.9 min
18.9 min
Public transportation
44.1 min
38.9 min
Private vehicle occupancy
Type
Charlotte
Rochester
Average
1.2
1.2
Drove alone
90%
85.7%
In 2 person carpool
6.9%
11%
In 3 person carpool
1.8%
1.5%
In 4 person carpool
0.8%
1.2%
In 5-6 person carpool
0.5%
0.4%
In 7+ person carpool
0.1%
0.2%
How many people usually rode to work in the car, truck or van.
Real Estate
The real estate market in Charlotte has seen rapid growth, with a greater demand for housing due to the city's population growth. On the other hand, Rochester's market is more stable, with a slower growth rate.
Neighborhoods
Charlotte is known for its vibrant neighborhoods like Dilworth and South End, popular for their suburban yet urban feel. Rochester boasts Park Avenue, known for its eclectic mix of cafes, shops, and charming homes.
Houses and residents
Type
Charlotte
Rochester
Houses
393,631
103,333
Average household size (people)
2.5
2.3
Median year apartment built
1998
1945
Length of stay in the house since moving in
11.8 years
15.3 years
Houses occupied
365,269 (92.8%)
93,263 (90.3%)
Houses occupied by owners
193,930 (53.1%)
38,125 (40.9%)
Houses occupied by renters
171,339 (46.9%)
55,138 (59.1%)
Median rent asked for vacant for-rent units
$1,482
$630.70
Median monthly housing costs
$1,302
$881
Median price asked for vacant for-sale houses and condos
$445,491
$160,052
Estimated median house or condo value
$321,400
$109,700
Median numbers of rooms
5.3
5.2
Median number of rooms in apartments
4
4.1
Median number of rooms in houses and condos
6.6
6.3
Median house price - detached houses
$388,029
$130,415
Median house price - in 2-unit structures
$184,325
$173,805
Median house price - in 3-to-4-unit structures
$178,624
$340,804
Median house price - in 5 or more unit structures
$433,957
$428,520
Median house price - mobile homes
$52,977
$28,854
Median house price - Townhouses or other attached units
$296,370
$183,602
Median house price - All housing units
$378,423
$148,505
Median house age
26
2,021
Renting percentage
42.6%
62.3%
Housing density (houses/condos per square mile)
1,624.8
2,883.6
House value disparities
33.3%
40.7%
Household income disparities
44.1%
48.9%
Median household income for houses/condes with a mortgage
$105,905
$69,171
Median household income for apartments without a mortgage
$70,681
$52,361
Housing units without a mortgage
3,089 (2.1%)
1,391 (5.4%)
Housing units with both a second mortgage and home equity loan
10,553 (7.2%)
3,040 (11.8%)
Housing units with a mortgage
142,912 (97.9%)
24,344 (94.6%)
Housing units with a home equity loan
171 (0.1%)
99 (0.4%)
Housing units with a second mortgage
13,532 (9.3%)
3,389 (13.2%)
House/condo owner moved in on average (years ago)
9
15
House/condo renter moved in on average (years ago)
1
3
Housing units lacking complete kitchen facilities
0.8%
1.8%
Housing units lacking complete plumbing facilities
0.2%
1.1%
Housing units in structures
Housing units in structures
Charlotte
Rochester
One, detached
52.7%
47.7%
One, attached
9.1%
5.8%
Two
0.9%
17.4%
3 or 4
2.9%
8.0%
5 to 9
7.1%
5.0%
10 to 19
9.5%
2.7%
20 to 49
6.2%
4.4%
50 or more
10.3%
8.7%
Mobile homes
1.4%
0.3%
Median real estate property taxes paid for housing units
Self-employed workers in own not incorporated business
25,780
4,711
State government workers
16,519
2,362
Unpaid family workers
1,214
427
Industries and Occupations
Key industries in Charlotte include banking and finance, energy, and health care. In Rochester, healthcare, education, and manufacturing lead the way. Both cities have seen growth in the tech industry.
Both cities boast excellent healthcare facilities. Charlotte's Atrium Health and Novant Health systems and Rochester's University of Rochester Medical Center and Rochester Regional Health are nationally recognized.
Health (county statistics)
Type
Charlotte
Rochester
General health status score of residents in this county from 1 (poor) to 5 (excellent)
Regarding infrastructure, Charlotte has more to offer with its rapidly growing metropolitan area, including a modernized downtown, expanded light rail system, and an international airport. Rochester, while smaller, retains significant historical charm with updated waterfront development.
Infrastructure
Type
Charlotte
Rochester
Hospitals
37
14
TV stations
16
13
Arenas or stadiums
3
2
Bank branches located here
202
106
Bank institutions located here
26
15
Main business address for public companies
33
14
Nuclear power plants
0
1
Nuclear power plants nearby
2
1
Drinking water stations with no reported violations in the past
24
2
Drinking water stations with reported violations in the past
HMDA - Conventional home purchase loans - Applications denied
Year
Charlotte
Rochester
1999
3,049
374
2000
1,568
555
2001
1,382
427
2002
1,275
356
2003
1,879
388
2004
2,415
476
2005
3,078
704
2006
3,864
872
2007
3,106
739
2008
1,287
319
2009
617
101
Culture and Food
Both cities have active cultural scenes. Charlotte is known for its bustling nightlife, NASCAR Hall of Fame, and tasty southern cuisine while Rochester has a rich history, flourishing arts scene, and famous dishes like the "Garbage Plate."
Sports Teams
Sports enthusiasts will find Charlotte appealing with its NFL (Carolina Panthers) and NBA (Charlotte Hornets) teams. Rochester does not have major league teams but offers minor league baseball, hockey, and soccer.


 Charlotte, NC
 Rochester, NY