Charlotte, North Carolina, and Tallahassee, Florida, are two significant cities in the Southeastern United States, each with unique characteristics. Each has its own charm and draw, with Charlotte being a significant business and financial center and Tallahassee, the capital city of Florida, offering plentiful opportunities in government and education. You'll find contrasts in their climates, economy, cost of living, and cultural attributes. This comprehensive comparison examines the major considerations for anyone planning to relocate or visit either city.
Distance between
Charlotte, NC and
Tallahassee, FL : 384.5 miles
Charlotte's population is larger by 346%. Its population has grown by 338,881 people (62.7%) since 2000. The population of Tallahassee has grown by 46,478 people (30.9%) during that time.
The crime rate in both Charlotte and Tallahassee is higher than the national average. However, like most cities, the crime rates vary by neighborhood. Charlotte is continually working on improving public safety and has a dedicated department to address community concerns regarding safety. Tallahassee, while generally safe for tourists in key areas, has struggled with higher crime rates, particularly violent crime, in recent years.
Cost of Living
The cost of living in Charlotte is slightly higher than in Tallahassee. Housing is one of the primary drivers of the cost of living difference. However, the average income in Charlotte is also higher, to some extent cancelling out the increased living expenses.
Income Tax
Florida, including Tallahassee, has no state income tax. North Carolina does apply a state income tax, which affects Charlotte residents.
Property Tax
Property tax rates diverge significantly. Charlotte has a higher rate than Tallahassee, and North Carolina's property taxes are generally higher than in Florida.
Sales Tax
North Carolina's state sales tax is higher than Florida's. However, Charlotte imposes additional local sales taxes. In contrast, Tallahassee has no city sales tax. Florida also has no state income tax, giving it an edge for those looking to maximize earnings.
Income
Type
Charlotte
Tallahassee
Estimated median household income
$70,869
$51,224
Estimated per capita income
$44,593
$32,181
Cost of living index (U.S. average is 100)
93.2
89.6
If you make $50,000 in Tallahassee, you will have to make $52,009 in Charlotte to maintain the same standard of living.
Geographical Conditions
Charlotte is located within the Piedmont region and offers a mix of urban and outdoor recreational opportunities. Tallahassee is in the Florida Panhandle and is surrounded by wilderness areas, offering ample opportunities for outdoor activities.
Both cities have commendable educational opportunities. Charlotte is home to several highly ranked universities, and the public school system is significant. Tallahassee hosts Florida State University and Florida A&M, two well-regarded public universities. The city is also known for its efforts in improving access to quality public education.
Charlotte's economy is driven by the financial sector, with Bank of America's headquarters and substantial portions of Wells Fargo. Tallahassee's economy revolves around state government, education, and health care. Both cities have robust small business communities, which contribute greatly to their respective economies.
Biggest Employers
In Charlotte, the biggest employers include Bank of America, Carolinas Healthcare System, and Wells Fargo. Tallahassee's major employers are the State of Florida, Florida State University, and Tallahassee Memorial Healthcare.
In Charlotte (Mecklenburg County), 60.8% voted for Democrats and 38.3% for Republicans in 2012 Presidential Election. In Tallahassee (Leon County), 61.5% voted for Democrats and 37.8% for Republicans.
Elections
Type
Democrats
Republicans
Other
Year
Charlotte
Tallahassee
Charlotte
Tallahassee
Charlotte
Tallahassee
2020
66.8%
63.6%
31.6%
35.3%
1.6%
1.2%
2016
62.3%
60.0%
32.9%
35.1%
4.8%
4.9%
2012
60.8%
61.5%
38.3%
37.8%
0.9%
0.8%
2008
62.0%
62.0%
37.6%
37.7%
0.5%
0.3%
2004
51.7%
61.7%
48.0%
38.0%
0.3%
0.4%
2000
48.4%
59.6%
51.1%
37.9%
0.5%
2.5%
1996
48.6%
54.6%
45.9%
37.0%
5.5%
8.4%
Breakdown of population affiliated with a religious congregation
Type
Adherents
Congregations
Religion
Charlotte
Tallahassee
Charlotte
Tallahassee
SOUTHERN BAPTIST CONVENTION
9.0%
10.9%
19.0%
16.4%
CATHOLIC CHURCH
8.5%
5.7%
1.8%
0.4%
AMERICAN BAPTIST CHURCHES IN THE USA
2.3%
0.0%
1.1%
0.0%
EPISCOPAL CHURCH
1.2%
0.8%
1.3%
2.6%
EVANGELICAL LUTHERAN CHURCH IN AMERICA
0.9%
0.3%
1.8%
0.7%
PRESBYTERIAN CHURCH IN AMERICA
0.6%
0.7%
1.9%
1.8%
SEVENTH DAY ADVENTIST CHURCH
0.5%
0.3%
1.5%
1.5%
MUSLIM ESTIMATE
0.3%
1.2%
1.2%
1.1%
INTERNA PENTECO HOLINESS CHURCH
0.1%
0.5%
0.5%
3.3%
Weather
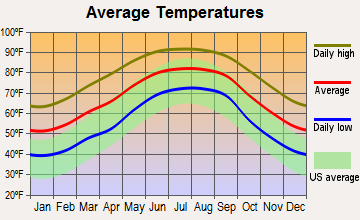
Charlotte has a temperate climate with all four seasons, although winters are relatively mild. Summers can be hot and humid. On the other hand, Tallahassee experiences a subtropical climate with long, hot summers and short, mild winters. Those who love sunshine and warmer weather throughout the year might favor Tallahassee.
Weather and climate
Type
Charlotte
Tallahassee
Temperature - Average
61°F
67.8°F
Humidity - Average morning or afternoon humidity
72.3%
77.2%
Humidity - Differences between morning and afternoon humidity
41%
45%
Humidity - Maximum monthly morning or afternoon humidity
87%
92%
Humidity - Minimum monthly morning or afternoon humidity
46%
47%
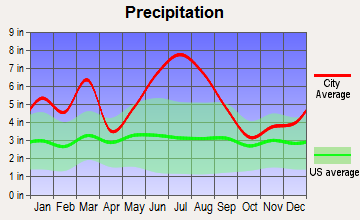
Precipitation - Yearly average
44.5 in
61.9 in
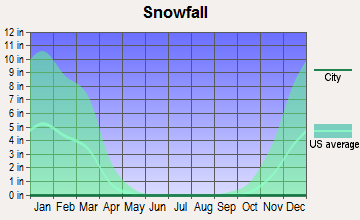
Snowfall - Yearly average
10.2 in
0.2 in
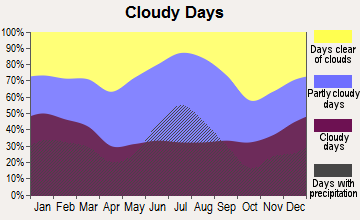
Clouds - Number of days clear of clouds
18.1%
16.9%
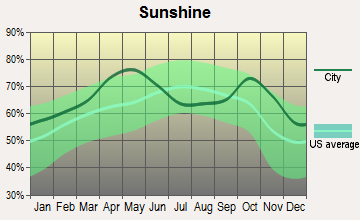
Sunshine amount - Average
69.8%
68.2%
Sunshine amount - Differences during a year
14%
16.6%
Sunshine amount - Maximum monthly
70%
71.3%
Sunshine amount - Minimum monthly
56%
54.7%
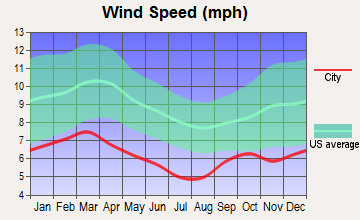
Wind speed - Average
6.9 mph
5.9 mph
Average climate in Charlotte, North Carolina
Average climate in Tallahassee, Florida
Air pollution
Type
AQI
CO
NO2
OZONE
PB
PM10
PM25
SO2
Year
Charlotte
Tallahassee
Charlotte
Charlotte
Charlotte
Tallahassee
Charlotte
Charlotte
Tallahassee
Charlotte
Tallahassee
Charlotte
2018
75
68
0.24
N/A
6.3
N/A
27.8
22.6
N/A
N/A
15.5
N/A
8.2
9.0
0.2
N/A
2017
77
75
0.25
N/A
7.0
N/A
28.0
23.1
N/A
N/A
16.3
N/A
8.8
10.2
0.2
N/A
2016
82
64
0.25
N/A
7.6
N/A
28.7
24.2
N/A
N/A
N/A
N/A
8.4
9.3
0.2
N/A
2015
76
67
0.25
N/A
8.1
N/A
27.6
22.0
N/A
N/A
N/A
N/A
8.6
9.9
0.2
N/A
2014
76
72
0.26
N/A
8.5
N/A
26.3
22.4
N/A
N/A
N/A
N/A
9.3
10.4
0.3
N/A
2013
71
91
0.29
N/A
8.4
N/A
25.5
23.1
N/A
N/A
N/A
N/A
8.6
7.9
0.3
N/A
2012
95
81
0.28
N/A
8.7
N/A
27.3
23.9
N/A
N/A
N/A
N/A
9.7
8.8
0.3
N/A
2011
94
97
0.34
N/A
10.1
N/A
28.9
25.4
N/A
N/A
N/A
N/A
11.2
11.6
0.6
N/A
2010
97
88
0.33
N/A
11.8
N/A
28.0
23.1
N/A
N/A
N/A
N/A
11.6
11.5
1.0
N/A
2009
82
95
0.30
N/A
10.0
N/A
25.4
22.0
N/A
N/A
N/A
N/A
11.1
11.5
0.9
N/A
2008
102
100
0.32
N/A
11.2
N/A
27.6
23.4
N/A
N/A
N/A
N/A
13.0
13.1
2.1
N/A
2007
108
121
0.37
N/A
13.9
N/A
29.1
25.5
0.001
N/A
N/A
N/A
14.5
15.6
3.0
N/A
2006
107
96
0.44
N/A
13.9
N/A
27.3
24.5
0.000
N/A
N/A
N/A
14.8
14.5
3.3
N/A
2005
109
108
0.53
N/A
14.6
N/A
30.6
23.7
0.000
N/A
N/A
N/A
15.2
15.0
2.7
N/A
2004
89
113
0.53
N/A
14.6
N/A
28.9
22.6
0.001
N/A
N/A
N/A
N/A
13.9
2.8
N/A
2003
85
80
0.57
N/A
15.6
N/A
27.6
20.5
0.003
N/A
N/A
16.4
N/A
N/A
3.0
N/A
2002
103
64
0.63
N/A
15.3
N/A
32.6
21.7
0.003
N/A
N/A
15.2
N/A
N/A
2.7
N/A
2001
108
76
0.72
N/A
17.5
N/A
32.3
22.3
0.005
N/A
N/A
17.7
N/A
N/A
3.9
N/A
2000
107
84
0.79
N/A
18.0
N/A
32.6
26.1
0.014
N/A
N/A
17.7
N/A
N/A
4.4
N/A
Natural disasters
Type
Charlotte
Tallahassee
Tornado activity compared to U.S. average
111.5%
104.3%
Earthquake activity compared to U.S. average
79%
26.2%
Natural disasters compared to U.S. average
9%
19%
Transportation
Charlotte has more extensive public transit, including a light rail system. Commuting can be challenging during peak hours. Tallahassee, meanwhile, relies mainly on bus systems and cars, with less traffic congestion due to its smaller population.
Transport
Type
Charlotte
Tallahassee
Amtrak stations
1
1
Amtrak stations nearby
2
1
FAA registered aircraft
439
282
FAA registered aircraft manufacturers and dealers
12
5
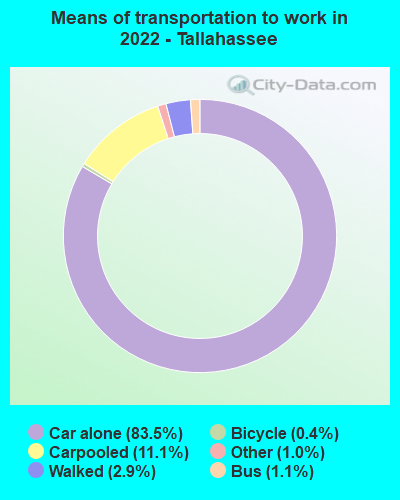
Means of transportation to work
Type
Charlotte
Tallahassee
Bicycle
0.1%
0.6%
Bus
1.2%
0.9%
Carpooled
8.7%
8.1%
Car alone
86.2%
87.9%
Motorcycle
0.1%
0.1%
Railroad
0.4%
0%
Taxicab
0.2%
0.1%
Walked
1.5%
0.9%
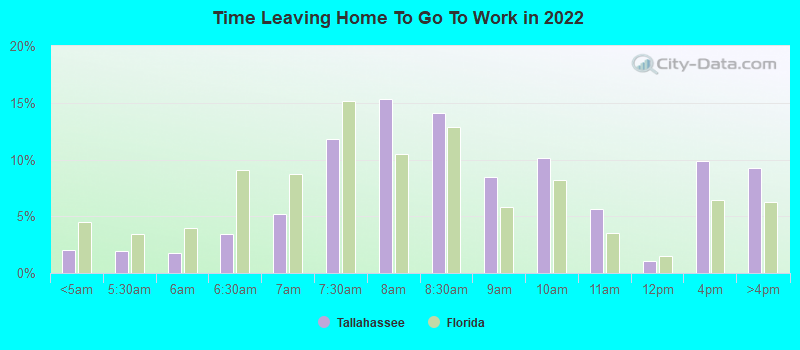
Average travel time to work
Type
Charlotte
Tallahassee
Average
29.6 min
23.7 min
Other means
24.9 min
19.6 min
Public transportation
44.1 min
40.1 min
Private vehicle occupancy
Type
Charlotte
Tallahassee
Average
1.2
1.1
Drove alone
90%
90.7%
In 2 person carpool
6.9%
8.8%
In 3 person carpool
1.8%
0.3%
In 4 person carpool
0.8%
0.1%
In 5-6 person carpool
0.5%
0%
How many people usually rode to work in the car, truck or van.
Real Estate
Real Estate in Charlotte tends to be pricier than in Tallahassee, reflecting the overall cost of living. Charlotte's market is highly active, with new developments continually cropping up. Tallahassee offers more affordability but with lesser pace in terms of real estate market movement.
Neighborhoods
Charlotte enjoys a wide range of neighborhoods, from the vibrant downtown area to peaceful, family-friendly suburbs. Tallahassee also offers a diverse mix, from the bustling university area to serene suburban enclaves.
Houses and residents
Type
Charlotte
Tallahassee
Houses
393,631
95,467
Average household size (people)
2.5
2.2
Median year apartment built
1998
1991
Median year house/condo built
1993
1986
Length of stay in the house since moving in
11.8 years
12.6 years
Houses occupied
365,269 (92.8%)
84,920 (89%)
Houses occupied by owners
193,930 (53.1%)
35,632 (42%)
Houses occupied by renters
171,339 (46.9%)
49,288 (58%)
Median rent asked for vacant for-rent units
$1,482
$814.11
Median monthly housing costs
$1,302
$1,133
Median price asked for vacant for-sale houses and condos
$445,491
$161,065
Estimated median house or condo value
$321,400
$246,100
Median numbers of rooms
5.3
4.8
Median number of rooms in apartments
4
4.1
Median number of rooms in houses and condos
6.6
6.1
Median house price - detached houses
$388,029
$313,346
Median house price - in 2-unit structures
$184,325
$256,168
Median house price - in 3-to-4-unit structures
$178,624
$177,829
Median house price - in 5 or more unit structures
$433,957
$218,472
Median house price - mobile homes
$52,977
$108,818
Median house price - Townhouses or other attached units
$296,370
$171,591
Median house price - All housing units
$378,423
$291,051
Median house age
26
33
Renting percentage
42.6%
58.6%
Housing density (houses/condos per square mile)
1,624.8
997.5
House value disparities
33.3%
31.2%
Household income disparities
44.1%
46.9%
Median household income for houses/condes with a mortgage
$105,905
$98,392
Median household income for apartments without a mortgage
$70,681
$59,769
Housing units without a mortgage
3,089 (2.1%)
642 (2.7%)
Housing units with both a second mortgage and home equity loan
10,553 (7.2%)
1,269 (5.3%)
Housing units with a mortgage
142,912 (97.9%)
23,331 (97.3%)
Housing units with a home equity loan
171 (0.1%)
0 (0%)
Housing units with a second mortgage
13,532 (9.3%)
1,834 (7.7%)
House/condo owner moved in on average (years ago)
9
10
House/condo renter moved in on average (years ago)
1
1
Housing units lacking complete kitchen facilities
0.8%
2.2%
Housing units lacking complete plumbing facilities
0.2%
1.7%
Housing units in structures
Housing units in structures
Charlotte
Tallahassee
One, detached
52.7%
43.2%
One, attached
9.1%
12.0%
Two
0.9%
2.3%
3 or 4
2.9%
8.1%
5 to 9
7.1%
4.9%
10 to 19
9.5%
6.9%
20 to 49
6.2%
3.0%
50 or more
10.3%
16.9%
Mobile homes
1.4%
2.7%
Median real estate property taxes paid for housing units
Self-employed workers in own not incorporated business
25,780
6,938
State government workers
16,519
23,624
Unpaid family workers
1,214
106
Industries and Occupations
Banking and Motorsports are significant industries in Charlotte. In contrast, Tallahassee is centered on government, education, and health care. Both cities have a growing tech industry and opportunities for entrepreneurs.
Charlotte's healthcare system is considered one of the best in the region, with several top-tier hospitals. While Tallahassee's health care system is smaller, it still offers a range of quality health care services, important especially to its older population.
Health (county statistics)
Type
Charlotte
Tallahassee
General health status score of residents in this county from 1 (poor) to 5 (excellent)
Charlotte has a more developed infrastructure with an international airport, an expanding light rail system, and growing downtown area. Tallahassee, while smaller, boasts a regional airport, good road networks but has less developed public transit systems.
Infrastructure
Type
Charlotte
Tallahassee
Hospitals
37
11
TV stations
16
13
Arenas or stadiums
3
3
Bank branches located here
202
94
Bank institutions located here
26
18
Main business address for public companies
33
1
Nuclear power plants nearby
2
0
Drinking water stations with no reported violations in the past
24
11
Drinking water stations with reported violations in the past
HMDA - Conventional home purchase loans - Applications denied
Year
Charlotte
Tallahassee
1999
3,049
1,133
2000
1,568
383
2001
1,382
378
2002
1,275
444
2003
1,879
421
2004
2,415
566
2005
3,078
727
2006
3,864
726
2007
3,106
426
2008
1,287
174
2009
617
101
Culture and Food
Both cities have rich cultural scenes. Charlotte has a thriving arts scene, and Southern Cuisine, with a modern twist, is popular. On the other hand, Tallahassee offers a blend of Southern and Coastal cuisines. It is also home to unique history and culture being the state capital.
Sports Teams
Charlotte is a major sports hub, home to the Carolina Panthers (NFL), Charlotte Hornets (NBA), and several minor league teams. Conversely, Tallahassee is much about college sports, with the Florida State University Seminoles being the central focus.


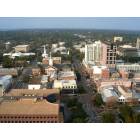


 Charlotte, NC
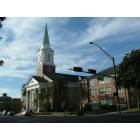
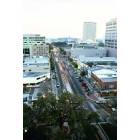
 Tallahassee, FL