Chicago, IL, and Bronx, NY, are two iconic American cities with distinctive characteristics. This comparison examines multiple factors relevant to relocation and tourism, including crime rates, weather conditions, and cultural aspects. Each city has unique offerings for both visitors and potential residents. Many factors depend on personal preference and lifestyle, making both cities appealing for different reasons.
Crime and safety are important aspects to consider when visiting or relocating to a new city. While both Chicago and the Bronx have had issues with crime, rates have generally been on a decline. The crime rate in Chicago is higher than in the Bronx, particularly regarding violent crimes. However, crime is not equally distributed across every neighborhood. Both cities have safe areas and areas with higher levels of crime. Safety precautions are recommended in unfamiliar areas or during late hours.
Cost of Living
Cost of living is another factor to consider. Overall, the cost of living in the Bronx is significantly higher than in Chicago. This extends to housing, general goods and services, and transportation. However, salaries in the Bronx also tend to be higher to account for the higher cost of living.
Income Tax
Illinois, where Chicago is located, has a flat state income tax of 4.95%. New York State has a progressive income tax rate ranging from 4% to 8.82%, depending on income level.
Property Tax
Property tax rates are another factor to consider. Chicago has a lower property tax rate averaging around 2%, while the Bronx, as part of New York City, has an average effective property tax rate of about 0.90%.
Sales Tax
The combined sales tax rate for Chicago is 10.25%, one of the highest in the country. The combined sales tax rate in the Bronx is lower at 8.875%.
Income
Type
Chicago
Bronx
Estimated median household income
$66,576
$43,011
Estimated per capita income
$43,217
$23,354
Cost of living index (U.S. average is 100)
104.8
172.8
If you make $50,000 in Chicago, you will have to make $82,443 in Bronx to maintain the same standard of living.
Geographical Conditions
Chicago is located along Lake Michigan, offering attractive waterfront vistas, while the Bronx sits along the Hudson River and East River, which can provide equally enticing waterfront views.
Geographical information
Type
Chicago
Bronx
Land area
227.1 sq. miles
42 sq. miles
Population density
11,872 people per sq. mile
32,928 people per sq. mile
Elevation
596 feet
120 feet
Relative area comparison
Chicago, IL Bronx, NY
Education
Both cities offer diverse education opportunities. Chicago has a robust public school system and numerous reputable universities including the University of Chicago. The Bronx, as part of New York City, benefits from renowned educational establishments such as Bronx Science High School and nearby universities like Columbia and New York University.
The economic landscape of both cities is dynamic and diversified. Chicago's economy is well-balanced across industries such as finance, manufacturing, printing and publishing, and food processing. The Bronx's economy is heavily influenced by service sector jobs, especially in healthcare and social assistance.
Biggest Employers
The biggest employers in Chicago include the federal and local government, Walgreens Boots Alliance, and Advocate Aurora Health. In the Bronx, Montefiore Medical Center, Bronx-Lebanon Hospital Center, and the City of New York are major employers.
In Chicago (Cook County), 74.0% voted for Democrats and 24.6% for Republicans in 2012 Presidential Election. In Bronx (Bronx County), 91.9% voted for Democrats and 8.1% for Republicans.
Elections
Type
Democrats
Republicans
Other
Year
Chicago
Bronx
Chicago
Bronx
Chicago
Bronx
2020
74.6%
83.7%
24.1%
16.0%
1.3%
0.3%
2016
74.4%
88.6%
20.9%
9.5%
4.7%
2.0%
2012
74.0%
91.9%
24.6%
8.1%
1.4%
0.0%
2008
76.4%
89.0%
22.9%
11.0%
0.7%
0.0%
2004
70.3%
82.9%
29.2%
16.5%
0.6%
0.6%
2000
69.0%
86.5%
28.8%
11.8%
2.3%
1.7%
1996
66.8%
85.8%
26.7%
10.5%
6.5%
3.7%
Breakdown of population affiliated with a religious congregation
Type
Adherents
Congregations
Religion
Chicago
Bronx
Chicago
Bronx
CATHOLIC CHURCH
37.5%
25.5%
11.1%
11.5%
MUSLIM ESTIMATE
3.9%
2.8%
1.8%
3.9%
EVANGELICAL LUTHERAN CHURCH IN AMERICA
1.0%
0.2%
4.3%
2.6%
SOUTHERN BAPTIST CONVENTION
1.0%
0.2%
5.4%
2.4%
LUTHERAN CHURCH
0.9%
0.1%
3.6%
0.6%
AMERICAN BAPTIST CHURCHES IN THE USA
0.4%
0.7%
1.6%
4.4%
EPISCOPAL CHURCH
0.4%
0.4%
1.8%
3.7%
SEVENTH DAY ADVENTIST CHURCH
0.4%
0.7%
1.9%
6.5%
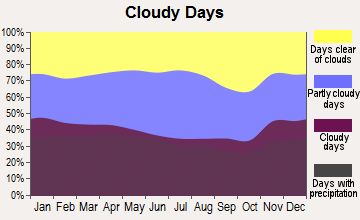
Weather
The weather between the two cities varies considerably. Chicago experiences extreme temperature swings, with hot summers and often brutally cold winters. The Windy City is known for heavy snow and intense wind chills. The Bronx, on the other hand, has milder winters and hot, humid summers. Spring and autumn are generally pleasant in both cities, but more moderate in the Bronx.
Weather and climate
Type
Chicago
Bronx
Temperature - Average
50.3°F
54.7°F
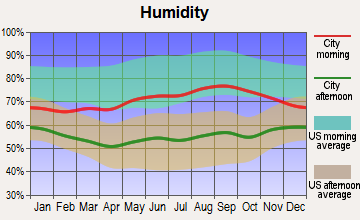
Humidity - Average morning or afternoon humidity
75.6%
67.2%
Humidity - Differences between morning and afternoon humidity
31%
26.4%
Humidity - Maximum monthly morning or afternoon humidity
85%
75.6%
Humidity - Minimum monthly morning or afternoon humidity
54%
49.2%
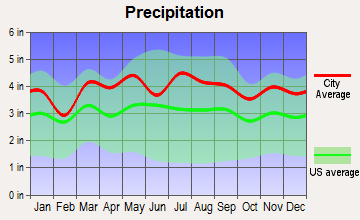
Precipitation - Yearly average
37.8 in
47 in
Snowfall - Yearly average
77.6 in
54.5 in
Clouds - Number of days clear of clouds
14%
16.5%
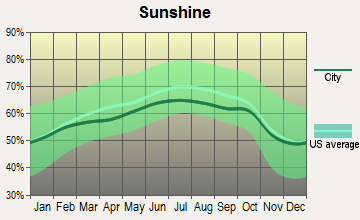
Sunshine amount - Average
56.8%
60.2%
Sunshine amount - Differences during a year
33%
20%
Sunshine amount - Maximum monthly
68%
64%
Sunshine amount - Minimum monthly
35%
44%
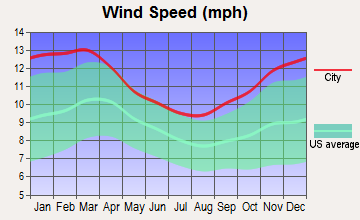
Wind speed - Average
10.7 mph
10.7 mph
Average climate in Chicago, Illinois
Average climate in Bronx, New York
Air pollution
Type
AQI
CO
NO2
OZONE
PB
PM10
PM25
SO2
Year
Chicago
Bronx
Chicago
Bronx
Chicago
Bronx
Chicago
Bronx
Chicago
Bronx
Chicago
Bronx
Chicago
Bronx
Chicago
Bronx
2018
97
102
0.26
0.31
14.3
15.8
26.2
24.4
N/A
N/A
23.6
N/A
9.3
7.4
1.7
0.6
2017
95
100
0.25
0.04
14.3
15.7
26.4
24.6
N/A
N/A
25.1
N/A
8.7
7.0
1.4
0.6
2016
95
98
0.21
0.30
14.9
16.4
26.5
24.6
N/A
N/A
17.3
N/A
9.1
7.2
0.8
0.8
2015
92
105
0.51
0.28
15.0
18.0
25.4
23.6
N/A
N/A
23.3
N/A
10.5
8.6
0.9
1.4
2014
101
99
0.45
0.32
18.0
18.0
25.1
23.6
N/A
N/A
28.9
N/A
10.7
8.4
1.3
1.7
2013
100
103
0.37
0.39
18.3
18.9
23.8
23.5
N/A
N/A
30.3
N/A
11.1
9.3
1.0
2.1
2012
112
104
0.36
0.44
18.8
18.8
25.7
23.9
N/A
N/A
31.3
N/A
12.1
9.7
1.7
3.1
2011
101
113
0.38
0.46
18.6
20.9
24.8
22.1
N/A
N/A
21.9
N/A
12.8
11.6
2.4
4.5
2010
103
113
0.37
0.53
20.4
20.2
25.4
23.7
N/A
N/A
22.2
N/A
12.9
10.8
1.4
4.7
2009
106
107
0.29
0.53
20.0
22.3
22.4
19.5
0.025
N/A
20.1
N/A
12.9
10.8
1.4
5.4
2008
108
114
0.32
0.53
22.8
23.3
22.8
19.9
0.026
0.013
22.7
N/A
12.5
12.1
1.8
5.9
2007
125
122
0.34
0.60
23.6
24.6
23.9
19.1
0.027
0.016
25.9
N/A
13.1
13.2
2.2
7.0
2006
95
120
0.31
0.50
23.0
25.0
21.1
18.9
0.029
0.018
22.0
N/A
N/A
12.8
2.6
7.0
2005
110
115
0.55
0.60
23.5
27.0
23.3
17.8
0.027
N/A
26.2
N/A
N/A
N/A
3.3
9.3
2004
85
109
0.83
0.62
23.9
25.6
20.3
16.7
0.032
0.030
23.4
N/A
N/A
N/A
4.1
8.8
2003
99
110
0.69
0.75
25.1
27.4
20.0
17.1
0.030
0.022
23.3
26.9
N/A
N/A
3.1
8.9
2002
114
124
0.83
0.67
26.5
27.9
20.8
17.4
0.029
0.008
24.4
25.0
N/A
N/A
3.3
8.6
2001
107
126
0.83
0.66
27.3
30.0
19.2
17.8
0.031
0.020
28.5
22.8
N/A
N/A
4.3
10.0
2000
104
115
0.88
0.68
24.8
29.4
17.6
16.0
0.046
0.022
N/A
22.2
N/A
N/A
4.2
10.2
Natural disasters
Type
Chicago
Bronx
Tornado activity compared to U.S. average
145.8%
58.3%
Earthquake activity compared to U.S. average
136.9%
31%
Natural disasters compared to U.S. average
20%
14%
Transportation
Chicago boasts an efficient public transportation system, including the Chicago Transit Authority (CTA) buses and 'L' trains. In the Bronx, the Metropolitan Transportation Authority (MTA) services residents with bus and subway lines. Both cities are able to meet transportation needs of residents and tourists alike.
Transport
Type
Chicago
Bronx
Amtrak stations
1
0
Amtrak stations nearby
3
3
FAA registered aircraft
1
39
FAA registered aircraft manufacturers and dealers
12
0
Means of transportation to work
Type
Chicago
Bronx
Bicycle
1.6%
0.2%
Bus
8%
15.6%
Carpooled
8.3%
9.3%
Car alone
62.3%
27%
Railroad
0.2%
2%
Streetcar
6.8%
0.2%
Subway
3.5%
34.6%
Taxicab
0.8%
1.3%
Walked
5.9%
7.2%
Average travel time to work
Type
Chicago
Bronx
Average
36.9 min
44.2 min
Real Estate
Real estate in Chicago is generally more affordable, offering a variety of options from apartments to single-family homes. The Bronx, part of the notoriously expensive New York City real estate market, is relatively cheaper than Manhattan or Brooklyn, but still pricier than Chicago.
Neighborhoods
Both cities offer diverse neighborhoods with unique characters. Chicago has upscale neighborhoods like Lincoln Park and Lakeview, and more affordable options like Logan Square. The Bronx is known for its cultural and historic neighborhoods like Riverdale and the South Bronx.
Houses and residents
Type
Chicago
Bronx
Houses
1,272,191
490,659
Average household size (people)
2.5
2.8
Houses occupied
1,139,537 (89.6%)
463,212 (94.4%)
Houses occupied by owners
530,977 (46.6%)
90,522 (19.5%)
Houses occupied by renters
608,560 (53.4%)
372,690 (80.5%)
Median rent asked for vacant for-rent units
$1,546
$1,273
Median price asked for vacant for-sale houses and condos
$355,671
$708,992
Estimated median house or condo value
$297,300
$465,000
Median number of rooms in apartments
4
3.7
Median number of rooms in houses and condos
5.8
5.1
Renting percentage
55.1%
80.7%
Housing density (houses/condos per square mile)
5,601.1
11,675
Household income disparities
48.4%
50.2%
Housing units without a mortgage
6,624 (1.9%)
12,021 (34%)
Housing units with both a second mortgage and home equity loan
17,661 (5.1%)
105 (0.3%)
Housing units with a mortgage
339,523 (98.1%)
23,339 (66%)
Housing units with a home equity loan
808 (0.2%)
2,053 (5.8%)
Housing units with a second mortgage
25,416 (7.3%)
2,159 (6.1%)
Housing units lacking complete kitchen facilities
2.5%
1.4%
Housing units lacking complete plumbing facilities
Self-employed workers in own not incorporated business
67,964
16,572
State government workers
41,316
14,515
Unpaid family workers
4,164
1,000
Industries and Occupations
Key industries in Chicago include finance, insurance, real estate, manufacturing, and healthcare. In the Bronx, healthcare is the biggest industry, followed by trade and transportation, and professional and business services.
Both cities have extensive healthcare systems. Chicago's healthcare system includes Rush University Medical Center and Northwestern Memorial Hospital. The Bronx has Montefiore Medical Center, a premier academic medical center and the University Hospital for Albert Einstein College of Medicine.
Health (county statistics)
Type
Chicago
Bronx
General health status score of residents in this county from 1 (poor) to 5 (excellent)
Chicago's infrastructure is described as robust with a sophisticated network of roads, rail, and air routes. The Bronx has a well-established, albeit older infrastructure with the need for modernization and repair in some areas.
Infrastructure
Type
Chicago
Bronx
Hospitals
86
57
TV stations
22
30
Bank branches located here
740
118
Bank institutions located here
99
24
Main business address for public companies
110
2
Drinking water stations with no reported violations in the past
22
1
Drinking water stations with reported violations in the past
16
4
Schools
School facilities
Type
Chicago
Bronx
Private elementary/middle schools
183
54
Private high schools
69
20
Public elementary/middle schools
450
285
Public high schools
145
155
Colleges/Universities
90
9
Culture and Food
Both cities are rich in cultural diversity. Chicago is famous for its museums, architecture, and food, such as deep-dish pizza and hot dogs. The Bronx is home to diverse cultures resulting in a vibrant food scene, including some of the best New York style pizza, Italian and Latin American cuisine, and the famous Arthur Avenue Market.
Sports Teams
In terms of sports, Chicago boasts teams in all major sports leagues. The Chicago Bulls, Chicago Cubs, and Chicago Blackhawks have massive fan bases. The Bronx is the home to the legendary New York Yankees baseball team.


 Chicago, IL
 Bronx, NY