Columbus, OH vs Anaheim, CA - Advanced U.S. city comparison tool

Columbus, OH vs Anaheim, CA

Anaheim, CA and Columbus, OH are both prominent US cities, though they offer diverse experiences based on their geographical locations, economic activities, and cultural landscapes. While Anaheim is recognized for its Mediterranean climate, tourist attractions such as Disneyland, and a higher cost of living, Columbus presents a four-season climate, a more affordable lifestyle, and a growing technological sector. This comparison focuses on various factors such as crime/safety, weather, and cost of living, among others, that may influence decisions on relocation or tourism.
 
 
Distance between Columbus, OH and Anaheim, CA : 1,960.9 miles

Columbus's population is larger by 162%. Its population has grown by 195,058 people (27.4%) since 2000. The population of Anaheim has grown by 17,926 people (5.5%) during that time.

Population
Type Columbus Anaheim
Population 906,528 345,940
Female / male percentage 50.7% / 49.3%
50.7%
49.3%
51.2% / 48.8%
51.2%
48.8%
Racial makeup - percentage
Ethnicity ColumbusAnaheim
White Non-Hispanic 52.9% 25.0%
Black 29.0% 2.4%
Hispanic 6.9% 52.0%
Asian 5.7% 17.4%
Two or more 5.0% 2.5%
American Indian 0.1% 0.2%
Pacific Islander 0.0% 0.5%
Racial makeup - absolute values
Ethnicity ColumbusAnaheim
White Non-Hispanic 479,734 86,435
Black 262,859 8,279
Hispanic 62,657 179,761
Asian 51,849 60,234
Two or more 45,592 8,502
American Indian 677 590
Pacific Islander 199 1,567

Crime and Safety

Columbus, OH has a somewhat higher crime rate when compared to the national average, primarily due to property crimes, but violent crime rates remain comparable to other cities of its size. Anaheim, CA, while generally considered safe, has a comparable crime rate to Columbus. Disneyland's presence and a dedicated police force help ensure safety in the main tourist areas.

Crime by year per 100,000 residents
Type City-data.com crime indexRobberies per 100,000Murders per 100,000Rapes per 100,000Assaults per 100,000Burglaries per 100,000Theft per 100,000Auto theft per 100,000Arson per 100,000
Year ColumbusAnaheimColumbusAnaheimColumbusAnaheimColumbusAnaheimColumbusAnaheimColumbusAnaheimColumbusAnaheimColumbusAnaheimColumbusAnaheim
2020 376.1 244.1 197.1 117.1 19.1 4.5 89.5 37.8 250.1 193.2 609.1 349.2 2,180.6 1,675.7 340.7 494.2 1.3 13.9
2019 366.2 219.2 200.6 111.9 9.5 2.3 99.0 39.8 198.6 162.5 643.0 317.3 2,286.8 1,668.2 394.8 347.8 1.2 12.4
2018 391.5 231.8 219.9 114.7 12.3 2.0 100.6 40.0 182.1 179.3 726.4 396.9 2,437.8 1,669.1 445.2 387.0 1.2 7.6
2017 427.9 243.4 227.6 135.8 16.4 2.8 112.2 32.5 168.7 183.4 820.0 382.3 2,681.7 1,809.0 482.8 439.2 1.3 12.7
2016 426.3 240.8 250.7 110.3 12.1 2.0 105.9 34.8 175.6 194.9 901.8 415.6 2,775.5 1,913.4 412.3 391.5 47.0 9.3
2015 418.9 263.4 267.1 125.6 9.8 5.2 105.2 36.9 179.2 196.0 857.3 422.4 2,738.9 1,972.4 370.4 477.6 47.8 8.0
2014 430.6 216.9 254.2 120.5 10.2 4.0 94.7 22.8 199.3 170.1 1,095.3 375.0 2,828.0 1,619.8 355.0 367.5 34.4 6.6
2013 465.9 241.2 301.7 126.5 9.6 3.2 84.8 23.7 148.6 173.8 1,444.1 408.9 3,111.8 1,887.5 414.4 486.8 45.2 10.1
2012 513.5 256.7 380.1 127.7 8.9 4.4 74.0 23.8 140.0 215.4 1,865.9 465.9 3,235.8 2,039.0 430.3 418.0 65.0 7.8
2011 567.0 240.3 412.8 131.1 11.0 4.4 75.4 30.9 164.5 210.2 1,934.0 414.4 3,888.5 1,753.0 461.5 328.9 30.2 7.6
2010 582.4 230.2 428.1 146.3 12.1 2.1 72.9 26.2 182.2 170.7 1,938.7 474.0 3,926.9 1,745.4 528.4 300.4 51.2 14.0
2009 591.1 222.6 447.6 150.0 10.8 2.7 78.9 21.4 170.5 178.3 1,924.7 433.7 3,977.4 1,664.1 552.0 281.3 56.9 11.0
2008 624.5 244.0 478.9 171.7 13.3 3.3 85.7 24.9 200.7 193.3 1,962.1 480.6 3,788.5 1,687.8 708.2 327.8 62.5 13.2
2007 673.2 265.2 523.8 173.4 10.7 5.1 92.8 28.6 228.9 217.5 1,960.5 545.2 4,233.9 1,699.3 849.3 380.7 86.7 12.2
2006 664.5 275.0 499.5 174.4 11.6 3.0 81.7 32.0 220.8 245.8 2,031.6 563.3 4,243.2 1,576.2 873.6 494.0 76.4 19.4
2005 576.1 231.2 521.7 164.9 14.1 3.0 76.3 24.1 237.3 289.0 2,014.7 574.1 4,406.4 1,648.0 1,097.3 608.9 63.7 23.5
2004 575.7 234.5 460.1 146.6 10.7 3.0 81.9 30.3 261.0 275.1 2,002.6 568.7 4,673.3 1,900.1 1,168.9 579.7 69.5 9.2
2003 587.3 218.9 458.9 122.0 15.0 2.7 84.7 22.6 297.3 245.1 2,017.5 586.4 4,591.7 1,995.6 1,149.2 525.7 22.3 12.8

City-data.com crime index counts serious crimes and violent crime more heavily. It adjusts for the number of visitors and daily workers commuting into cities. (higher means more crime, U.S. average = 301.1)


Crime per year
Type City-data.com crime indexRobberiesMurdersRapesAssaultsBurglariesTheftAuto theftArson
Year ColumbusAnaheimColumbusAnaheimColumbusAnaheimColumbusAnaheimColumbusAnaheimColumbusAnaheimColumbusAnaheimColumbusAnaheimColumbusAnaheim
2019 366.2 219.2 1,818 396 86 8 897 141 1,800 575 5,826 1,123 20,721 5,904 3,577 1,231 11 44
2018 391.5 231.8 1,963 407 110 7 898 142 1,625 636 6,484 1,408 21,759 5,921 3,974 1,373 11 27
2017 427.9 243.4 1,985 480 143 10 979 115 1,471 648 7,152 1,351 23,390 6,393 4,211 1,552 11 45
2016 426.3 240.8 2,162 390 104 7 913 123 1,515 689 7,778 1,469 23,939 6,764 3,556 1,384 405 33
2015 418.9 263.4 2,264 439 83 18 892 129 1,519 685 7,268 1,476 23,219 6,893 3,140 1,669 405 28
2014 430.6 216.9 2,112 418 85 14 787 79 1,656 590 9,100 1,301 23,495 5,620 2,949 1,275 286 23
2013 465.9 241.2 2,463 437 78 11 692 82 1,213 600 11,789 1,412 25,404 6,518 3,383 1,681 369 35
2012 513.5 256.7 3,031 440 71 15 590 82 1,116 742 14,878 1,605 25,802 7,025 3,431 1,440 518 27
2011 567.0 240.3 3,251 446 87 15 594 105 1,296 715 15,232 1,410 30,626 5,964 3,635 1,119 238 26
2010 582.4 230.2 3,369 492 95 7 574 88 1,434 574 15,258 1,594 30,906 5,869 4,159 1,010 403 47
2009 591.1 222.6 3,399 504 82 9 599 72 1,295 599 14,616 1,457 30,204 5,591 4,192 945 432 37
2008 624.5 244.0 3,601 573 100 11 644 83 1,509 645 14,753 1,604 28,485 5,633 5,325 1,094 470 44
2007 673.2 265.2 3,855 581 79 17 683 96 1,685 729 14,429 1,827 31,161 5,695 6,251 1,276 638 41
2006 664.5 275.0 3,654 584 85 10 598 107 1,615 823 14,862 1,886 31,041 5,277 6,391 1,654 559 65
2005 576.1 231.2 3,810 554 103 10 557 81 1,733 971 14,714 1,929 32,181 5,537 8,014 2,046 465 79
2004 575.7 234.5 3,358 493 78 10 598 102 1,905 925 14,617 1,912 34,111 6,388 8,532 1,949 507 31
2003 587.3 218.9 3,332 410 109 9 615 76 2,159 824 14,650 1,971 33,343 6,708 8,345 1,767 162 43

City-data.com crime index counts serious crimes and violent crime more heavily. It adjusts for the number of visitors and daily workers commuting into cities. (higher means more crime, U.S. average = 301.1)

Sex Offenders

According to our data, there are 1,506 registered sex offenders living in Columbus and 366 registered sex offenders living in .
The ratio of residents to sex offenders in Columbus is 573 to 1; the ratio in Anaheim is 959 to 1.
The number of registered sex offenders compared to the number of residents is larger in Columbus than in Anaheim.

Cost of Living

The cost of living in Anaheim, CA is significantly higher than the national average, primarily due to high housing costs. In contrast, Columbus, Ohio, is more affordable, with the cost of living marginally below the national average. The more affordable lifestyle in Columbus may appeal more to individuals and families planning to relocate.

Income Tax

Ohio state income tax ranges from 0% to 4.797% based on income, with Columbus adding an additional 2.5% municipal tax. California has a progressive tax rate ranging from 1% to 13.3%, making it higher compared to Ohio.

Property Tax

Property taxes in Anaheim are considerably lower, with an average rate of 0.72%, compared to Columbus with an average rate of 2.04%.

Sales Tax

Ohio has a lower state sales tax than California, at 5.75% compared to California's 7.25%. The total sales tax in Columbus is 7.5%, whereas Anaheim, when considering the district tax, is approximately 8% as of 2022.
Income
Type Columbus Anaheim
Estimated median household income $58,202 $81,747
Estimated per capita income $32,392 $32,827
Cost of living index (U.S. average is 100) 96.1 88.5

If you make $50,000 in Anaheim, you will have to make $54,294 in Columbus to maintain the same standard of living.

Geographical Conditions

Geographically, Columbus is flat and characterized by a mix of urban and suburban landscapes. Anaheim is located in the Los Angeles metropolitan area, offering beaches, parks, and access to many outdoor activities.
Geographical information
Type Columbus Anaheim
Land area 210.3 sq. miles 48.9 sq. miles
Population density 4,311.3 people per sq. mile 7,068.3 people per sq. mile
Elevation 800 feet 160 feet
Relative area comparison
Columbus, OH Anaheim, CA
First ancestry reported - percentage
Ancestry ColumbusAnaheim
German 7.8% 1.6%
English 5.2% 1.3%
Irish 4.2% 1.1%
Italian 3.2% 0.9%
Polish 1.2% 0.4%
Scottish 0.7% 0.2%
Scotch-Irish 0.5% 0.1%
Welsh 0.5% 0.1%
Dutch 0.3% 0.2%
Russian 0.3% 0.1%
Slovak 0.3% 0.0%
Hungarian 0.2% 0.0%
Lithuanian 0.2% 0.1%
Norwegian 0.2% 0.3%
Ukrainian 0.2% 0.1%
Population origin - absolute values
Ancestry ColumbusAnaheim
German 39,093 3,454
English 25,954 2,898
Irish 21,227 2,328
Italian 15,939 1,937
Polish 5,799 923
Scottish 3,493 449
Scotch-Irish 2,642 196
Welsh 2,395 127
Slovak 1,547 33
Russian 1,502 265
Dutch 1,361 513
Hungarian 1,088 104
Ukrainian 1,081 134
Lithuanian 1,020 154
Norwegian 937 670
Greek 847 218
French 789 318
Swedish 763 265
Swiss 757 151
Czech 673 37
Foreign born residents - absolute values
Type Count
Region ColumbusAnaheim
All 125,304 124,924
Africa 42,208 2,778
Asia 44,859 43,851
Europe 8,129 3,093
Latin America 23,931 70,408
North America 1,235 599
Oceania 245 442
Foreign born residents - percentage
Type Percentage
Region ColumbusAnaheim
All 13.9% 36.0%
Africa 4.7% 0.8%
Asia 5.0% 12.7%
Europe 0.9% 0.9%
Latin America 2.6% 20.3%
North America 0.1% 0.2%
Oceania 0.0% 0.1%

Education

Both cities boast excellent educational institutions. Columbus is home to Ohio State University, a renowned institution, and a top-rate public school system. Anaheim houses the University of California campus and various vocational and technical schools offering diverse educational opportunities.
School enrollment
Type Columbus Anaheim
Nursery, preschool 8,473 (3.8%) 3,430 (3.8%)
Kindergarten 10,536 (4.7%) 3,822 (4.2%)
Grade 1 to 4 40,173 (17.9%) 17,579 (19.3%)
Grade 5 to 8 41,603 (18.5%) 16,042 (17.6%)
Grade 9 to 12 40,616 (18.1%) 19,089 (21%)
College undergrad 63,955 (28.4%) 24,842 (27.3%)
Graduate or professional 19,575 (8.7%) 6,199 (6.8%)
Students in private schools - absolute values
Type Count
Grade ColumbusAnaheim
Grades 1 to 8 (elementary and middle school) 15,679 2,111
Grades 9 to 12 (high school) 5,030 991
Undergraduate colleges 8,811 2,472
Students in private schools - percentage
Type Percentage
Grade ColumbusAnaheim
Grades 1 to 8 (elementary and middle school) 19.2% 6.3%
Grades 9 to 12 (high school) 12.4% 5.2%
Undergraduate colleges 13.8% 10.0%
Educational attainment
Type Columbus Anaheim
Less than high school 9.2% 22.6%
High school or equiv. 24.9% 21.6%
Less than 1 year of college 6.3% 7.2%
1 or more years of college 13.6% 11.5%
Associate degree 7.6% 7.7%
Bachelor's degree 25% 20.1%
Master's degree 9.8% 6.8%
Profess. school degree 2% 1.4%
Doctorate degree 1.6% 1.1%
Education level (25-year-olds and older)
Type Columbus Anaheim
Bachelor's degree or higher 38.4% 29.4%
Graduate or professional degree 13.4% 9.3%
High school or higher 90.8% 77.4%

Work and Economy

While Columbus has a diversified economy with growing sectors in technology, education, government, and healthcare, Anaheim's economy heavily relies on tourism, entertainment, retail, and manufacturing. Unemployment rates in both cities are close to the national average.

Biggest Employers

In Columbus, some significant employers include Ohio State University, Nationwide, and American Electric Power. Anaheim's largest employers include Disneyland Resort, Kaiser Permanente, and Anaheim Regional Medical Center.
Employment and residency - absolute values
Kind ColumbusAnaheim
Work and live in this city 254,193 41,005
Work and live in this county 412,410 139,799
Workers who work outside the city they live in 457,277 287,009
Workers who work outside the county they live in 56,853 24,260
Working at home 111,379 22,243
Not working at home 357,884 141,816
Daytime population change due to commuting 82,520 24,288
Employment and residency - percentage
Kind ColumbusAnaheim
Work and live in this city 69.2% 29.4%
Work and live in this county 87.9% 85.2%
Workers who work outside the city they live in 30.8% 70.6%
Workers who work outside the county they live in 12.1% 14.8%
Working at home 23.7% 13.6%
Not working at home 76.3% 86.4%
Daytime population change due to commuting 11.6% 7.4%
Geographical mobility: all
Type all
Mobility ColumbusAnaheim
Same house 1 year ago 79.0% 90.2%
Moved from abroad 0.8% 0.3%
Moved within same county 13.5% 6.4%
Moved from different state 2.7% 0.7%
Moved within same state 4.0% 2.4%
Geographical mobility: Asian
Type Asian
Mobility ColumbusAnaheim
Same house 1 year ago 72.4% 89.4%
Moved from abroad 3.5% 0.9%
Moved within same county 13.7% 5.2%
Moved from different state 8.9% 0.3%
Moved within same state 1.6% 4.2%
Geographical mobility: Black
Type Black
Mobility ColumbusAnaheim
Same house 1 year ago 78.9% 89.1%
Moved from abroad 1.6% 0.9%
Moved within same county 14.7% 4.3%
Moved from different state 1.9% 0.7%
Moved within same state 2.8% 5.6%
Geographical mobility: White
Type White
Mobility ColumbusAnaheim
Same house 1 year ago 79.8% 90.3%
Moved from abroad 0.4% 0.0%
Moved within same county 12.6% 6.1%
Moved from different state 2.7% 1.3%
Moved within same state 4.5% 2.3%
Building permits
Type Average valueCount
City ColumbusAnaheimColumbusAnaheim
1997 $74,900 $189,400 1,822 285
1998 $78,200 $181,200 1,979 421
1999 $105,800 $194,600 2,871 441
2000 $128,300 $247,900 2,903 114
2001 $130,400 $241,400 3,058 75
2002 $133,600 $218,200 3,196 151
2003 $137,900 $206,500 3,188 255
2004 $141,300 $209,900 2,687 86
2005 $160,500 $230,400 2,360 63
2006 $168,800 $187,400 1,223 81
2007 $163,200 $282,500 1,008 35
2008 $169,200 $344,400 686 27
2009 $162,500 $172,200 852 32
2010 $164,100 $210,500 716 59
2011 $160,000 $189,500 667 41
2012 $163,700 $242,100 723 125
2013 $174,000 $173,800 770 56
2014 $211,100 $201,600 724 51
2015 $244,000 $348,800 729 36
2016 $243,500 $272,700 649 129
2017 $257,700 $226,700 650 72
2018 $226,600 $214,800 555 121
2019 $259,300 $141,200 512 123
2020 $266,700 $108,000 834 86
2021 $306,700 $101,400 913 85

There were 913 building permits issued in Columbus in 2012 (246 more than in 2011) compared to 85 building permits issued in Anaheim in 2012 (44 more than in 2011).

In Columbus (Franklin County), 60.8% voted for Democrats and 37.9% for Republicans in 2012 Presidential Election. In Anaheim (Orange County), 45.8% voted for Democrats and 52.0% for Republicans.

Elections
Type DemocratsRepublicansOther
Year ColumbusAnaheimColumbusAnaheimColumbusAnaheim
2020 64.7% 53.6% 33.4% 44.6% 1.9% 1.8%
2016 59.8% 50.9% 33.9% 42.4% 6.2% 6.7%
2012 60.8% 45.8% 37.9% 52.0% 1.3% 2.3%
2008 59.8% 47.8% 39.0% 50.3% 1.2% 1.9%
2004 54.5% 39.3% 45.2% 60.2% 0.3% 0.5%
2000 48.9% 40.4% 47.9% 55.9% 3.2% 3.7%
1996 48.1% 37.9% 44.5% 51.7% 7.3% 10.5%
Breakdown of population affiliated with a religious congregation
Type AdherentsCongregations
Religion ColumbusAnaheimColumbusAnaheim
CATHOLIC CHURCH 13.2% 26.5% 5.6% 4.4%
EVANGELICAL LUTHERAN CHURCH IN AMERICA 1.6% 0.4% 3.7% 2.3%
SOUTHERN BAPTIST CONVENTION 1.6% 2.3% 6.8% 8.8%
MUSLIM ESTIMATE 1.3% 0.8% 1.9% 1.3%
VINEYARD USA 1.3% 0.2% 1.2% 0.7%
AMERICAN BAPTIST CHURCHES IN THE USA 1.0% 0.2% 3.3% 1.7%
EPISCOPAL CHURCH 0.4% 0.4% 1.3% 1.4%
SEVENTH DAY ADVENTIST CHURCH 0.4% 0.4% 2.0% 1.3%
LUTHERAN CHURCH 0.2% 0.6% 1.0% 2.0%
REFORMED CHURCH IN AMERICA 0.0% 0.3% 0.1% 0.2%

Weather

Anaheim enjoys a Mediterranean climate, with warm, dry summers and mild, wet winters. It is an excellent choice for people who enjoy plenty of sunshine year-round. On the contrary, Columbus experiences all four seasons, with hot, humid summers and cold, snowy winters, appealing to those who prefer a varied climate.
Weather and climate
Type Columbus Anaheim
Temperature - Average 52.8°F 64.9°F
Humidity - Average morning or afternoon humidity 74.8% 69.6%
Humidity - Differences between morning and afternoon humidity 34% 25.9%
Humidity - Maximum monthly morning or afternoon humidity 86% 77.9%
Humidity - Minimum monthly morning or afternoon humidity 52% 52%
Precipitation - Yearly average 39.3 in 12 in
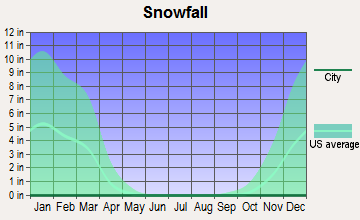
Snowfall - Yearly average 56.6 in 0 in
Clouds - Number of days clear of clouds 12% 26.6%
Sunshine amount - Average 49.7% 78.4%
Sunshine amount - Differences during a year 27% 22%
Sunshine amount - Maximum monthly 55% 84.9%
Sunshine amount - Minimum monthly 28% 63%
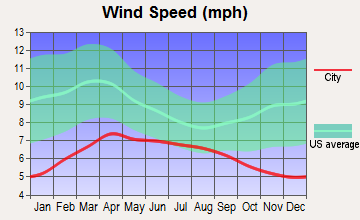
Wind speed - Average 8.2 mph 5.7 mph

Average climate in Columbus, Ohio

Chicago, Illinois average temperatures Chicago, Illinois average precipitation Chicago, Illinois humidity Chicago, Illinois wind speed Chicago, Illinois snowfall Chicago, Illinois sunshine Chicago, Illinois clear and cloudy days
 

Average climate in Anaheim, California

Chicago, Illinois average temperatures Chicago, Illinois average precipitation Chicago, Illinois humidity Chicago, Illinois wind speed Chicago, Illinois snowfall Chicago, Illinois sunshine Chicago, Illinois clear and cloudy days
 

Air pollution
Type AQICONO2OZONEPBPM10PM25SO2
Year ColumbusAnaheimColumbusAnaheimColumbusAnaheimColumbusAnaheimAnaheim ColumbusAnaheimColumbusAnaheimColumbusAnaheim
2018 69 139 0.11 0.36 10.0 13.7 33.8 26.8 0.007 N/A N/A 27.5 6.0 12.1 0.0 0.7
2017 68 145 0.16 0.50 9.6 14.8 28.7 26.7 0.007 N/A N/A 26.7 5.5 13.5 0.1 0.6
2016 76 132 0.17 0.57 10.6 14.5 28.5 26.3 0.007 N/A N/A 24.1 5.6 12.9 0.1 0.3
2015 74 142 0.16 0.45 11.3 14.7 27.0 26.0 0.007 N/A N/A 25.0 6.1 14.8 0.1 0.3
2014 82 138 0.20 0.40 11.0 15.0 28.5 26.7 0.008 N/A N/A 26.7 7.4 16.2 0.5 0.5
2013 78 138 N/A 0.47 8.9 14.8 29.6 25.3 0.005 N/A N/A 28.3 7.8 13.9 0.6 0.5
2012 87 142 N/A 0.46 N/A 14.5 32.9 25.0 0.005 N/A N/A 27.0 8.9 14.7 N/A 0.2
2011 89 138 N/A 0.42 N/A 15.9 28.1 26.7 0.007 N/A N/A 27.4 8.9 16.0 N/A 0.8
2010 90 130 N/A 0.44 N/A 16.7 30.5 25.8 0.009 N/A N/A 23.5 9.1 14.9 N/A 0.6
2009 61 151 N/A 0.41 N/A 18.0 28.7 26.0 0.010 N/A N/A 24.4 N/A 15.4 N/A 1.1
2008 65 156 N/A 0.38 N/A 20.3 31.2 26.7 0.010 N/A N/A 30.2 N/A 18.9 1.8 1.1
2007 80 135 N/A 0.38 N/A 19.5 30.8 26.2 0.012 N/A N/A N/A N/A N/A 2.8 0.8
2006 75 128 N/A 0.43 N/A 19.1 30.0 26.3 0.008 N/A 23.7 N/A N/A N/A 3.3 1.3
2005 87 128 N/A 0.45 N/A 20.7 29.6 31.3 0.013 N/A 27.5 N/A N/A N/A 4.1 1.3
2004 77 134 N/A 0.53 N/A 19.9 27.8 37.1 0.015 N/A 24.6 N/A N/A N/A 4.4 1.6
2003 91 143 N/A 0.69 N/A 23.7 26.4 23.8 0.025 N/A 23.9 N/A N/A N/A 4.1 1.1
2002 93 134 N/A 0.77 N/A 24.1 31.3 21.8 0.019 N/A 25.7 N/A N/A N/A 4.1 2.1
2001 84 143 N/A 0.94 N/A 28.4 29.2 24.5 0.035 N/A 25.9 N/A N/A N/A 3.5 1.7
2000 57 152 N/A 0.80 N/A 29.4 N/A 23.0 0.030 N/A 23.5 N/A N/A N/A 3.7 1.9
Natural disasters
Type Columbus Anaheim
Tornado activity compared to U.S. average 119.1% 19.3%
Earthquake activity compared to U.S. average 96.1% 7,039.7%
Natural disasters compared to U.S. average 16% 32%

Transportation

Columbus provides various public transportation options, including buses and a bike-sharing program, but commuting is often done by car due to its widespread layout. Anaheim also offers transit options through buses and trains and is closely connected to other parts of Southern California via numerous freeways.
Transport
Type Columbus Anaheim
Amtrak stations 1 1
Amtrak stations nearby 1 3
FAA registered aircraft 415 136
FAA registered aircraft manufacturers and dealers 4 3
Means of transportation to work
Type Columbus Anaheim
Bicycle 0.6% 1%
Bus 1.6% 0.9%
Carpooled 7.4% 10.8%
Car alone 86.7% 83.4%
Motorcycle 0% 0.2%
Railroad 0% 0.2%
Subway 0% 0.3%
Taxicab 0.1% 0%
Walked 2.2% 1.6%
Means of transportation to work
Average travel time to work
Type Columbus Anaheim
Average 26.1 min 30.8 min
Other means 21.7 min 28.1 min
Public transportation 35.4 min 47.8 min
Travel time to work
Time leaving to work
Travel time to work
Time leaving to work
Private vehicle occupancy
Type Columbus Anaheim
Average 1.1 1.2
Drove alone 90.7% 85.3%
In 2 person carpool 7.3% 11.2%
In 3 person carpool 1.4% 1.8%
In 4 person carpool 0.5% 0.8%
In 5-6 person carpool 0.1% 0.9%

How many people usually rode to work in the car, truck or van.

Real Estate

Anaheim's real estate market is quite expensive, reflecting Californian property prices, with median home values significantly above the national average. In Columbus, the real estate market is more affordable, with median home prices below the national average, making it an attractive place for real estate investment.

Neighborhoods

Columbus offers a mixture of urban and suburban neighborhoods, providing options to suit different lifestyles. Anaheim also has diverse neighborhoods, from bustling cityscapes to quiet suburban communities, although they are generally more expensive.
Houses and residents
Type Columbus Anaheim
Houses 422,120 110,319
Average household size (people) 2.3 3.4
Median year apartment built 1982 1975
Median year house/condo built 1977 1970
Length of stay in the house since moving in 12.6 years 14.8 years
Houses occupied 390,605 (92.5%) 105,608 (95.7%)
Houses occupied by owners 175,427 (44.9%) 51,684 (48.9%)
Houses occupied by renters 215,178 (55.1%) 53,924 (51.1%)
Median rent asked for vacant for-rent units $1,371 $2,111
Median monthly housing costs $1,110 $1,910
Median price asked for vacant for-sale houses and condos $195,022 $1,256,069
Estimated median house or condo value $219,200 $688,400
Median numbers of rooms 5 4.7
Median number of rooms in apartments 4.2 3.6
Median number of rooms in houses and condos 6.3 6.1
Median house price - detached houses $233,452 $859,592
Median house price - in 2-unit structures $121,729 $742,035
Median house price - in 3-to-4-unit structures $215,337 $546,946
Median house price - in 5 or more unit structures $240,711 $553,561
Median house price - mobile homes $121,578 $114,904
Median house price - Townhouses or other attached units $218,726 $619,623
Median house price - All housing units $229,736 $782,600
Median house age 42 48
Renting percentage 53% 51.5%
Housing density (houses/condos per square mile) 2,007.5 2,254.1
House value disparities 30.2% 20.2%
Household income disparities 42.4% 43.6%
Median household income for houses/condes with a mortgage $89,058 $125,169
Median household income for apartments without a mortgage $59,295 $86,779
Housing units without a mortgage 4,290 (3.3%) 374 (1%)
Housing units with both a second mortgage and home equity loan 10,651 (8.2%) 2,222 (6%)
Housing units with a mortgage 125,487 (96.7%) 36,875 (99%)
Housing units with a home equity loan 775 (0.6%) 0 (0%)
Housing units with a second mortgage 13,558 (10.4%) 2,794 (7.5%)
House/condo owner moved in on average (years ago) 10 14
House/condo renter moved in on average (years ago) 1 4
Housing units lacking complete kitchen facilities 1.6% 4.5%
Housing units lacking complete plumbing facilities 1.3% 0.1%
Housing units in structures
Housing units in structures ColumbusAnaheim
One, detached 45.8% 42.7%
One, attached 9.1% 8.3%
Two 4.0% 2.3%
3 or 4 8.6% 7.6%
5 to 9 11.8% 6.8%
10 to 19 8.6% 5.5%
20 to 49 4.5% 6.8%
50 or more 6.8% 17.2%
Mobile homes 0.8% 2.6%
Boats, RVs, vans, etc. 0.1% 0.1%
Median real estate property taxes paid for housing units
Type Columbus Anaheim
With mortgages $3,145 (1.4%) $5,429 (0.8%)
With no mortgages $2,472 (1.3%) $2,922 (0.4%)
Marital status
Type Columbus Anaheim
Divorced 10.2% 7.5%
Never married 45.1% 37.7%
Now married 38.4% 47.6%
Separated 2.3% 2.1%
Widowed 4% 5.1%
Class of workers - percentage
Class of Workers ColumbusAnaheim
Employee of private company 70.7% 72.5%
Private not-for-profit wage and salary workers 8.8% 5.2%
State government workers 6.7% 3.0%
Local government workers 5.4% 7.4%
Self-employed workers in own not incorporated business 4.4% 6.6%
Self-employed in own incorporated business 2.2% 3.5%
Federal government workers 1.7% 1.8%
Unpaid family workers 0.2% 0.0%
Class of workers - absolute values
Class of Workers ColumbusAnaheim
Employee of private company 337,898 121,099
Federal government workers 7,961 2,956
Local government workers 25,846 12,291
Private not-for-profit wage and salary workers 42,209 8,645
Self-employed in own incorporated business 10,584 5,895
Self-employed workers in own not incorporated business 20,915 11,077
State government workers 31,881 5,046
Unpaid family workers 724 65

Industries and Occupations

Columbus' key industries include education, health, finance, and technology, with most people working in management, business, science, and arts occupations. Anaheim's dominant industries are entertainment, tourism, manufacturing, aerospace, and retail, with many residents employed in sales, management, and arts occupations.
Most common male industries
Industry ColumbusAnaheim
Retail trade 11.9% 8.8%
Manufacturing 11.3% 13.0%
Transportation and warehousing 10.4% 8.4%
Professional, scientific, and technical services 8.2% 6.1%
Construction 7.8% 13.6%
Accommodation and food services 7.5% 6.1%
Health care and social assistance 7.0% 6.1%
Finance and insurance 6.8% 4.0%
Educational services 6.3% 4.1%
Administrative and support and waste management services 5.1% 8.6%
Public administration 4.0% 2.6%
Other services, except public administration 3.6% 4.6%
Wholesale trade 3.0% 4.2%
Information 2.5% 2.6%
Arts, entertainment, and recreation 2.0% 3.7%
Real estate and rental and leasing 1.2% 2.4%
Utilities 1.0% 0.3%
Management of companies and enterprises 0.2% 0.0%
Agriculture, forestry, fishing and hunting 0.2% 0.8%
Mining, quarrying, and oil and gas extraction 0.1% 0.1%
Most common female industries
Industry ColumbusAnaheim
Health care and social assistance 23.8% 19.7%
Retail trade 11.7% 12.9%
Educational services 10.9% 9.5%
Finance and insurance 9.3% 5.0%
Professional, scientific, and technical services 6.7% 6.5%
Accommodation and food services 6.5% 9.1%
Manufacturing 4.8% 10.1%
Transportation and warehousing 4.7% 2.2%
Other services, except public administration 4.3% 6.5%
Administrative and support and waste management services 4.2% 3.3%
Public administration 3.8% 5.2%
Construction 1.8% 1.6%
Arts, entertainment, and recreation 1.8% 2.5%
Information 1.7% 0.8%
Real estate and rental and leasing 1.4% 2.2%
Wholesale trade 1.2% 2.1%
Utilities 0.9% 0.1%
Management of companies and enterprises 0.2% 0.0%
Agriculture, forestry, fishing and hunting 0.2% 0.5%
Mining, quarrying, and oil and gas extraction 0.1% 0.1%
Most common male occupations
Occupation ColumbusAnaheim
Management occupations 10.7% 9.4%
Material moving occupations 9.2% 5.3%
Office and administrative support occupations 9.1% 7.2%
Sales and related occupations 8.0% 8.4%
Computer and mathematical occupations 6.9% 2.7%
Production occupations 6.2% 6.9%
Construction and extraction occupations 6.1% 10.2%
Food preparation and serving related occupations 5.8% 5.1%
Transportation occupations 5.7% 8.4%
Business and financial operations occupations 5.5% 4.9%
Educational instruction, and library occupations 3.5% 2.3%
Building and grounds cleaning and maintenance occupations 3.4% 6.7%
Installation, maintenance, and repair occupations 3.2% 4.3%
Architecture and engineering occupations 2.8% 4.6%
Arts, design, entertainment, sports, and media occupations 2.3% 2.2%
Health diagnosing and treating practitioners and other technical occupations 1.9% 1.3%
Firefighting and prevention, and other protective service workers including supervisors 1.8% 1.4%
Life, physical, and social science occupations 1.7% 1.6%
Community and social service occupations 1.4% 1.2%
Personal care and service occupations 1.2% 1.9%
Most common female occupations
Occupation ColumbusAnaheim
Office and administrative support occupations 17.1% 19.8%
Management occupations 9.2% 6.9%
Business and financial operations occupations 8.8% 6.9%
Sales and related occupations 7.3% 12.4%
Educational instruction, and library occupations 7.1% 6.7%
Health diagnosing and treating practitioners and other technical occupations 7.0% 4.2%
Healthcare support occupations 6.1% 6.8%
Food preparation and serving related occupations 4.8% 6.0%
Material moving occupations 4.4% 2.0%
Production occupations 3.7% 5.4%
Health technologists and technicians 3.3% 3.6%
Building and grounds cleaning and maintenance occupations 3.3% 4.2%
Personal care and service occupations 3.1% 5.6%
Computer and mathematical occupations 2.9% 1.4%
Arts, design, entertainment, sports, and media occupations 2.6% 1.3%
Community and social service occupations 2.5% 2.2%
Legal occupations 1.5% 0.8%
Transportation occupations 1.5% 0.8%
Life, physical, and social science occupations 1.4% 1.3%
Food environment data per 10,000 residents
Food environment statistics ColumbusAnaheim
Number of convenience stores (no gas) 2.6 1.5
Number of convenience stores (with gas) 1.3 0.5
Number of full-service restaurants 6.5 8.2
Number of grocery stores 2.3 1.8
Number of supercenters and club stores 0.1 0.1
Food environment - absolute values
Food environment statistics ColumbusAnaheim
Number of convenience stores (no gas) 285 434
Number of convenience stores (with gas) 146 147
Number of full-service restaurants 730 2,438
Number of grocery stores 251 530
Number of supercenters and club stores 11 18
Obesity and diabetes
Food environment statistics rate ColumbusAnaheim
Adult diabetes rate 9.5% 6.3%
Adult obesity rate 30.2% 18.5%
Low-income preschool obesity rate 13.3% 16.4%

Health Care

Both cities have a high standard of healthcare. Columbus hosts several highly-rated hospitals, including the Ohio State University Wexner Medical Center. Anaheim is served by multiple medical centers, including the Anaheim Regional Medical Center.
Health (county statistics)
Type Columbus Anaheim
General health status score of residents in this county from 1 (poor) to 5 (excellent) 3.5 3.6
Average weight of females (lbs) 167.2 lbs 150.7 lbs
Average weight of males (lbs) 201.7 lbs 187.6 lbs
Residents visited a dentist within the past year 72.1% 76%
Residents exercised in the past month 71.6% 79.4%
Adult residents drank alcohol in the past 30 days 52.4% 81.9%
Residents smoked 100+ cigarettes in their lives 41.6% 37.8%

Fatal vehicle accidents per 100,000 residents
Type Total count per 100,000Drunk per 100,000Fatal count per 100,000Pedestrian count per 100,000Person count per 100,000Vehicle count per 100,000
Year ColumbusAnaheimColumbusAnaheimColumbusAnaheimColumbusAnaheimColumbusAnaheimColumbusAnaheim
2021 10.5 7.2 0.0 0.0 11.3 7.8 3.5 2.9 24.2 16.2 18.1 11.3
2020 9.6 7.8 2.9 2.0 10.0 8.9 2.8 3.7 20.4 17.0 15.5 12.7
2019 8.6 5.1 2.8 2.0 9.4 5.1 3.6 1.7 18.4 13.6 13.4 9.6
2018 7.5 5.1 2.5 1.7 8.2 5.4 2.2 2.0 16.4 10.2 11.4 9.6
2017 7.1 8.8 2.3 1.1 7.4 9.6 2.4 3.1 15.3 20.7 11.6 16.4
2016 7.0 7.7 3.2 2.0 7.0 8.2 2.5 2.6 15.3 20.2 11.2 11.1
2015 6.5 5.4 2.6 1.1 7.1 5.4 1.9 1.7 15.0 13.1 11.0 10.6
2014 6.0 6.6 2.5 1.4 6.3 7.2 2.2 1.7 12.4 15.0 10.3 11.0
2013 5.3 4.9 1.6 1.2 6.1 5.8 1.3 3.2 12.6 8.7 8.8 7.2
2012 6.9 4.7 2.8 0.6 7.9 5.0 2.1 2.0 16.5 11.1 11.6 8.2
2011 7.4 4.7 1.9 1.5 7.8 5.3 3.1 2.3 15.2 10.8 11.5 8.5
2010 6.6 4.2 2.2 1.8 6.9 5.1 1.8 1.8 15.9 13.1 11.4 7.7
2009 7.3 7.4 2.9 2.1 7.7 7.7 1.8 4.1 18.6 17.2 12.0 11.2
2008 8.6 6.6 3.6 2.1 9.2 7.5 2.9 0.6 25.5 16.5 14.9 11.1
2007 7.3 9.1 3.1 3.3 7.9 9.4 1.7 2.4 16.1 29.2 11.1 16.4
2006 6.3 11.6 2.6 5.2 6.7 13.1 1.3 3.3 16.0 36.5 11.4 24.0
2005 8.3 9.4 2.8 3.6 8.4 10.6 1.8 4.3 21.7 25.5 13.7 16.7
2004 7.7 7.9 1.9 3.9 8.3 8.5 1.5 2.7 19.3 26.6 12.1 16.3
2003 7.6 7.9 3.5 2.4 8.2 9.1 1.8 3.0 24.1 29.3 13.1 14.5
2002 7.7 6.7 2.6 1.8 8.5 7.3 1.2 3.0 17.7 20.0 11.4 10.0
2001 9.7 5.1 3.0 1.5 10.2 5.8 2.9 2.4 28.2 16.0 16.0 10.6
2000 6.5 5.8 1.5 1.2 6.5 6.1 1.4 2.4 16.4 13.7 10.0 7.9
1999 9.4 5.7 3.6 2.0 9.8 5.7 2.2 2.7 25.2 13.6 14.6 8.3
1998 7.6 6.4 2.2 2.4 8.8 6.7 2.1 1.3 22.7 16.5 12.5 11.4
1997 7.5 8.9 2.7 2.7 8.2 9.2 2.7 3.1 19.0 26.3 11.7 15.0
1996 7.4 9.4 2.9 2.8 7.5 11.5 1.7 2.8 22.3 27.1 11.8 14.9
1995 6.8 6.7 1.5 1.8 7.1 7.7 2.0 3.2 16.5 22.5 9.5 11.2
1994 5.0 9.6 1.4 1.4 5.2 10.6 2.1 6.4 11.7 33.3 7.3 14.5
1993 6.9 11.8 2.4 5.0 7.3 11.8 2.9 6.1 17.5 31.5 9.9 16.5
1992 5.5 8.4 0.3 2.2 5.7 9.1 1.5 4.0 13.5 26.2 8.6 13.8
1991 7.3 8.9 1.5 5.9 8.4 10.7 1.1 3.0 18.1 28.8 10.7 14.0
1990 5.3 10.8 1.4 4.9 5.3 11.2 0.0 0.0 12.1 32.9 7.2 16.8
1989 8.8 11.8 1.1 5.7 9.6 12.2 0.0 0.0 23.8 39.4 14.5 18.3
1988 10.0 17.5 4.8 10.5 11.6 20.2 0.0 0.0 23.7 57.2 14.9 30.3
1987 10.4 16.2 3.8 4.8 10.8 17.0 0.0 0.0 27.8 48.3 17.8 28.9
1986 8.9 15.7 5.4 5.7 9.2 16.6 0.0 0.0 19.8 39.6 12.2 23.8
1985 8.7 16.9 4.2 9.1 9.3 18.1 0.0 0.0 22.2 48.6 13.7 27.6
1984 11.5 13.0 4.9 7.1 12.2 13.9 0.0 0.0 27.2 30.2 17.1 17.6
1983 7.7 12.4 3.8 9.8 8.4 13.3 0.0 0.0 18.6 31.3 11.8 19.7
1982 10.7 16.2 4.1 7.4 11.2 17.5 0.0 0.0 25.6 35.4 15.2 20.1
1981 12.1 16.1 3.0 7.1 13.5 17.0 0.0 0.0 30.4 37.0 18.2 21.4
1980 13.6 12.3 3.2 6.8 14.7 13.7 0.0 0.0 30.8 35.1 19.1 21.4
1979 11.2 18.2 2.3 7.9 12.8 21.0 0.0 0.0 27.0 41.6 17.4 28.5
1978 10.2 14.8 2.9 4.8 11.4 17.2 0.0 0.0 24.8 34.9 14.3 23.0
1977 9.5 18.2 2.5 8.8 10.2 19.6 0.0 0.0 20.8 40.3 12.9 26.0
1976 8.3 16.6 0.0 5.0 9.4 19.2 0.0 0.0 21.3 43.4 11.9 28.2
1975 8.3 17.1 0.0 5.2 9.4 19.7 0.0 0.0 21.4 44.6 11.9 29.0

Fatal vehicle accidents
Type Total countDrunkFatal countPedestrian countPerson countVehicle count
Year ColumbusAnaheimColumbusAnaheimColumbusAnaheimColumbusAnaheimColumbusAnaheimColumbusAnaheim
1975 46 33 0 10 52 38 0 0 118 86 66 56
1976 46 33 0 10 52 38 0 0 118 86 66 56
1977 53 37 14 18 57 40 0 0 116 82 72 53
1978 57 31 16 10 64 36 0 0 139 73 80 48
1979 63 39 13 17 72 45 0 0 152 89 98 61
1980 77 27 18 15 83 30 0 0 174 77 108 47
1981 69 36 17 16 77 38 0 0 174 83 104 48
1982 62 37 24 17 65 40 0 0 148 81 88 46
1983 45 29 22 23 49 31 0 0 109 73 69 46
1984 68 31 29 17 72 33 0 0 161 72 101 42
1985 52 41 25 22 56 44 0 0 133 118 82 67
1986 54 39 33 14 56 41 0 0 120 98 74 59
1987 64 41 23 12 66 43 0 0 170 122 109 73
1988 62 45 30 27 72 52 0 0 147 147 92 78
1989 55 31 7 15 60 32 0 0 149 103 91 48
1990 34 29 9 13 34 30 0 0 77 88 46 45
1991 47 24 10 16 54 29 7 8 117 78 69 38
1992 36 23 2 6 37 25 10 11 88 72 56 38
1993 45 33 16 14 48 33 19 17 115 88 65 46
1994 33 27 9 4 34 30 14 18 77 94 48 41
1995 45 19 10 5 47 22 13 9 109 64 63 32
1996 49 27 19 8 50 33 11 8 148 78 78 43
1997 50 26 18 8 55 27 18 9 127 77 78 44
1998 51 19 15 7 59 20 14 4 152 49 84 34
1999 63 17 24 6 66 17 15 8 169 41 98 25
2000 46 19 11 4 46 20 10 8 117 45 71 26
2001 70 17 22 5 74 19 21 8 204 53 116 35
2002 56 22 19 6 62 24 9 10 129 66 83 33
2003 56 26 26 8 60 30 13 10 177 97 96 48
2004 57 26 14 13 61 28 11 9 142 88 89 54
2005 61 31 21 12 62 35 13 14 160 84 101 55
2006 47 38 19 17 50 43 10 11 119 120 85 79
2007 55 30 23 11 59 31 13 8 121 96 83 54
2008 65 22 27 7 70 25 22 2 194 55 113 37
2009 56 25 22 7 59 26 14 14 143 58 92 38
2010 52 14 17 6 54 17 14 6 125 44 90 26
2011 59 16 15 5 62 18 25 8 121 37 92 29
2012 56 16 23 2 64 17 17 7 134 38 94 28
2013 44 17 13 4 50 20 11 11 104 30 72 25
2014 50 23 21 5 53 25 18 6 104 52 86 38
2015 56 19 22 4 61 19 16 6 128 46 94 37
2016 61 27 28 7 61 29 22 9 133 71 97 39
2017 63 31 20 4 65 34 21 11 135 73 102 58
2018 67 18 22 6 73 19 20 7 146 36 102 34
2019 77 18 25 7 85 18 32 6 166 48 121 34
2020 87 27 26 7 91 31 25 13 185 59 140 44
2021 95 25 0 0 102 27 32 10 219 56 164 39
Police full-time law enforcement employees
Year ColumbusAnaheim
2021 0 550
2020 2,277 556
2019 0 592
2018 2,255 597
2017 1,937 602
2016 0 562
2015 2,205 577
2014 2,203 550
2013 2,181 518
2012 2,138 506
2011 2,114 527
2010 0 548
2009 2,179 609
2008 0 606
2007 0 582
2006 2,178 579
2005 2,136 559
2004 0 586
2003 2,150 557
Police full-time law enforcement employees (per 1,000 residents)
Year ColumbusAnaheim
2021 0.0 1.5
2020 2.5 1.6
2019 0.0 1.7
2018 2.5 1.7
2017 2.2 1.7
2016 0.0 1.6
2015 2.6 1.7
2014 2.7 1.6
2013 2.7 1.5
2012 2.7 1.5
2011 2.7 1.5
2010 0.0 1.6
2009 2.9 1.8
2008 0.0 1.8
2007 0.0 1.7
2006 3.0 1.7
2005 2.9 1.7
2004 0.0 1.7
2003 3.0 1.7
Local government: full-time employees
Job ColumbusAnaheim
Correction 71 9
Financial administration 312 65
Firefighters 1,574 182
Fire - other 50 69
Health 431 0
Judicial and legal 453 33
Other and unallocable 408 80
Other government administration 571 131
Parks and recreation 326 132
Police - other 368 146
Police protection - officers 1,925 361
Sewerage 429 20
Solid waste management 199 41
Streets and highways 461 70
Totals for government 8,465 1,738
Water supply 412 62
Welfare 309 0
Local government: part-time employees
Job ColumbusAnaheim
Correction 4 0
Financial administration 9 9
Fire - other 7 17
Health 45 0
Judicial and legal 32 0
Other and unallocable 33 33
Other government administration 33 37
Parks and recreation 398 700
Police - other 10 111
Sewerage 2 0
Solid waste management 0 27
Streets and highways 7 8
Totals for government 608 1,094
Water supply 11 2
Welfare 15 0
Place of birth - Foreign born
Residents ColumbusAnaheim
All residents 15.1% 36.8%
American Indian / Alaska Native residents 44.9% 40.6%
Asian residents 76.3% 63.9%
Black or African American residents 20.9% 17.3%
Native Hawaiian / Pacific Islander residents 5.8% 31.8%
Other race residents 38.8% 44.0%
Two or more races residents 13.7% 32.7%
White residents 3.5% 15.8%
White alone, not Hispanic / Latino residents 3.4% 11.7%
Place of birth - Native, outside of US
Residents ColumbusAnaheim
All residents 1.6% 2.2%
American Indian / Alaska Native residents 3.4% 3.2%
Asian residents 0.7% 2.1%
Black or African American residents 1.6% 5.0%
Native Hawaiian / Pacific Islander residents 0.0% 19.1%
Other race residents 4.8% 1.4%
Two or more races residents 2.4% 2.4%
White residents 1.0% 1.1%
White alone, not Hispanic / Latino residents 0.6% 1.3%
Place of birth - Born in state of residence
Residents ColumbusAnaheim
All residents 62.5% 52.2%
American Indian / Alaska Native residents 37.9% 51.8%
Asian residents 14.2% 31.6%
Black or African American residents 59.3% 52.9%
Native Hawaiian / Pacific Islander residents 82.5% 44.3%
Other race residents 38.8% 52.0%
Two or more races residents 65.3% 59.6%
White residents 71.0% 64.9%
White alone, not Hispanic / Latino residents 71.2% 59.1%
Place of birth - Born in other state
Residents ColumbusAnaheim
All residents 20.8% 8.9%
American Indian / Alaska Native residents 13.7% 4.4%
Asian residents 8.8% 2.4%
Black or African American residents 18.2% 24.8%
Native Hawaiian / Pacific Islander residents 11.7% 4.8%
Other race residents 17.6% 2.5%
Two or more races residents 18.6% 5.3%
White residents 24.5% 18.2%
White alone, not Hispanic / Latino residents 24.8% 27.8%
English speakers (speaking English at home)
Type Columbus Anaheim
Born in the United States residents 93.7% 86.3%
Foreign born residents 16.6% 6.9%
Native, born elsewhere residents 56.3% 51.7%
Total residents 83.6% 40.6%
Mechanisms of homicide
Mechanism ColumbusAnaheim
Homicides from 2000 to 2006 650 569
Cut / Pierce 68 91
Firearm 455 348
Suffocation 0 23
Mechanisms of homicide per 1,000,000 residents
Mechanism ColumbusAnaheim
Homicides from 2000 to 2006 85.1 27.8
Cut / Pierce 8.9 4.4
Firearm 59.6 17.0
Suffocation 0 1.1
Mechanisms of suicide per 1,000,000 residents
Mechanism ColumbusAnaheim
Suicides from 2000 to 2006 100.0 79.3
Cut / Pierce 0 1.7
Drowning 0 1.2
Fall 2.9 3.2
Firearm 47.6 32.7
Poisoning 19.6 17.6
Suffocation 24.0 19.5

Infrastructure

Columbus is known for its impressive infrastructure, featuring a mix of contemporary and historical buildings. The city also has a good road network and an international airport. Anaheim offers world-class hospitality facilities and a solid infrastructure supporting the entertainment and tourism sectors.
Infrastructure
Type Columbus Anaheim
Hospitals 47 22
TV stations 14 6
Arenas or stadiums 3 2
Bank branches located here 200 46
Bank institutions located here 25 19
Main business address for public companies 23 7
Drinking water stations with no reported violations in the past 17 1
Drinking water stations with reported violations in the past 40 3

Schools

School facilities
Type Columbus Anaheim
Private elementary/middle schools 34 20
Private high schools 12 8
Public elementary/middle schools 162 53
Public high schools 64 13
Colleges/Universities 37 13
HMDA - Conventional home purchase loans - Applications denied
Year ColumbusAnaheim
1999 2,450 914
2000 2,376 679
2001 1,897 632
2002 1,483 735
2003 2,087 1,047
2004 3,216 1,456
2005 4,275 1,965
2006 4,662 1,999
2007 2,679 1,230
2008 1,015 599
2009 555 378

Culture and Food

Both cities have a vibrant cultural scene. Columbus is known for its arts scene, with various festivals throughout the year and distinctive culinary experiences hinging on its Midwestern roots. Anaheim also offers a rich cultural experience, featuring a mix of traditional California cuisines and international food cultures thanks to its diverse demographic.

Sports Teams

Columbus is home to several professional sports teams, including the Columbus Blue Jackets (NHL) and Columbus Crew SC (MLS). Anaheim hosts the Anaheim Ducks (NHL) and Los Angeles Angels (MLB).