Columbus, Ohio and Little Rock, Arkansas constitute two unique experiences for both residents and tourists. The rhythm of life, costs, job opportunities, and even climate vary. The relative benefits and flaws of each depend on individual lifestyles, career aspirations, preferred climates, and particular tastes in culture and entertainment. Both cities have distinct flavors of life and offer unique opportunities for living, working, and visiting.
Distance between
Columbus, OH and
Little Rock, AR : 627.8 miles
Columbus's population is larger by 349%. Its population has grown by 195,058 people (27.4%) since 2000. The population of Little Rock has grown by 18,865 people (10.3%) during that time.
In terms of safety and crime, both Columbus and Little Rock have their challenges. Statistically, Little Rock experiences a higher crime rate when compared to Columbus. While Columbus also has areas of high crime, the city also features numerous safe and secure neighborhoods. Residents and visitors alike should stay informed and take general precautions.
City-data.com crime index counts serious crimes and violent crime more heavily. It adjusts for the number of visitors and daily workers commuting into cities. (higher means more crime, U.S. average = 301.1)
City-data.com crime index counts serious crimes and violent crime more heavily. It adjusts for the number of visitors and daily workers commuting into cities. (higher means more crime, U.S. average = 301.1)
Sex Offenders
According to our data, there are 1,506 registered sex offenders living in Columbus and 488 registered sex offenders living in . The ratio of residents to sex offenders in Columbus is 573 to 1; the ratio in Little Rock is 406 to 1. The number of registered sex offenders compared to the number of residents is a smaller in Columbus than in Little Rock.
Cost of Living
The cost of living is generally lower in Little Rock compared to Columbus. Residents in Little Rock pay less on average for housing, groceries, and healthcare. However, there is a balance in terms of income, with Columbus boasting higher median household incomes compared to Little Rock.
Income Tax
There's a difference in the city and state income tax as well. Ohio has a progressive income tax, which means the rate goes up with income, and Columbus residents pay a local income tax of 2.5%. Arkansas has a marginal income tax, with rates ranging from 2% to 6.6%, but Little Rock does not charge a local income tax.
Property Tax
The average property tax rate is lower in Little Rock compared to Columbus, and Arkansas also offers a homestead property tax credit, which Ohio does not.
Sales Tax
Little Rock has a higher combined city and state sales tax rate at 9.65%, compared to Columbus's rate of 7.5%. For residents and shoppers, this means goods and services tend to cost slightly more in Little Rock than in Columbus.
Income
Type
Columbus
Little Rock
Estimated median household income
$58,202
$53,565
Estimated per capita income
$32,392
$39,600
Cost of living index (U.S. average is 100)
96.1
85.1
If you make $50,000 in Little Rock, you will have to make $56,463 in Columbus to maintain the same standard of living.
Geographical Conditions
Columbus is mostly flat, located in the Great Plains region, which is conducive to biking and walking. Little Rock is more varied, with hilly terrain and proximity to the Ouachita Mountains, offering plenty of opportunities for outdoor activities.
Both cities have strong educational institutions. Columbus is home to The Ohio State University, one of the largest universities in the US. Little Rock hosts the University of Arkansas at Little Rock. Columbus has a higher graduation rate and more top-rated schools overall, making it a better option for families prioritizing education.
The economies of both cities are diverse, though Columbus has a slightly stronger job market. Key industries in Columbus include education, government, insurance, banking, defense, aviation, food, logistics, steel, energy, medical research, health care, hospitality, retail, and technology. Little Rock’s economy, on the other hand, is based primarily on the government, non-profit organizations, health care, and small businesses.
Biggest Employers
Key employers in Columbus include The Ohio State University, the federal and state government, JP Morgan Chase & Co., Nationwide, and American Electric Power. In Little Rock, some of the top employers include the State of Arkansas, Baptist Health, University of Arkansas for Medical Sciences, and the Federal Government.
There were 913 building permits issued in Columbus in 2012 (246 more than in 2011) compared to 666 building permits issued in Little Rock in 2012 (341 more than in 2011).
In Columbus (Franklin County), 60.8% voted for Democrats and 37.9% for Republicans in 2012 Presidential Election. In Little Rock (Pulaski County), 54.7% voted for Democrats and 43.3% for Republicans.
Elections
Type
Democrats
Republicans
Other
Year
Columbus
Little Rock
Columbus
Little Rock
Columbus
Little Rock
2020
64.7%
60.5%
33.4%
37.8%
1.9%
1.7%
2016
59.8%
56.1%
33.9%
38.3%
6.2%
5.6%
2012
60.8%
54.7%
37.9%
43.3%
1.3%
2.0%
2008
59.8%
55.3%
39.0%
43.7%
1.2%
0.9%
2004
54.5%
55.2%
45.2%
44.4%
0.3%
0.4%
2000
48.9%
53.8%
47.9%
44.0%
3.2%
2.2%
1996
48.1%
58.8%
44.5%
35.1%
7.3%
6.2%
Breakdown of population affiliated with a religious congregation
Type
Adherents
Congregations
Religion
Columbus
Little Rock
Columbus
Little Rock
CATHOLIC CHURCH
13.2%
6.3%
5.6%
2.7%
EVANGELICAL LUTHERAN CHURCH IN AMERICA
1.6%
0.1%
3.7%
0.4%
SOUTHERN BAPTIST CONVENTION
1.6%
17.8%
6.8%
21.0%
MUSLIM ESTIMATE
1.3%
0.2%
1.9%
0.4%
VINEYARD USA
1.3%
0.0%
1.2%
0.0%
AMERICAN BAPTIST CHURCHES IN THE USA
1.0%
0.0%
3.3%
0.0%
EPISCOPAL CHURCH
0.4%
1.1%
1.3%
1.6%
SEVENTH DAY ADVENTIST CHURCH
0.4%
0.4%
2.0%
0.9%
LUTHERAN CHURCH
0.2%
0.5%
1.0%
1.3%
Weather
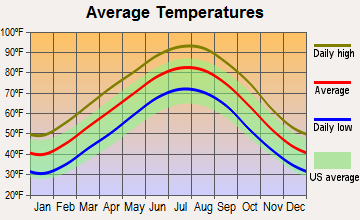
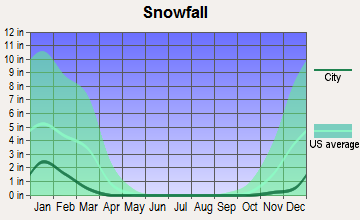
One of the key differences between Columbus and Little Rock is the weather. Columbus has a humid continental climate with all four seasons, including cold winters with snow and warm, humid summers. In contrast, Little Rock experiences a subtropical climate. Winters are usually milder, and summers are hot and humid, with temperatures often reaching 90s Fahrenheit.
Weather and climate
Type
Columbus
Little Rock
Temperature - Average
52.8°F
62.3°F
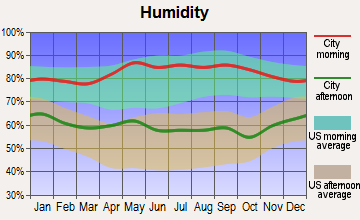
Humidity - Average morning or afternoon humidity
74.8%
76.2%
Humidity - Differences between morning and afternoon humidity
34%
35%
Humidity - Maximum monthly morning or afternoon humidity
86%
88%
Humidity - Minimum monthly morning or afternoon humidity
52%
53%
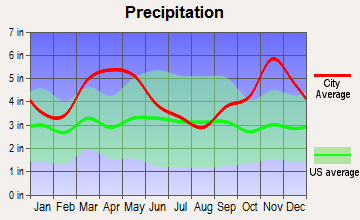
Precipitation - Yearly average
39.3 in
51.4 in
Snowfall - Yearly average
56.6 in
9.4 in
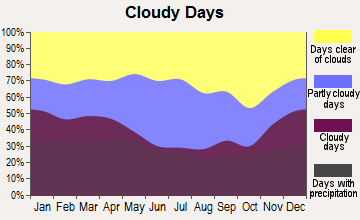
Clouds - Number of days clear of clouds
12%
19.8%
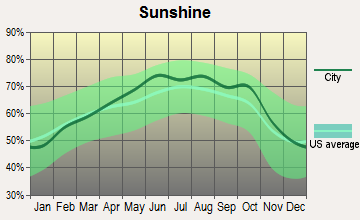
Sunshine amount - Average
49.7%
74%
Sunshine amount - Differences during a year
27%
30%
Sunshine amount - Maximum monthly
55%
82%
Sunshine amount - Minimum monthly
28%
52%
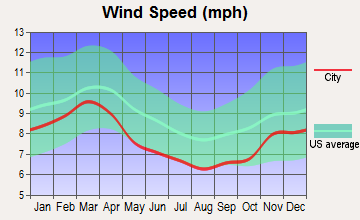
Wind speed - Average
8.2 mph
7.6 mph
Average climate in Columbus, Ohio
Average climate in Little Rock, Arkansas
Air pollution
Type
AQI
CO
NO2
OZONE
PM10
PM25
SO2
Year
Columbus
Little Rock
Columbus
Little Rock
Columbus
Little Rock
Columbus
Little Rock
Columbus
Columbus
Little Rock
Columbus
Little Rock
2018
69
67
0.11
0.29
10.0
7.3
33.8
24.7
N/A
N/A
6.0
9.2
0.0
0.6
2017
68
70
0.16
0.41
9.6
7.6
28.7
25.5
N/A
N/A
5.5
9.5
0.1
0.6
2016
76
64
0.17
0.30
10.6
7.9
28.5
25.4
N/A
N/A
5.6
8.7
0.1
0.6
2015
74
64
0.16
0.31
11.3
8.6
27.0
22.8
N/A
N/A
6.1
9.0
0.1
1.1
2014
82
69
0.20
0.35
11.0
8.9
28.5
22.6
N/A
N/A
7.4
9.4
0.5
1.2
2013
78
70
N/A
0.39
8.9
9.8
29.6
24.7
N/A
N/A
7.8
9.5
0.6
1.3
2012
87
81
N/A
0.47
N/A
10.6
32.9
25.8
N/A
N/A
8.9
9.9
N/A
1.3
2011
89
81
N/A
0.45
N/A
10.0
28.1
25.5
N/A
N/A
8.9
11.3
N/A
1.4
2010
90
72
N/A
0.45
N/A
10.0
30.5
24.8
N/A
N/A
9.1
N/A
N/A
1.3
2009
61
62
N/A
0.42
N/A
9.1
28.7
22.0
N/A
N/A
N/A
N/A
N/A
1.7
2008
65
59
N/A
0.44
N/A
9.0
31.2
22.6
N/A
N/A
N/A
N/A
1.8
1.8
2007
80
75
N/A
0.59
N/A
10.8
30.8
22.1
N/A
N/A
N/A
N/A
2.8
3.2
2006
75
75
N/A
0.56
N/A
11.9
30.0
25.3
23.7
N/A
N/A
N/A
3.3
3.2
2005
87
87
N/A
0.39
N/A
12.1
29.6
24.1
27.5
N/A
N/A
N/A
4.1
1.5
2004
77
68
N/A
0.38
N/A
14.1
27.8
20.5
24.6
N/A
N/A
N/A
4.4
2.0
2003
91
78
N/A
0.47
N/A
14.3
26.4
22.0
23.9
N/A
N/A
N/A
4.1
2.3
2002
93
81
N/A
0.59
N/A
15.5
31.3
22.9
25.7
N/A
N/A
N/A
4.1
2.7
2001
84
82
N/A
N/A
N/A
10.4
29.2
25.9
25.9
N/A
N/A
N/A
3.5
N/A
2000
57
78
N/A
N/A
N/A
10.2
N/A
26.0
23.5
N/A
N/A
N/A
3.7
N/A
Natural disasters
Type
Columbus
Little Rock
Tornado activity compared to U.S. average
119.1%
253.3%
Earthquake activity compared to U.S. average
96.1%
579.4%
Natural disasters compared to U.S. average
16%
26%
Transportation
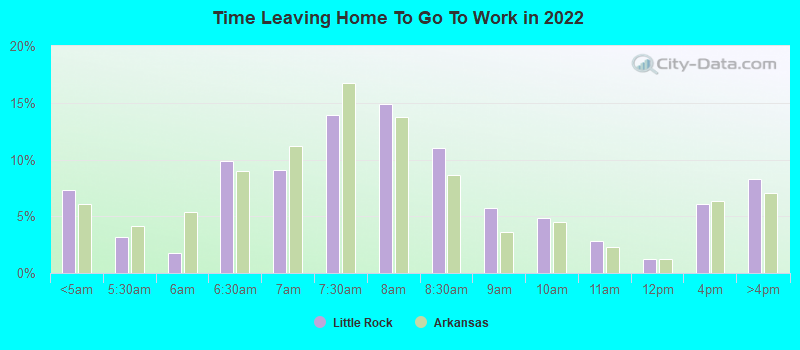
Both cities have bus systems for local public transit. The Central Ohio Transit Authority serves Columbus, and Rock Region Metro serves Little Rock. However, Columbus offers more options for public transit, including a free downtown circulator bus and multiple park and ride lots. Commuting in Columbus generally takes less time than in Little Rock.
Transport
Type
Columbus
Little Rock
Amtrak stations
1
1
Amtrak stations nearby
1
1
FAA registered aircraft
415
259
FAA registered aircraft manufacturers and dealers
4
35
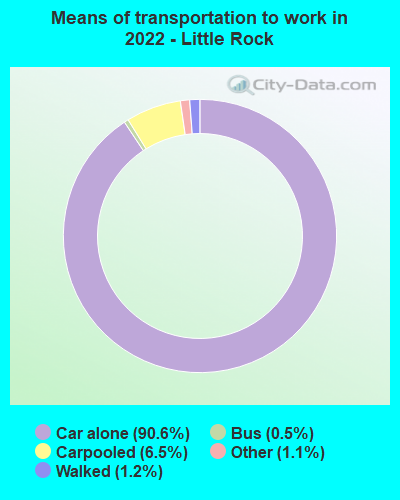
Means of transportation to work
Type
Columbus
Little Rock
Bicycle
0.6%
0.1%
Bus
1.6%
0.4%
Carpooled
7.4%
9.7%
Car alone
86.7%
88.1%
Motorcycle
0%
0.1%
Taxicab
0.1%
0.3%
Walked
2.2%
0.9%
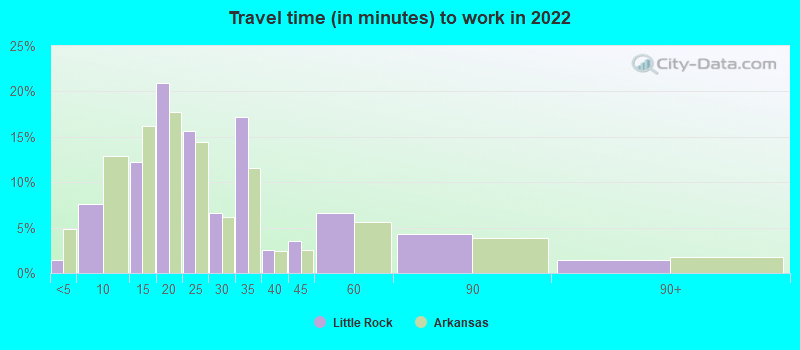
Average travel time to work
Type
Columbus
Little Rock
Average
26.1 min
26 min
Other means
21.7 min
20 min
Public transportation
35.4 min
36.2 min
Private vehicle occupancy
Type
Columbus
Little Rock
Average
1.1
1.2
Drove alone
90.7%
87.6%
In 2 person carpool
7.3%
8.3%
In 3 person carpool
1.4%
1.3%
In 4 person carpool
0.5%
0.9%
In 5-6 person carpool
0.1%
1.5%
In 7+ person carpool
0.1%
0.3%
How many people usually rode to work in the car, truck or van.
Real Estate
The real estate market in both cities varies. Properties in Columbus command higher prices than those in Little Rock. However, Columbus tends to offer a better return on investment and quicker appreciation.
Neighborhoods
Both cities offer a variety of neighborhoods to suit different lifestyles. Downtown Columbus is vibrant and full of arts and entertainment options, while suburbs like Dublin and New Albany offer family-friendly environments. In Little Rock, the Hillcrest and Heights neighborhoods offer a mix of historic and modern homes close to shopping and dining options.
Houses and residents
Type
Columbus
Little Rock
Houses
422,120
99,876
Average household size (people)
2.3
2.3
Median year apartment built
1982
1981
Median year house/condo built
1977
1977
Length of stay in the house since moving in
12.6 years
12.9 years
Houses occupied
390,605 (92.5%)
89,422 (89.5%)
Houses occupied by owners
175,427 (44.9%)
49,236 (55.1%)
Houses occupied by renters
215,178 (55.1%)
40,186 (44.9%)
Median rent asked for vacant for-rent units
$1,371
$706.04
Median monthly housing costs
$1,110
$990
Median price asked for vacant for-sale houses and condos
$195,022
$243,385
Estimated median house or condo value
$219,200
$191,700
Median numbers of rooms
5
5.3
Median number of rooms in apartments
4.2
3.9
Median number of rooms in houses and condos
6.3
6.3
Median house price - detached houses
$233,452
$274,395
Median house price - in 2-unit structures
$121,729
$152,806
Median house price - in 3-to-4-unit structures
$215,337
$175,185
Median house price - in 5 or more unit structures
$240,711
$451,067
Median house price - mobile homes
$121,578
$35,528
Median house price - Townhouses or other attached units
$218,726
$160,142
Median house price - All housing units
$229,736
$271,664
Median house age
42
43
Renting percentage
53%
43.8%
Housing density (houses/condos per square mile)
2,007.5
859.5
House value disparities
30.2%
43.1%
Household income disparities
42.4%
49.3%
Median household income for houses/condes with a mortgage
$89,058
$98,030
Median household income for apartments without a mortgage
$59,295
$64,425
Housing units without a mortgage
4,290 (3.3%)
623 (1.9%)
Housing units with both a second mortgage and home equity loan
10,651 (8.2%)
1,588 (4.8%)
Housing units with a mortgage
125,487 (96.7%)
32,138 (98.1%)
Housing units with a home equity loan
775 (0.6%)
75 (0.2%)
Housing units with a second mortgage
13,558 (10.4%)
2,366 (7.2%)
House/condo owner moved in on average (years ago)
10
11
House/condo renter moved in on average (years ago)
1
1
Housing units lacking complete kitchen facilities
1.6%
2.1%
Housing units lacking complete plumbing facilities
1.3%
0.8%
Housing units in structures
Housing units in structures
Columbus
Little Rock
One, detached
45.8%
61.4%
One, attached
9.1%
2.2%
Two
4.0%
1.9%
3 or 4
8.6%
4.1%
5 to 9
11.8%
8.6%
10 to 19
8.6%
4.9%
20 to 49
4.5%
3.8%
50 or more
6.8%
11.2%
Mobile homes
0.8%
2.0%
Boats, RVs, vans, etc.
0.1%
0.0%
Median real estate property taxes paid for housing units
Self-employed workers in own not incorporated business
20,915
4,725
State government workers
31,881
9,860
Unpaid family workers
724
160
Industries and Occupations
Columbus hosts a variety of industries such as education, insurance, banking, fashion, defense, aviation, food, and logistics. In Little Rock, government and non-profit organizations, followed by health care, dominate the employment landscape.
Health care is another critical aspect to consider. Columbus is home to renowned health facilities like the Ohio State University Wexner Medical Center and Nationwide Children’s Hospital. Little Rock is home to the University of Arkansas for Medical Sciences, Baptist Health Medical Center, and Arkansas Heart Hospital.
Health (county statistics)
Type
Columbus
Little Rock
General health status score of residents in this county from 1 (poor) to 5 (excellent)
Both cities have seen investment in their infrastructure in recent years. Columbus has been making strides in smart technology investment, leading in smart city initiatives across the country. Little Rock has also been improving its city infrastructure, with some focus on bettering transportation, water systems, and community facilities.
Infrastructure
Type
Columbus
Little Rock
Hospitals
47
15
TV stations
14
17
Arenas or stadiums
3
2
Bank branches located here
200
139
Bank institutions located here
25
29
Main business address for public companies
23
4
Drinking water stations with no reported violations in the past
17
0
Drinking water stations with reported violations in the past
HMDA - Conventional home purchase loans - Applications denied
Year
Columbus
Little Rock
1999
2,450
842
2000
2,376
792
2001
1,897
634
2002
1,483
365
2003
2,087
510
2004
3,216
581
2005
4,275
837
2006
4,662
881
2007
2,679
503
2008
1,015
230
2009
555
114
Culture and Food
Columbus has a robust arts scene and multiple cultural institutions, including the Columbus Museum of Art and COSI, a large science museum. The food scene is diverse and dynamic, with a strong farm-to-table presence and international cuisine. Little Rock, too, has its share of cultural moments, including the Clinton Presidential Center and Heifer Village. The food scene in Little Rock thrives on southern cuisine, local beer, and international flavors too.
Sports Teams
Sports fans have options in both cities. Columbus boasts professional teams like the Columbus Blue Jackets (NHL) and Columbus Crew SC (MLS), as well as Ohio State University's athletics. Little Rock doesn't have any professional sports teams but does have the Arkansas Travelers Minor League Baseball team and the Trojans at the University of Arkansas at Little Rock.


 Columbus, OH
 Little Rock, AR