Both Columbus, OH, and Raleigh, NC, are vibrant, up-and-coming cities with a host of opportunities and amenities. Each offers a unique lifestyle, shaped by factors such as crime/safety rates, weather, cost of living, and educational opportunities. The economy and infrastructure of both cities attract people looking for a balance of cultural offerings, work opportunities, and welcoming communities. This comparison will delve into these aspects to provide a comprehensive understanding of what life could look like in either city.
Distance between
Columbus, OH and
Raleigh, NC : 373.0 miles
Columbus's population is larger by 93%. Its population has grown by 195,058 people (27.4%) since 2000. The population of Raleigh has grown by 193,031 people (69.9%) during that time.
Although both cities have crime rates slightly higher than the national average, Raleigh's rates are generally lower than Columbus's. Raleigh's violent crime rate is significantly lower, making it overall a safer option. However, both cities have numerous safe neighborhoods and take measures to control crime. Remember, crime rates can vary dramatically from neighborhood to neighborhood within any city.
City-data.com crime index counts serious crimes and violent crime more heavily. It adjusts for the number of visitors and daily workers commuting into cities. (higher means more crime, U.S. average = 301.1)
City-data.com crime index counts serious crimes and violent crime more heavily. It adjusts for the number of visitors and daily workers commuting into cities. (higher means more crime, U.S. average = 301.1)
Sex Offenders
According to our data, there are 1,506 registered sex offenders living in Columbus and 2,158 registered sex offenders living in . The ratio of residents to sex offenders in Columbus is 573 to 1; the ratio in Raleigh is 213 to 1. The number of registered sex offenders compared to the number of residents is a lot smaller in Columbus than in Raleigh.
Cost of Living
Columbus tends to have a lower overall cost of living when compared to Raleigh. This lower cost extends to essentials such as housing, groceries, and health services. However, Raleigh has been praised for its economic stability, which can potentially offer higher salaries to offset the cost.
Income Tax
Ohio has a progressive income tax, and Columbus also imposes a city income tax. North Carolina has a flat income tax rate, overall lower than Ohio's, which is an advantage for Raleigh residents.
Property Tax
Property tax in Columbus is higher than the national average, but lower than in many large U.S cities. Conversely, Raleigh's property tax rates align with the national average.
Sales Tax
Columbus has a higher sales tax rate than Raleigh. Ohio's sales tax rate at state and city levels adds up to 7.5%, while North Carolina's combined rate is about 7.25%.
Income
Type
Columbus
Raleigh
Estimated median household income
$58,202
$74,612
Estimated per capita income
$32,392
$44,001
Cost of living index (U.S. average is 100)
96.1
95.1
If you make $50,000 in Raleigh, you will have to make $50,526 in Columbus to maintain the same standard of living.
Geographical Conditions
Columbus is flat, located in the Great Plains region, ideal for farming and agriculture. Raleigh is located in the Atlantic Coastal Plain, offering a variety of landscapes from the mountains to the coast.
Both cities are known for their educational opportunities. Columbus is home to Ohio State University, one of the largest universities in the U.S, while Raleigh is part of North Carolina's Research Triangle, renowned for its higher education and research institutions. Both cities also have highly rated public and private schools.
Columbus is a strong economic hub with a diverse economy, boasting sectors such as education, government, insurance, banking, fashion, defense, aviation, food, logistics, steel, energy, medical research, healthcare, hospitality, retail, and technology. Raleigh's economy is based on sectors such as banking/financial services, pharmaceuticals, paper products, food processing, clothing/apparel, telecommunication equipment, electrical equipment, and tourism.
Biggest Employers
The biggest employers in Columbus are the State of Ohio, the Ohio State University, and Nationwide Insurance. In Raleigh, the major employers are the State of North Carolina, Wake County Public School system, and North Carolina State University.
There were 913 building permits issued in Columbus in 2012 (246 more than in 2011) compared to 1,354 building permits issued in Raleigh in 2012 (366 more than in 2011).
In Columbus (Franklin County), 60.8% voted for Democrats and 37.9% for Republicans in 2012 Presidential Election. In Raleigh (Wake County), 54.9% voted for Democrats and 43.5% for Republicans.
Elections
Type
Democrats
Republicans
Other
Year
Columbus
Raleigh
Columbus
Raleigh
Columbus
Raleigh
2020
64.7%
62.3%
33.4%
35.9%
1.9%
1.8%
2016
59.8%
57.4%
33.9%
37.2%
6.2%
5.5%
2012
60.8%
54.9%
37.9%
43.5%
1.3%
1.6%
2008
59.8%
56.8%
39.0%
42.3%
1.2%
0.9%
2004
54.5%
48.7%
45.2%
50.9%
0.3%
0.4%
2000
48.9%
46.1%
47.9%
53.2%
3.2%
0.7%
1996
48.1%
45.9%
44.5%
48.2%
7.3%
5.9%
Breakdown of population affiliated with a religious congregation
Type
Adherents
Congregations
Religion
Columbus
Raleigh
Columbus
Raleigh
CATHOLIC CHURCH
13.2%
11.0%
5.6%
2.4%
EVANGELICAL LUTHERAN CHURCH IN AMERICA
1.6%
0.6%
3.7%
1.1%
SOUTHERN BAPTIST CONVENTION
1.6%
9.0%
6.8%
22.5%
MUSLIM ESTIMATE
1.3%
1.1%
1.9%
1.0%
VINEYARD USA
1.3%
0.1%
1.2%
0.6%
AMERICAN BAPTIST CHURCHES IN THE USA
1.0%
0.4%
3.3%
0.6%
EPISCOPAL CHURCH
0.4%
1.1%
1.3%
1.8%
SEVENTH DAY ADVENTIST CHURCH
0.4%
0.2%
2.0%
1.0%
LUTHERAN CHURCH
0.2%
0.4%
1.0%
0.6%
Weather
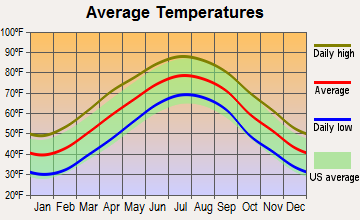
Columbus displays a typical Midwestern climate with cold, snowy winters and hot, humid summers. In contrast, Raleigh enjoys a subtropical climate with mild winters and long, hot, and humid summers. Raleigh also gets more sunny days per year than Columbus.
Weather and climate
Type
Columbus
Raleigh
Temperature - Average
52.8°F
59.8°F
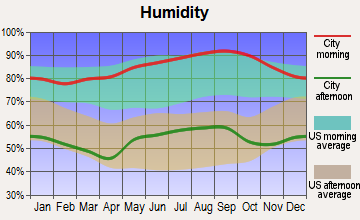
Humidity - Average morning or afternoon humidity
74.8%
73.7%
Humidity - Differences between morning and afternoon humidity
34%
44%
Humidity - Maximum monthly morning or afternoon humidity
86%
90%
Humidity - Minimum monthly morning or afternoon humidity
52%
46%
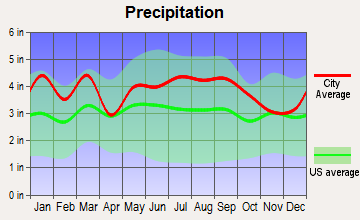
Precipitation - Yearly average
39.3 in
46.2 in
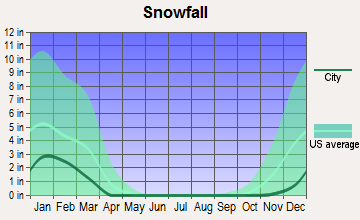
Snowfall - Yearly average
56.6 in
13.4 in
Clouds - Number of days clear of clouds
12%
18.5%
Sunshine amount - Average
49.7%
63.9%
Sunshine amount - Differences during a year
27%
13%
Sunshine amount - Maximum monthly
55%
64%
Sunshine amount - Minimum monthly
28%
51%
Wind speed - Average
8.2 mph
7.1 mph
Average climate in Columbus, Ohio
Average climate in Raleigh, North Carolina
Air pollution
Type
AQI
CO
NO2
OZONE
PM10
PM25
SO2
Year
Columbus
Raleigh
Columbus
Raleigh
Columbus
Raleigh
Columbus
Raleigh
Columbus
Raleigh
Columbus
Raleigh
Columbus
Raleigh
2018
69
71
0.11
0.23
10.0
4.9
33.8
27.5
N/A
14.6
6.0
9.5
0.0
0.2
2017
68
70
0.16
0.23
9.6
5.5
28.7
25.8
N/A
14.7
5.5
9.3
0.1
0.2
2016
76
80
0.17
0.23
10.6
5.6
28.5
26.9
N/A
8.7
5.6
10.0
0.1
0.3
2015
74
79
0.16
0.27
11.3
5.7
27.0
28.6
N/A
12.4
6.1
11.0
0.1
0.3
2014
82
74
0.20
0.26
11.0
6.0
28.5
29.9
N/A
N/A
7.4
11.2
0.5
0.3
2013
78
72
N/A
0.26
8.9
N/A
29.6
26.9
N/A
N/A
7.8
10.7
0.6
0.4
2012
87
80
N/A
0.28
N/A
N/A
32.9
29.7
N/A
N/A
8.9
9.5
N/A
0.6
2011
89
84
N/A
0.27
N/A
N/A
28.1
32.9
N/A
N/A
8.9
10.3
N/A
0.7
2010
90
89
N/A
0.30
N/A
N/A
30.5
32.4
N/A
N/A
9.1
10.9
N/A
1.0
2009
61
77
N/A
0.30
N/A
N/A
28.7
27.8
N/A
N/A
N/A
10.3
N/A
1.0
2008
65
99
N/A
0.36
N/A
N/A
31.2
32.3
N/A
N/A
N/A
12.5
1.8
1.4
2007
80
98
N/A
0.40
N/A
N/A
30.8
35.7
N/A
N/A
N/A
13.9
2.8
1.2
2006
75
90
N/A
0.44
N/A
N/A
30.0
31.9
23.7
N/A
N/A
13.5
3.3
0.9
2005
87
80
N/A
0.38
N/A
N/A
29.6
33.9
27.5
N/A
N/A
N/A
4.1
2.5
2004
77
82
N/A
0.40
N/A
N/A
27.8
28.4
24.6
N/A
N/A
N/A
4.4
2.6
2003
91
82
N/A
N/A
N/A
N/A
26.4
29.9
23.9
N/A
N/A
N/A
4.1
3.0
2002
93
89
N/A
N/A
N/A
N/A
31.3
36.1
25.7
N/A
N/A
N/A
4.1
2.6
2001
84
128
N/A
N/A
N/A
N/A
29.2
34.5
25.9
N/A
N/A
N/A
3.5
N/A
2000
57
115
N/A
0.64
N/A
N/A
N/A
34.1
23.5
N/A
N/A
N/A
3.7
N/A
Natural disasters
Type
Columbus
Raleigh
Tornado activity compared to U.S. average
119.1%
95.1%
Earthquake activity compared to U.S. average
96.1%
52.6%
Natural disasters compared to U.S. average
16%
18%
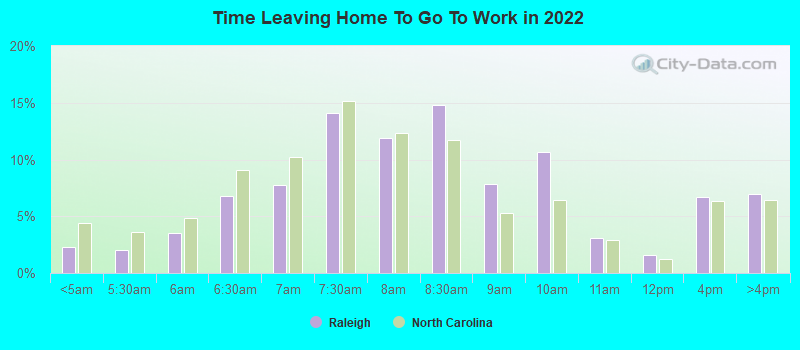
Transportation
Columbus is served by Central Ohio Transit Authority (COTA) which provides bus services, and it is also a bike-friendly city. Raleigh also has a well-organized public transit system, including buses and bikes, with progress being made on a future light rail system.
Transport
Type
Columbus
Raleigh
Amtrak stations
1
1
Amtrak stations nearby
1
3
FAA registered aircraft
415
499
FAA registered aircraft manufacturers and dealers
4
12
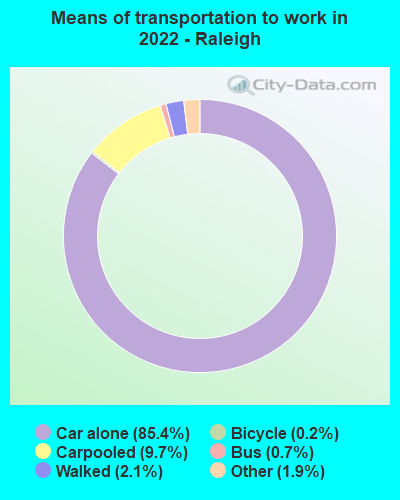
Means of transportation to work
Type
Columbus
Raleigh
Bicycle
0.6%
0.2%
Bus
1.6%
1.1%
Carpooled
7.4%
8.5%
Car alone
86.7%
87.4%
Motorcycle
0%
0.1%
Taxicab
0.1%
0.3%
Walked
2.2%
1.1%
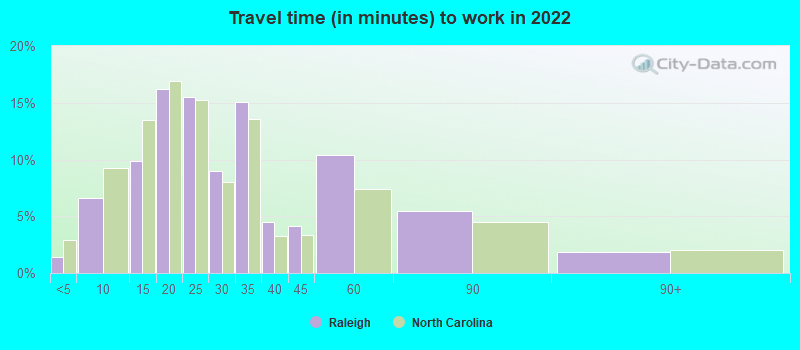
Average travel time to work
Type
Columbus
Raleigh
Average
26.1 min
29.4 min
Other means
21.7 min
22.5 min
Public transportation
35.4 min
39.9 min
Private vehicle occupancy
Type
Columbus
Raleigh
Average
1.1
1.1
Drove alone
90.7%
90.1%
In 2 person carpool
7.3%
7.6%
In 3 person carpool
1.4%
1.4%
In 4 person carpool
0.5%
0.3%
In 5-6 person carpool
0.1%
0.6%
How many people usually rode to work in the car, truck or van.
Real Estate
Both cities have seen a growth in their real estate markets. Columbus real estate tends towards affordability, with the median home price below national average. In contrast, Raleigh's real estate market is more expensive, but the houses usually come with larger property areas.
Neighborhoods
Both cities feature diverse neighborhoods. In Columbus, neighborhoods like German Village, Short North, and downtown exhibit a blend of historic and modern living. Raleigh, on the other hand, has historic neighborhoods like Oakwood, vibrant areas like Glenwood South, and upscale communities such as North Hills.
Houses and residents
Type
Columbus
Raleigh
Houses
422,120
217,866
Average household size (people)
2.3
2.4
Median year apartment built
1982
1995
Median year house/condo built
1977
1995
Length of stay in the house since moving in
12.6 years
11.5 years
Houses occupied
390,605 (92.5%)
194,917 (89.5%)
Houses occupied by owners
175,427 (44.9%)
103,367 (53%)
Houses occupied by renters
215,178 (55.1%)
91,550 (47%)
Median rent asked for vacant for-rent units
$1,371
$1,740
Median monthly housing costs
$1,110
$1,298
Median price asked for vacant for-sale houses and condos
$195,022
$302,120
Estimated median house or condo value
$219,200
$340,200
Median numbers of rooms
5
5.1
Median number of rooms in apartments
4.2
3.9
Median number of rooms in houses and condos
6.3
6.7
Median house price - detached houses
$233,452
$446,507
Median house price - in 2-unit structures
$121,729
$403,968
Median house price - in 3-to-4-unit structures
$215,337
$170,635
Median house price - in 5 or more unit structures
$240,711
$306,998
Median house price - mobile homes
$121,578
$31,622
Median house price - Townhouses or other attached units
$218,726
$292,086
Median house price - All housing units
$229,736
$404,828
Median house age
42
26
Renting percentage
53%
46.5%
Housing density (houses/condos per square mile)
2,007.5
1,901.1
House value disparities
30.2%
30.8%
Household income disparities
42.4%
45.4%
Median household income for houses/condes with a mortgage
$89,058
$114,680
Median household income for apartments without a mortgage
$59,295
$81,716
Housing units without a mortgage
4,290 (3.3%)
1,689 (2.1%)
Housing units with both a second mortgage and home equity loan
10,651 (8.2%)
6,627 (8.2%)
Housing units with a mortgage
125,487 (96.7%)
78,923 (97.9%)
Housing units with a home equity loan
775 (0.6%)
0 (0%)
Housing units with a second mortgage
13,558 (10.4%)
7,783 (9.7%)
House/condo owner moved in on average (years ago)
10
8
House/condo renter moved in on average (years ago)
1
1
Housing units lacking complete kitchen facilities
1.6%
0.6%
Housing units lacking complete plumbing facilities
1.3%
0.5%
Housing units in structures
Housing units in structures
Columbus
Raleigh
One, detached
45.8%
45.0%
One, attached
9.1%
14.0%
Two
4.0%
1.2%
3 or 4
8.6%
4.6%
5 to 9
11.8%
6.3%
10 to 19
8.6%
12.4%
20 to 49
4.5%
6.0%
50 or more
6.8%
9.2%
Mobile homes
0.8%
1.2%
Boats, RVs, vans, etc.
0.1%
0.0%
Median real estate property taxes paid for housing units
Self-employed workers in own not incorporated business
20,915
12,488
State government workers
31,881
19,792
Unpaid family workers
724
523
Industries and Occupations
Top industries in Columbus include education, government, and healthcare, with most people employed in white-collar jobs. Raleigh's biggest industries are technology, healthcare, and education, with many residents working in the Research Triangle Park, one of the country's largest research parks.
Both cities score high in healthcare. Columbus hosts the OhioHealth and Nationwide Children's Hospital, while Raleigh is home to several highly rated hospitals including the Duke University Hospital and UNC Medical Center.
Health (county statistics)
Type
Columbus
Raleigh
General health status score of residents in this county from 1 (poor) to 5 (excellent)
Columbus boasts a well-developed infrastructure, with robust public transportation, strong internet connectivity, and a growing focus on sustainability. Raleigh also rates highly for its infrastructure, particularly public services and transportation, including the Raleigh-Durham International Airport.
Infrastructure
Type
Columbus
Raleigh
Hospitals
47
19
TV stations
14
20
Arenas or stadiums
3
3
Bank branches located here
200
136
Bank institutions located here
25
27
Main business address for public companies
23
21
Nuclear power plants nearby
0
1
Drinking water stations with no reported violations in the past
17
2
Drinking water stations with reported violations in the past
HMDA - Conventional home purchase loans - Applications denied
Year
Columbus
Raleigh
1999
2,450
1,618
2000
2,376
890
2001
1,897
557
2002
1,483
510
2003
2,087
564
2004
3,216
700
2005
4,275
1,083
2006
4,662
1,097
2007
2,679
859
2008
1,015
424
2009
555
253
Culture and Food
Columbus offers a rich cultural scene with exciting food, arts, and festivals, including the famous arts festival and the jazz and ribs fest. Raleigh is known for its southern hospitality, culinary innovation, and a thriving arts scene.
Sports Teams
Sports fans can celebrate in both cities. Columbus is home to the NHL's Columbus Blue Jackets, and MLS's Columbus Crew. Raleigh is home to the NHL's Carolina Hurricanes, and also enjoys college sports, particularly NCAA basketball.


 Columbus, OH
 Raleigh, NC