Dallas, Texas, and Aurora, Colorado, are two unique cities with their own individual characteristics. Dallas, being one of the largest cities in Texas, offers a very distinct southern charm, while Aurora, often seen as a Denver suburb, weaves a blend of urban and outdoorsy living. The comparison between these two cities spans several dimensions including safety, weather, cost of living, education, economy, infrastructure, and more. There's a lot to unpack, so let's jump right in.
Distance between
Dallas, TX and
Aurora, CO : 652.7 miles
Dallas's population is larger by 231%. Its population has grown by 99,877 people (8.4%) since 2000. The population of Aurora has grown by 112,954 people (40.9%) during that time.
When comparing crime rates, Dallas typically has higher crime rates than Aurora. Both cities have efforts in place to reduce crime, but it's important for individuals considering relocation to look into specific neighborhood crime statistics. Tourists should be aware of their surroundings and follow general safety precautions as in any city.
City-data.com crime index counts serious crimes and violent crime more heavily. It adjusts for the number of visitors and daily workers commuting into cities. (higher means more crime, U.S. average = 301.1)
City-data.com crime index counts serious crimes and violent crime more heavily. It adjusts for the number of visitors and daily workers commuting into cities. (higher means more crime, U.S. average = 301.1)
Sex Offenders
According to our data, there are 4,297 registered sex offenders living in Dallas and 1,043 registered sex offenders living in . The ratio of residents to sex offenders in Dallas is 307 to 1; the ratio in Aurora is 347 to 1. The number of registered sex offenders compared to the number of residents in Dallas is near to than in Aurora.
Cost of Living
Living in Dallas is generally more affordable than Aurora. While the housing costs in both cities can vary depending on the neighborhood, Dallas typically offers lower cost in terms of utilities, groceries, and healthcare. Aurora's overall cost of living is higher largely due to housing and healthcare costs.
Income Tax
Texas, including Dallas, does not impose state income tax, which is a significant advantage for residents. On the other hand, Colorado imposes a flat state income tax of 4.63%, which applies to Aurora residents.
Property Tax
Property tax rates are higher in Dallas, typically around 2.08%. On the other hand, in Aurora these rates are usually around 0.51%, which is significantly lower, providing an advantage to homeowners.
Sales Tax
Sales tax in Dallas is relatively high at 8.25%, combining both city and state taxes. In contrast, Aurora has a lower sales tax rate of 4.0%, but residents also pay a combined 2.9% state sales tax and an additional local tax.
Income
Type
Dallas
Aurora
Estimated median household income
$57,995
$71,647
Estimated per capita income
$38,479
$35,054
Cost of living index (U.S. average is 100)
96.1
109.4
If you make $50,000 in Dallas, you will have to make $56,920 in Aurora to maintain the same standard of living.
Geographical Conditions
Dallas is largely flat with some rolling hills, and it's prone to hot, humid summers. Aurora is situated near the Rocky Mountains, offering a blend of urban and outdoor living with great options for outdoor sports, hiking, and skiing nearby.
Both cities place emphasis on education. However, Dallas with its larger population has a wider variety of school districts and private schools. Aurora, while having fewer school districts, is within close proximity to Denver which expands educational options. There are also numerous higher education opportunities in both cities.
Dallas has a robust and diversified economy with strong sectors in technology, defense, financial services and telecommunications. Aurora's economy is smaller but also diverse, focused on aerospace, healthcare, and retail. Both cities show promising economic growth and job opportunities, although Dallas offers a larger job market due to its size.
Biggest Employers
The biggest employers in Dallas are AMR Corporation (American Airlines), Bank of America, and Texas Health Resources. Aurora's largest employers are the University of Colorado Hospital, Children's Hospital Colorado, and the City of Aurora.
In Dallas (Dallas County), 57.3% voted for Democrats and 41.8% for Republicans in 2012 Presidential Election. In Aurora (Adams County), 57.3% voted for Democrats and 40.4% for Republicans.
Elections
Type
Democrats
Republicans
Other
Year
Dallas
Aurora
Dallas
Aurora
Dallas
Aurora
2020
65.1%
57.1%
33.4%
40.7%
1.4%
2.2%
2016
60.8%
50.1%
34.7%
41.6%
4.5%
8.3%
2012
57.3%
57.3%
41.8%
40.4%
1.0%
2.3%
2008
57.4%
58.5%
42.0%
40.1%
0.6%
1.4%
2004
49.0%
50.7%
50.4%
48.4%
0.5%
0.9%
2000
45.0%
50.3%
52.7%
44.2%
2.4%
5.5%
1996
46.0%
51.3%
46.8%
38.9%
7.2%
9.8%
Breakdown of population affiliated with a religious congregation
Type
Adherents
Congregations
Religion
Dallas
Aurora
Dallas
Aurora
CATHOLIC CHURCH
18.9%
16.0%
2.4%
4.5%
SOUTHERN BAPTIST CONVENTION
11.0%
0.7%
31.1%
7.8%
MUSLIM ESTIMATE
3.6%
0.1%
1.1%
0.8%
EPISCOPAL CHURCH
1.0%
0.1%
1.5%
1.2%
SEVENTH DAY ADVENTIST CHURCH
0.5%
0.4%
1.7%
3.3%
EVANGELICAL LUTHERAN CHURCH IN AMERICA
0.3%
0.4%
0.9%
2.5%
LUTHERAN CHURCH
0.3%
0.7%
0.7%
3.3%
Weather
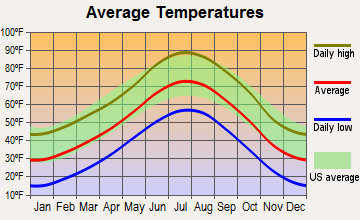
Dallas experiences a humid subtropical climate with hot summers and generally mild winters, which might be overwhelming to some. Aurora, on the other hand, has a semi-arid climate, with more distinct seasons including snow in winter and warm summers, which are typically less hot than Dallas's. For outdoorsy types, Aurora's weather might be more appealing.
Weather and climate
Type
Dallas
Aurora
Temperature - Average
66.6°F
49.9°F
Humidity - Average morning or afternoon humidity
71.3%
50.6%
Humidity - Differences between morning and afternoon humidity
34%
20%
Humidity - Maximum monthly morning or afternoon humidity
82%
55%
Humidity - Minimum monthly morning or afternoon humidity
48%
35%
Precipitation - Yearly average
37.3 in
16.9 in
Snowfall - Yearly average
4.2 in
114 in
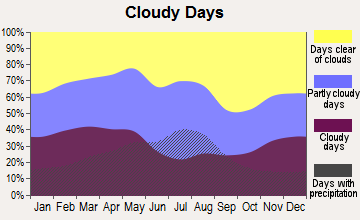
Clouds - Number of days clear of clouds
22.8%
19.2%
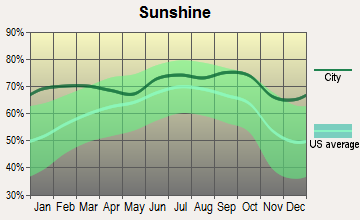
Sunshine amount - Average
66.6%
75.6%
Sunshine amount - Differences during a year
20%
10%
Sunshine amount - Maximum monthly
74%
74%
Sunshine amount - Minimum monthly
54%
64%
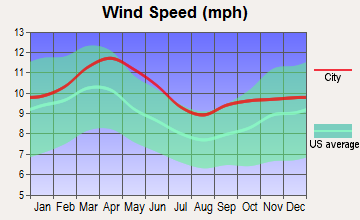
Wind speed - Average
10.3 mph
8.6 mph
Average climate in Dallas, Texas
Average climate in Aurora, Colorado
Air pollution
Type
AQI
CO
NO2
OZONE
PB
PM10
PM25
SO2
Year
Dallas
Aurora
Aurora
Dallas
Aurora
Dallas
Aurora
Dallas
Aurora
Aurora
Dallas
Aurora
Dallas
Aurora
2018
86
99
0.37
N/A
5.7
21.5
28.7
31.3
N/A
N/A
29.2
N/A
9.7
8.5
0.4
0.7
2017
84
95
0.37
N/A
5.5
21.9
28.6
31.1
N/A
N/A
22.0
N/A
9.1
8.5
0.3
0.9
2016
81
90
0.42
N/A
6.1
24.0
27.2
30.7
N/A
N/A
22.6
N/A
8.4
8.1
0.2
1.0
2015
85
101
0.44
N/A
6.5
22.8
26.7
29.5
N/A
N/A
20.6
N/A
8.9
9.5
0.3
1.1
2014
83
94
0.42
N/A
6.3
21.8
27.6
29.6
N/A
N/A
22.5
N/A
9.9
10.1
0.3
1.3
2013
97
84
0.39
N/A
7.3
19.6
28.8
29.9
N/A
N/A
21.9
N/A
13.0
N/A
0.2
1.4
2012
116
90
0.35
N/A
8.6
18.9
31.0
30.8
N/A
N/A
24.2
N/A
12.0
N/A
0.3
1.2
2011
98
91
0.34
N/A
9.4
18.1
30.9
30.9
N/A
N/A
23.8
N/A
11.9
N/A
0.6
1.5
2010
79
81
0.41
N/A
9.4
16.3
28.3
28.8
N/A
N/A
26.6
N/A
N/A
N/A
0.7
1.0
2009
88
79
0.37
N/A
9.2
14.1
28.8
27.1
N/A
0.005
22.6
N/A
N/A
N/A
0.5
1.3
2008
88
85
0.41
N/A
9.8
17.3
29.2
28.8
0.121
0.008
25.5
N/A
N/A
N/A
0.5
1.6
2007
94
96
0.42
N/A
11.0
20.6
25.7
25.4
0.070
0.007
28.8
N/A
N/A
N/A
0.3
1.2
2006
107
89
0.50
N/A
10.8
19.0
30.6
25.0
0.106
0.027
28.0
N/A
N/A
N/A
0.7
1.4
2005
108
86
0.57
N/A
13.0
21.3
29.7
22.5
0.142
0.109
29.6
N/A
11.0
N/A
0.9
1.5
2004
96
82
0.61
N/A
12.3
21.2
26.0
21.4
0.099
0.037
28.6
N/A
N/A
N/A
0.8
1.8
2003
102
106
0.62
N/A
13.6
21.2
27.1
23.1
0.121
0.040
32.6
N/A
N/A
N/A
1.0
1.9
2002
100
86
0.64
N/A
14.0
19.2
25.2
22.8
0.080
0.028
35.7
N/A
N/A
N/A
0.4
2.5
2001
100
95
0.79
N/A
14.3
24.0
26.0
20.4
0.069
0.030
32.6
N/A
N/A
N/A
1.0
2.6
2000
109
93
0.77
N/A
14.5
13.8
27.0
21.4
0.092
0.033
12.2
N/A
N/A
N/A
1.1
2.1
Natural disasters
Type
Dallas
Aurora
Tornado activity compared to U.S. average
254.7%
138.7%
Earthquake activity compared to U.S. average
567%
796.4%
Natural disasters compared to U.S. average
21%
11%
Transportation
Dallas has more public transportation options including light rail, buses and the Dallas Area Rapid Transit system. Aurora's public transit system is more limited, but the city does offer easy access to Denver's extensive light rail and bus system.
Transport
Type
Dallas
Aurora
Amtrak stations
1
0
Amtrak stations nearby
1
2
FAA registered aircraft
2
138
FAA registered aircraft manufacturers and dealers
56
19
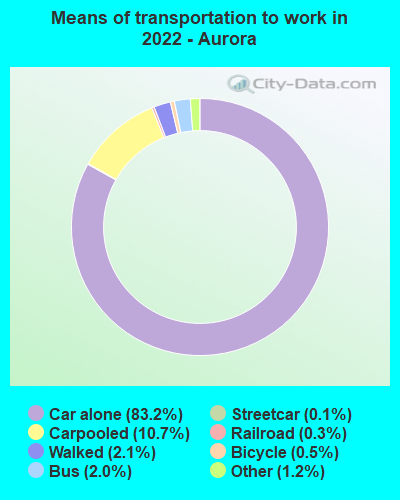
Means of transportation to work
Type
Dallas
Aurora
Bicycle
0.3%
0.6%
Bus
1.4%
1.7%
Carpooled
10.9%
9.3%
Car alone
83.9%
84.4%
Railroad
0.2%
0.1%
Subway
0.2%
0.1%
Taxicab
0.1%
0%
Walked
1.6%
2.5%
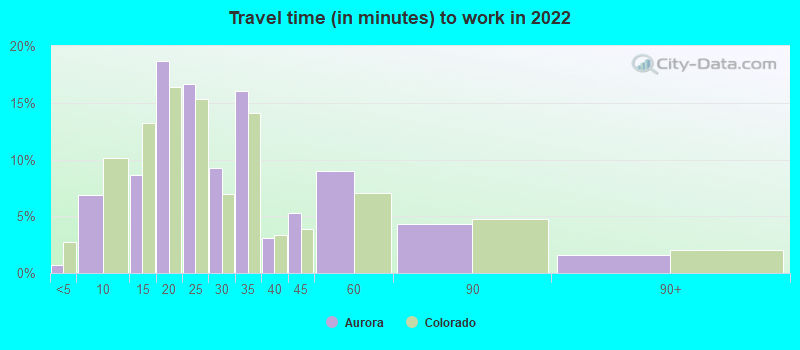
Average travel time to work
Type
Dallas
Aurora
Average
31.5 min
28.3 min
Other means
26.5 min
26.9 min
Public transportation
46 min
50.5 min
Private vehicle occupancy
Type
Dallas
Aurora
Average
1.2
1.2
Drove alone
86.8%
85.1%
In 2 person carpool
9%
10%
In 3 person carpool
2.6%
2.8%
In 4 person carpool
0.9%
1.5%
In 5-6 person carpool
0.5%
0.3%
In 7+ person carpool
0.2%
0.2%
How many people usually rode to work in the car, truck or van.
Real Estate
While real estate in both cities could be considered affordable compared to some U.S. cities, Dallas has typically lower prices than Aurora. Buyers and renters will find more options in Dallas due to its larger size, but the market in Aurora has been booming due to its proximity to Denver.
Neighborhoods
Both cities have a variety of neighborhoods to suit any lifestyle. In Dallas, Uptown is popular for its nightlife, while Highland Park is known for its luxury homes. Aurora offers a more suburban feel with neighborhoods like Seven Hills being family-friendly with plenty of parks.
Houses and residents
Type
Dallas
Aurora
Houses
591,773
149,636
Average household size (people)
2.6
2.7
Median year apartment built
1987
1986
Median year house/condo built
1969
1984
Length of stay in the house since moving in
13.9 years
10.4 years
Houses occupied
536,008 (90.6%)
140,003 (93.6%)
Houses occupied by owners
229,518 (42.8%)
89,615 (64%)
Houses occupied by renters
306,490 (57.2%)
50,388 (36%)
Median rent asked for vacant for-rent units
$1,403
$2,036
Median monthly housing costs
$1,225
$1,526
Median price asked for vacant for-sale houses and condos
$574,934
$725,445
Estimated median house or condo value
$267,600
$411,400
Median numbers of rooms
4.6
5.5
Median number of rooms in apartments
3.7
3.9
Median number of rooms in houses and condos
6.1
6.5
Median house price - detached houses
$410,272
$500,029
Median house price - in 2-unit structures
$255,160
$384,060
Median house price - in 3-to-4-unit structures
$230,927
$254,381
Median house price - in 5 or more unit structures
$444,589
$231,026
Median house price - mobile homes
$91,039
$130,226
Median house price - Townhouses or other attached units
$350,045
$471,483
Median house price - All housing units
$402,215
$476,379
Median house age
40
36
Renting percentage
55.9%
40.1%
Housing density (houses/condos per square mile)
1,727.6
1,050.1
House value disparities
41.3%
23.6%
Household income disparities
48.2%
41.5%
Median household income for houses/condes with a mortgage
$103,798
$99,433
Median household income for apartments without a mortgage
$61,909
$63,316
Housing units without a mortgage
1,309 (1%)
424 (0.6%)
Housing units with both a second mortgage and home equity loan
3,320 (2.6%)
5,246 (7.8%)
Housing units with a mortgage
124,846 (99%)
66,791 (99.4%)
Housing units with a home equity loan
204 (0.2%)
176 (0.3%)
Housing units with a second mortgage
5,351 (4.2%)
6,860 (10.2%)
House/condo owner moved in on average (years ago)
12
7
House/condo renter moved in on average (years ago)
1
1
Housing units lacking complete kitchen facilities
1.2%
1%
Housing units lacking complete plumbing facilities
0.9%
0.6%
Housing units in structures
Housing units in structures
Dallas
Aurora
One, detached
41.8%
52.6%
One, attached
4.3%
11.9%
Two
1.5%
0.2%
3 or 4
4.9%
4.2%
5 to 9
7.9%
7.1%
10 to 19
12.1%
11.0%
20 to 49
8.1%
5.5%
50 or more
18.4%
5.7%
Mobile homes
1.0%
1.7%
Median real estate property taxes paid for housing units
Self-employed workers in own not incorporated business
43,703
13,677
State government workers
17,325
5,134
Unpaid family workers
754
0
Industries and Occupations
In Dallas, the leading industries are technology, financial services and healthcare. In Aurora, the healthcare and retail sectors are particularly strong, as well as the aerospace industry due to its proximity to the Buckley Air Force Base.
Dallas is home to some renowned hospitals including UT Southwestern Medical Center and Baylor University Medical Center. Aurora also has good healthcare facilities, with the University of Colorado Hospital and Children's Hospital Colorado among the best in the country.
Health (county statistics)
Type
Dallas
Aurora
General health status score of residents in this county from 1 (poor) to 5 (excellent)
Dallas has a more developed infrastructure, given its size and status as an economic hub. Multiple highways, bridges, and a booming downtown area characterize this city. Aurora, while not as architecturally impressive as Dallas, still has solid infrastructure and access to Denver's resources.
Infrastructure
Type
Dallas
Aurora
Hospitals
74
4
TV stations
25
15
Bank branches located here
394
77
Bank institutions located here
80
19
Main business address for public companies
122
1
Drinking water stations with no reported violations in the past
8
1
Drinking water stations with reported violations in the past
HMDA - Conventional home purchase loans - Applications denied
Year
Dallas
Aurora
1999
5,030
1,737
2000
3,390
1,460
2001
2,626
1,056
2002
2,657
635
2003
3,617
1,276
2004
5,460
2,052
2005
7,445
3,087
2006
7,397
2,880
2007
5,056
1,693
2008
2,200
782
2009
1,121
302
Culture and Food
Dallas offers traditional Southern charm with a modern metropolitan vibe. Its food scene is legendary, particularly for Tex-Mex and BBQ. Aurora, often seen as a Denver suburb, offers a great blend of having a city and country life with access to Denver's vibrant cultural scene. Its food scene is diverse, influenced by a broad spectrum of cultures.
Sports Teams
Dallas sports fans boast about the Dallas Cowboys (NFL), Mavericks (NBA), Stars (NHL) and the Rangers (MLB). Aurora doesn't have its own professional sports teams, but it's only a short drive to Denver, which is home to the Broncos (NFL), Nuggets (NBA), Rockies (MLB), and Avalanche (NHL).


 Dallas, TX
 Aurora, CO