Dallas, TX vs Riverside, CA - Advanced U.S. city comparison tool

Dallas, TX vs Riverside, CA

Dallas, the ninth largest city in the U.S., and Riverside, the 61st largest, are significantly different in many aspects. Dallas is a major economic hub with a bustling downtown and an internationally renowned botanical garden, while Riverside boasts a slower pace of life with an emphasis on outdoor activities and a close-knit community vibe. These differences extend to various aspects such as crime, weather, cost of living, education, economy, infrastructure, and more. This comprehensive comparison will serve as a guide for those looking to relocate or tourists exploring these cities.
 
 
Distance between Dallas, TX and Riverside, CA : 1,189.7 miles

Dallas's population is larger by 306%. Its population has grown by 99,877 people (8.4%) since 2000. The population of Riverside has grown by 62,095 people (24.3%) during that time.

Population
Type Dallas Riverside
Population 1,288,457 317,261
Female / male percentage 49.5% / 50.5%
49.5%
50.5%
50.9% / 49.1%
50.9%
49.1%
Racial makeup - percentage
Ethnicity DallasRiverside
Hispanic 42.0% 55.9%
White Non-Hispanic 28.0% 25.3%
Black 23.6% 6.6%
Asian 3.4% 8.5%
Two or more 2.4% 2.9%
American Indian 0.1% 0.1%
Pacific Islander 0.0% 0.5%
Racial makeup - absolute values
Ethnicity DallasRiverside
Hispanic 541,466 177,393
White Non-Hispanic 361,307 80,131
Black 303,928 20,964
Asian 43,701 26,833
Two or more 31,127 9,201
American Indian 1,694 271
Pacific Islander 287 1,531

Crime and Safety

Dallas has higher crime rates compared to the national average and significantly higher than Riverside. However, neighborhood crime rates vary significantly across the city, and areas like North Dallas and the Arts District are generally safer. Riverside, on the other hand, has a lower crime rate than the national average, making it a relatively safe city to live in and visit. Despite this, it's always imperative to be mindful of one's surroundings.

Crime by year per 100,000 residents
Type City-data.com crime indexRobberies per 100,000Murders per 100,000Rapes per 100,000Assaults per 100,000Burglaries per 100,000Theft per 100,000Auto theft per 100,000Arson per 100,000
Year DallasRiversideDallasRiversideDallasRiversideDallasRiversideDallasRiversideDallasRiversideDallasRiversideDallasRiversideDallasRiverside
2020 439.5 295.7 241.5 117.8 17.3 6.0 41.7 45.5 544.2 276.6 727.6 490.2 1,955.6 1,930.8 763.1 563.7 13.2 28.7
2019 460.1 296.8 327.4 142.8 14.6 5.1 59.1 41.7 470.8 316.3 696.3 390.7 1,966.0 2,099.6 798.7 447.4 11.4 22.5
2018 420.3 312.3 292.6 164.0 11.4 4.2 63.0 45.3 400.7 295.8 669.7 444.1 1,886.1 2,087.8 711.6 557.4 14.5 22.1
2017 420.5 314.0 327.0 165.8 12.5 3.7 62.1 50.6 373.1 288.7 737.7 510.0 1,856.3 2,020.9 591.2 527.4 26.2 22.3
2016 429.3 335.5 348.5 179.8 12.9 3.1 58.1 43.3 342.9 302.9 828.8 606.6 1,996.3 2,256.9 574.7 593.4 27.9 17.5
2015 412.3 303.6 320.8 161.0 10.4 3.1 60.1 42.4 302.8 239.6 854.2 505.5 2,002.8 2,211.3 583.3 542.9 26.8 22.0
2014 409.7 291.2 303.1 138.0 9.1 3.8 61.4 44.8 291.1 246.7 918.3 479.3 2,117.2 2,126.8 553.7 481.8 30.3 27.5
2013 437.5 294.8 334.8 156.4 11.4 3.2 43.3 24.7 274.3 236.1 1,156.6 625.1 2,420.2 2,184.4 588.4 542.9 36.3 23.7
2012 450.3 307.2 329.7 164.9 12.4 5.1 39.1 24.2 293.7 248.8 1,296.0 716.7 2,508.8 2,262.9 568.8 470.8 46.8 20.7
2011 484.4 281.0 332.5 149.0 10.9 4.2 35.0 18.5 302.8 254.4 1,531.2 676.5 2,873.9 2,042.0 652.8 414.1 48.7 15.9
2010 529.2 303.4 374.6 165.2 12.4 3.0 42.2 25.7 335.7 282.7 1,635.8 680.6 3,017.7 2,117.3 699.9 480.8 53.6 16.1
2009 545.6 319.1 426.3 222.4 12.9 5.0 37.6 32.7 315.4 251.8 1,505.7 673.6 3,214.9 2,080.6 810.3 443.9 58.7 26.3
2008 602.5 377.5 506.7 242.5 13.3 6.3 39.1 36.4 335.8 356.7 1,657.2 737.5 3,322.5 2,415.0 956.6 541.4 70.5 41.8
2007 695.9 370.9 582.8 229.2 16.1 4.0 41.2 30.4 428.9 368.8 1,813.6 744.0 3,849.5 2,365.8 1,113.0 616.7 73.4 34.4
2006 726.6 414.3 553.9 278.1 15.0 3.8 53.3 28.4 584.2 377.9 1,734.7 810.4 4,006.4 2,552.5 1,116.0 828.2 84.8 44.8
2005 619.4 389.9 559.4 232.5 16.4 3.4 45.7 38.9 632.6 398.2 1,817.7 860.5 4,252.2 2,809.9 1,160.4 954.2 80.0 71.7
2004 660.0 366.5 607.7 197.7 20.2 6.0 47.9 31.6 640.0 388.7 1,882.3 833.0 4,481.4 2,671.7 1,292.6 883.9 92.9 75.2
2003 681.6 396.7 647.2 206.8 18.4 8.7 48.9 36.8 656.3 439.2 1,782.2 791.8 4,759.3 2,922.4 1,415.8 937.9 105.7 83.4

City-data.com crime index counts serious crimes and violent crime more heavily. It adjusts for the number of visitors and daily workers commuting into cities. (higher means more crime, U.S. average = 301.1)


Crime per year
Type City-data.com crime indexRobberiesMurdersRapesAssaultsBurglariesTheftAuto theftArson
Year DallasRiversideDallasRiversideDallasRiversideDallasRiversideDallasRiversideDallasRiversideDallasRiversideDallasRiversideDallasRiverside
2019 460.1 296.8 4,463 476 199 17 806 139 6,419 1,054 9,492 1,302 26,803 6,997 10,889 1,491 155 75
2018 420.3 312.3 3,986 543 155 14 858 150 5,459 979 9,124 1,470 25,697 6,911 9,695 1,845 197 73
2017 420.5 314.0 4,377 544 167 12 831 166 4,994 947 9,874 1,673 24,847 6,629 7,913 1,730 351 73
2016 429.3 335.5 4,604 586 171 10 767 141 4,529 987 10,948 1,977 26,370 7,355 7,592 1,934 369 57
2015 412.3 303.6 4,177 520 136 10 782 137 3,943 774 11,121 1,633 26,076 7,144 7,594 1,754 349 71
2014 409.7 291.2 3,856 441 116 12 781 143 3,704 788 11,685 1,531 26,939 6,794 7,045 1,539 385 88
2013 437.5 294.8 4,202 495 143 10 543 78 3,442 747 14,516 1,978 30,374 6,912 7,384 1,718 455 75
2012 450.3 307.2 4,093 517 154 16 486 76 3,647 780 16,090 2,247 31,148 7,095 7,062 1,476 581 65
2011 484.4 281.0 4,066 458 133 13 428 57 3,703 782 18,727 2,080 35,148 6,278 7,984 1,273 596 49
2010 529.2 303.4 4,487 502 148 9 505 78 4,021 859 19,594 2,068 36,147 6,434 8,384 1,461 642 49
2009 545.6 319.1 5,501 667 166 15 485 98 4,069 755 19,428 2,020 41,481 6,239 10,455 1,331 758 79
2008 602.5 377.5 6,466 726 170 19 499 109 4,285 1,068 21,149 2,208 42,402 7,230 12,208 1,621 900 125
2007 695.9 370.9 7,222 686 200 12 511 91 5,315 1,104 22,472 2,227 47,699 7,081 13,791 1,846 909 103
2006 726.6 414.3 6,914 814 187 11 665 83 7,292 1,106 21,653 2,372 50,009 7,471 13,930 2,424 1,058 131
2005 619.4 389.9 6,882 675 202 10 562 113 7,783 1,156 22,363 2,498 52,315 8,157 14,277 2,770 984 208
2004 660.0 366.5 7,466 563 248 17 588 90 7,863 1,107 23,126 2,372 55,059 7,608 15,881 2,517 1,141 214
2003 681.6 396.7 7,963 573 226 24 601 102 8,075 1,217 21,927 2,194 58,554 8,098 17,419 2,599 1,301 231

City-data.com crime index counts serious crimes and violent crime more heavily. It adjusts for the number of visitors and daily workers commuting into cities. (higher means more crime, U.S. average = 301.1)

Sex Offenders

According to our data, there are 4,297 registered sex offenders living in Dallas and 616 registered sex offenders living in .
The ratio of residents to sex offenders in Dallas is 307 to 1; the ratio in Riverside is 527 to 1.
The number of registered sex offenders compared to the number of residents is larger in Dallas than in Riverside.

Cost of Living

The cost of living in Dallas is lower than the national average, making it an attractive option for those looking to relocate. In contrast, Riverside's cost of living is higher due to California's notoriously high housing and living costs. However, this can vary depending on the neighborhood and quality of housing chosen.

Income Tax

Texas, including Dallas, does not have a state income tax, which can make it an attractive destination for those looking to maximize their income. California, on the other hand, does have a state income tax. The rate is progressive and depends on the income level of the resident.

Property Tax

Property tax rates in Dallas are high compared to the national average, which is a consideration for potential homebuyers. In contrast, Riverside has lower property tax rates, but high home prices can offset this advantage.

Sales Tax

Dallas, located in Texas, does not have a state income tax but has a sales tax rate of 8.25%. In contrast, Riverside, located in California, has a considerably higher sales tax rate at 8.75%, plus there is a state income tax that varies by income level.
Income
Type Dallas Riverside
Estimated median household income $57,995 $76,558
Estimated per capita income $38,479 $29,013
Cost of living index (U.S. average is 100) 96.1 83

If you make $50,000 in Riverside, you will have to make $57,892 in Dallas to maintain the same standard of living.

Geographical Conditions

Dallas is largely flat and located in the Blackland Prairies region of Texas, with the Trinity River flowing through the city. Riverside is located in the Inland Empire area of Southern California, nestled between the Santa Ana Mountains and the Santa Ana River.
Geographical information
Type Dallas Riverside
Land area 342.5 sq. miles 78.1 sq. miles
Population density 3,761.4 people per sq. mile 4,062.3 people per sq. mile
Relative area comparison
Dallas, TX Riverside, CA
First ancestry reported - percentage
Ancestry DallasRiverside
English 2.4% 2.0%
German 1.8% 2.0%
Irish 1.5% 1.7%
Italian 0.7% 1.3%
Scotch-Irish 0.4% 0.2%
Scottish 0.4% 0.4%
French 0.3% 0.4%
Polish 0.3% 0.3%
Norwegian 0.2% 0.3%
Dutch 0.1% 0.4%
Arab 0.0% 0.2%
Population origin - absolute values
Ancestry DallasRiverside
English 21,084 4,100
German 15,613 4,160
Irish 13,446 3,453
Italian 6,385 2,585
Scottish 3,899 850
Scotch-Irish 3,816 476
Polish 2,768 570
French 2,760 740
Russian 1,733 246
Norwegian 1,350 563
Dutch 1,035 796
Czech 992 157
Swedish 872 311
Welsh 867 86
Greek 785 263
French Canadian 590 258
Ukrainian 552 108
West Indian 477 61
Hungarian 466 235
Portuguese 462 212
Foreign born residents - absolute values
Type Count
Region DallasRiverside
All 314,364 73,897
Africa 26,494 1,840
Asia 36,705 17,983
Europe 9,913 2,179
Latin America 231,492 49,583
North America 1,993 445
Oceania 552 245
Foreign born residents - percentage
Type Percentage
Region DallasRiverside
All 24.4% 23.0%
Africa 2.1% 0.6%
Asia 2.8% 5.6%
Europe 0.8% 0.7%
Latin America 17.9% 15.4%
North America 0.2% 0.1%

Education

Both cities boast strong educational institutions. Dallas is home to several major universities such as Southern Methodist University and the University of Texas at Dallas, providing high-quality education at all levels. Riverside is home to the University of California, Riverside and several community colleges that are well-regarded, especially in STEM fields.
School enrollment
Type Dallas Riverside
Nursery, preschool 15,041 (5%) 3,395 (3.6%)
Kindergarten 16,457 (5.5%) 3,101 (3.3%)
Grade 1 to 4 64,355 (21.5%) 14,349 (15.2%)
Grade 5 to 8 68,028 (22.7%) 16,802 (17.8%)
Grade 9 to 12 65,239 (21.8%) 16,534 (17.5%)
College undergrad 48,830 (16.3%) 33,782 (35.9%)
Graduate or professional 21,797 (7.3%) 6,251 (6.6%)
Students in private schools - absolute values
Type Count
Grade DallasRiverside
Grades 1 to 8 (elementary and middle school) 13,341 1,734
Grades 9 to 12 (high school) 7,710 719
Undergraduate colleges 13,646 7,935
Students in private schools - percentage
Type Percentage
Grade DallasRiverside
Grades 1 to 8 (elementary and middle school) 10.1% 5.6%
Grades 9 to 12 (high school) 11.8% 4.3%
Undergraduate colleges 27.9% 23.5%
Educational attainment
Type Dallas Riverside
Less than high school 19.4% 16%
High school or equiv. 21.4% 30.2%
Less than 1 year of college 4.8% 6.9%
1 or more years of college 11.8% 15.7%
Associate degree 5.4% 7.8%
Bachelor's degree 23.2% 13.8%
Master's degree 9.2% 6.7%
Profess. school degree 3.3% 1.2%
Doctorate degree 1.4% 1.7%
Education level (25-year-olds and older)
Type Dallas Riverside
Bachelor's degree or higher 37.1% 23.4%
Graduate or professional degree 13.9% 9.6%
High school or higher 80.6% 84%

Work and Economy

Dallas’ economy is diverse, with significant sectors in defense, financial services, information technology, telecommunications, and transportation. Job growth and the economy are strong, thanks in part to the presence of many Fortune 500 companies. Riverside, on the other hand, has an economy based largely on the education, healthcare and retail sectors. It has slower job growth in comparison, though the city is making efforts to attract more businesses.

Biggest Employers

Many Fortune 500 companies have headquarters or regional offices in Dallas, including ExxonMobil, AT&T, and American Airlines. The healthcare sector, led by Texas Health Resources and Baylor Health Care System, is another significant employer. In Riverside, the largest employers are UC Riverside, Riverside Unified School District, and the City of Riverside.
Employment and residency - absolute values
Kind DallasRiverside
Work and live in this city 350,745 48,375
Work and live in this county 548,715 110,489
Workers who work outside the city they live in 837,835 206,791
Workers who work outside the county they live in 91,012 40,637
Working at home 119,747 17,473
Not working at home 519,980 133,653
Daytime population change due to commuting 227,555 11,643
Employment and residency - percentage
Kind DallasRiverside
Work and live in this city 65.3% 46.4%
Work and live in this county 85.8% 73.1%
Workers who work outside the city they live in 34.7% 53.6%
Workers who work outside the county they live in 14.2% 26.9%
Working at home 18.7% 11.6%
Not working at home 81.3% 88.4%
Daytime population change due to commuting 19.1% 4.6%
Geographical mobility: all
Type all
Mobility DallasRiverside
Same house 1 year ago 83.8% 88.7%
Moved from abroad 0.8% 0.5%
Moved within same county 9.8% 5.4%
Moved from different state 2.4% 0.7%
Moved within same state 3.2% 4.7%
Geographical mobility: Asian
Type Asian
Mobility DallasRiverside
Same house 1 year ago 80.2% 83.0%
Moved from abroad 4.0% 4.0%
Moved within same county 5.7% 3.4%
Moved from different state 6.5% 1.3%
Moved within same state 3.6% 8.2%
Geographical mobility: Black
Type Black
Mobility DallasRiverside
Same house 1 year ago 84.5% 88.6%
Moved from abroad 0.2% 0%
Moved within same county 10.0% 4.1%
Moved from different state 2.0% 2.3%
Moved within same state 3.4% 5.0%
Geographical mobility: White
Type White
Mobility DallasRiverside
Same house 1 year ago 81.4% 90.4%
Moved from abroad 0.3% 0.5%
Moved within same county 10.4% 4.1%
Moved from different state 3.8% 0.9%
Moved within same state 4.1% 4.1%
Building permits
Type Average valueCount
City DallasRiversideDallasRiverside
1997 $153,000 $152,000 1,353 421
1998 $134,300 $164,000 1,744 630
1999 $110,000 $177,800 1,752 749
2000 $206,400 $186,000 1,732 1,017
2001 $178,400 $205,700 1,913 1,237
2002 $178,200 $196,500 2,024 1,113
2003 $163,600 $201,800 2,597 689
2004 $165,000 $242,500 3,353 847
2005 $164,300 $231,200 3,353 1,441
2006 $235,900 $237,000 3,178 848
2007 $284,700 $259,600 2,090 342
2008 $295,700 $328,500 1,198 69
2009 $284,900 $275,400 734 56
2010 $286,900 $260,600 865 107
2011 $273,900 $193,300 809 43
2012 $193,400 $257,000 936 190
2013 $202,400 $258,700 1,075 70
2014 $213,900 $266,200 1,181 230
2015 $222,200 $242,300 1,455 222
2016 $226,500 $221,300 1,640 219
2017 $230,300 $252,900 2,100 208
2018 $235,200 $248,000 2,009 171
2019 $237,200 $211,100 2,093 170
2020 $234,900 $196,500 1,475 180
2021 $237,400 $267,400 2,245 293

There were 2,245 building permits issued in Dallas in 2012 (1436 more than in 2011) compared to 293 building permits issued in Riverside in 2012 (250 more than in 2011).

In Dallas (Dallas County), 57.3% voted for Democrats and 41.8% for Republicans in 2012 Presidential Election. In Riverside (Riverside County), 49.6% voted for Democrats and 48.0% for Republicans.

Elections
Type DemocratsRepublicansOther
Year DallasRiversideDallasRiversideDallasRiverside
2020 65.1% 53.0% 33.4% 45.0% 1.4% 2.0%
2016 60.8% 49.7% 34.7% 44.4% 4.5% 5.9%
2012 57.3% 49.6% 41.8% 48.0% 1.0% 2.4%
2008 57.4% 50.4% 42.0% 48.1% 0.6% 1.5%
2004 49.0% 41.3% 50.4% 58.2% 0.5% 0.6%
2000 45.0% 45.0% 52.7% 51.6% 2.4% 3.4%
1996 46.0% 43.0% 46.8% 45.6% 7.2% 11.3%
Breakdown of population affiliated with a religious congregation
Type AdherentsCongregations
Religion DallasRiversideDallasRiverside
CATHOLIC CHURCH 18.9% 27.5% 2.4% 4.5%
SOUTHERN BAPTIST CONVENTION 11.0% 1.2% 31.1% 11.2%
MUSLIM ESTIMATE 3.6% 0.5% 1.1% 0.7%
EPISCOPAL CHURCH 1.0% 0.2% 1.5% 1.4%
SEVENTH DAY ADVENTIST CHURCH 0.5% 0.9% 1.7% 3.4%
EVANGELICAL LUTHERAN CHURCH IN AMERICA 0.3% 0.3% 0.9% 1.5%

Weather

Dallas experiences a humid subtropical climate with hot, humid summers and mild winters. Riverside, located farther south, generally has a warm Mediterranean climate. Its summers are hot, often reaching triple-digit temperatures, but winters are fairly mild, with chilly nights but seldom any snowfall. While Dallas experiences occasional hail and tornadoes due to its location in Tornado Alley, Riverside has occasional earthquakes as it's located in Southern California.
Weather and climate
Type Dallas Riverside
Temperature - Average 66.6°F 66°F
Humidity - Average morning or afternoon humidity 71.3% 66.7%
Humidity - Differences between morning and afternoon humidity 34% 21.4%
Humidity - Maximum monthly morning or afternoon humidity 82% 73.5%
Humidity - Minimum monthly morning or afternoon humidity 48% 52.1%
Precipitation - Yearly average 37.3 in 10.3 in
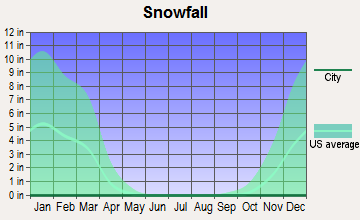
Snowfall - Yearly average 4.2 in 0 in
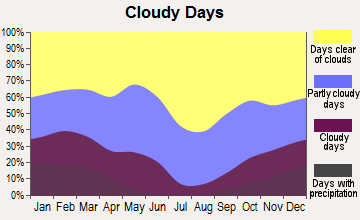
Clouds - Number of days clear of clouds 22.8% 27.3%
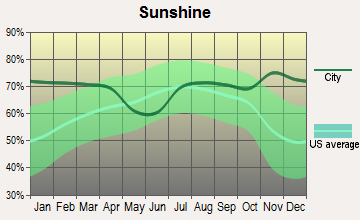
Sunshine amount - Average 66.6% 78.2%
Sunshine amount - Differences during a year 20% 21.5%
Sunshine amount - Maximum monthly 74% 84.2%
Sunshine amount - Minimum monthly 54% 62.6%
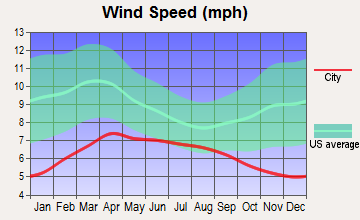
Wind speed - Average 10.3 mph 4.5 mph

Average climate in Dallas, Texas

Chicago, Illinois average temperatures Chicago, Illinois average precipitation Chicago, Illinois humidity Chicago, Illinois wind speed Chicago, Illinois snowfall Chicago, Illinois sunshine Chicago, Illinois clear and cloudy days
 

Average climate in Riverside, California

Chicago, Illinois average temperatures Chicago, Illinois average precipitation Chicago, Illinois humidity Chicago, Illinois wind speed Chicago, Illinois snowfall Chicago, Illinois sunshine Chicago, Illinois clear and cloudy days
 

Air pollution
Type AQICONO2OZONEPBPM10PM25SO2
Year DallasRiversideRiverside DallasRiversideDallasRiversideDallasRiversideRiverside DallasRiversideDallasRiverside
2018 86 153 0.35 N/A 5.7 14.4 28.7 29.8 N/A 0.006 44.6 N/A 9.7 13.6 0.4 0.4
2017 84 151 0.34 N/A 5.5 14.7 28.6 31.5 N/A 0.004 48.4 N/A 9.1 14.8 0.3 0.3
2016 81 140 0.33 N/A 6.1 14.8 27.2 30.9 N/A 0.006 44.4 N/A 8.4 14.5 0.2 0.2
2015 85 147 0.33 N/A 6.5 14.5 26.7 30.8 N/A 0.004 43.6 N/A 8.9 15.4 0.3 0.3
2014 83 147 0.37 N/A 6.3 15.9 27.6 30.7 N/A 0.006 34.1 N/A 9.9 16.5 0.3 0.3
2013 97 147 0.38 N/A 7.3 16.4 28.8 29.2 N/A 0.006 33.2 N/A 13.0 16.4 0.2 0.2
2012 116 148 0.35 N/A 8.6 16.4 31.0 30.2 N/A 0.007 32.3 N/A 12.0 16.0 0.3 0.3
2011 98 150 0.37 N/A 9.4 16.3 30.9 32.0 N/A 0.006 33.1 N/A 11.9 15.2 0.6 0.3
2010 79 144 0.42 N/A 9.4 17.8 28.3 30.9 N/A 0.008 31.9 N/A N/A 15.5 0.7 1.3
2009 88 151 0.37 N/A 9.2 20.0 28.8 29.0 N/A 0.009 38.0 N/A N/A 19.6 0.5 1.5
2008 88 157 0.41 N/A 9.8 20.5 29.2 30.0 0.121 0.010 43.6 N/A N/A 16.3 0.5 0.9
2007 94 135 0.65 N/A 11.0 20.8 25.7 28.3 0.070 0.011 N/A N/A N/A N/A 0.3 1.6
2006 107 129 0.58 N/A 10.8 21.0 30.6 28.0 0.106 0.005 N/A N/A N/A N/A 0.7 1.4
2005 108 134 0.53 N/A 13.0 22.8 29.7 27.3 0.142 0.012 N/A N/A 11.0 N/A 0.9 3.3
2004 96 142 0.72 N/A 12.3 18.5 26.0 29.5 0.099 0.013 N/A N/A N/A N/A 0.8 3.1
2003 102 144 0.75 N/A 13.6 22.7 27.1 28.5 0.121 0.013 N/A N/A N/A N/A 1.0 2.0
2002 100 142 0.82 N/A 14.0 24.9 25.2 28.5 0.080 0.015 N/A N/A N/A N/A 0.4 0.2
2001 100 145 0.79 N/A 14.3 25.7 26.0 26.1 0.069 0.025 N/A N/A N/A N/A 1.0 0.9
2000 109 157 0.82 N/A 14.5 24.2 27.0 25.0 0.092 0.031 N/A N/A N/A N/A 1.1 1.2
Natural disasters
Type Dallas Riverside
Tornado activity compared to U.S. average 254.7% 17.4%
Earthquake activity compared to U.S. average 567% 7,322.6%
Natural disasters compared to U.S. average 21% 46%

Transportation

Dallas boasts a comprehensive DART (Dallas Area Rapid Transit) system, which includes buses and light rail, and it is served by multiple interstates and highways. Commuting can be challenging due to heavy traffic. Riverside relies heavily on cars with three major highways serving the city. It also offers Metrolink train service to Los Angeles and bus services within the city, but public transit is less comprehensive than in Dallas.
Transport
Type Dallas Riverside
Amtrak stations 1 1
Amtrak stations nearby 1 3
FAA registered aircraft 2 307
FAA registered aircraft manufacturers and dealers 56 15
Means of transportation to work
Type Dallas Riverside
Bicycle 0.3% 0.5%
Bus 1.4% 0.9%
Carpooled 10.9% 9%
Car alone 83.9% 85.7%
Motorcycle 0% 0.3%
Railroad 0.2% 0.4%
Subway 0.2% 0.1%
Taxicab 0.1% 0%
Walked 1.6% 2.3%
Means of transportation to work
Average travel time to work
Type Dallas Riverside
Average 31.5 min 31.3 min
Other means 26.5 min 28.7 min
Public transportation 46 min 45.3 min
Travel time to work
Time leaving to work
Travel time to work
Time leaving to work
Private vehicle occupancy
Type Dallas Riverside
Average 1.2 1.1
Drove alone 86.8% 89.1%
In 2 person carpool 9% 8.4%
In 3 person carpool 2.6% 2%
In 4 person carpool 0.9% 0.2%
In 5-6 person carpool 0.5% 0.2%
In 7+ person carpool 0.2% 0.1%

How many people usually rode to work in the car, truck or van.

Real Estate

Dallas has an active real estate market with a variety of housing options, from modern high-rise apartments downtown to single-family homes in suburban neighborhoods. Despite the city's growth, housing prices remain relatively affordable. In Riverside, the housing market is more expensive, reflecting California’s high real estate prices. However, one is likely to find larger homes and lots compared to those in Dallas.

Neighborhoods

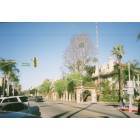
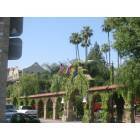
Dallas has numerous distinct neighborhoods each with their own character. Uptown is known for its high-energy nightlife, while the Bishop Arts District offers an indie vibe with boutiques and bistros. Riverside has a small-town feel with neighborhoods that pride themselves on their sense of community, from the historic Wood Streets to the upscale Canyon Crest.
Houses and residents
Type Dallas Riverside
Houses 591,773 94,246
Average household size (people) 2.6 3.2
Median year apartment built 1987 1982
Median year house/condo built 1969 1974
Length of stay in the house since moving in 13.9 years 14.2 years
Houses occupied 536,008 (90.6%) 91,110 (96.7%)
Houses occupied by owners 229,518 (42.8%) 51,211 (56.2%)
Houses occupied by renters 306,490 (57.2%) 39,899 (43.8%)
Median rent asked for vacant for-rent units $1,403 $1,277
Median monthly housing costs $1,225 $1,680
Median price asked for vacant for-sale houses and condos $574,934 $414,585
Estimated median house or condo value $267,600 $483,300
Median numbers of rooms 4.6 5.2
Median number of rooms in apartments 3.7 3.9
Median number of rooms in houses and condos 6.1 6.1
Median house price - detached houses $410,272 $548,362
Median house price - in 2-unit structures $255,160 $525,372
Median house price - in 3-to-4-unit structures $230,927 $450,463
Median house price - in 5 or more unit structures $444,589 $408,213
Median house price - mobile homes $91,039 $81,780
Median house price - Townhouses or other attached units $350,045 $442,670
Median house price - All housing units $402,215 $529,360
Median house age 40 44
Renting percentage 55.9% 44.3%
Housing density (houses/condos per square mile) 1,727.6 1,206.8
House value disparities 41.3% 21%
Household income disparities 48.2% 40.5%
Median household income for houses/condes with a mortgage $103,798 $104,161
Median household income for apartments without a mortgage $61,909 $71,925
Housing units without a mortgage 1,309 (1%) 393 (1%)
Housing units with both a second mortgage and home equity loan 3,320 (2.6%) 1,312 (3.3%)
Housing units with a mortgage 124,846 (99%) 39,744 (99%)
Housing units with a home equity loan 204 (0.2%) 123 (0.3%)
Housing units with a second mortgage 5,351 (4.2%) 2,112 (5.3%)
House/condo owner moved in on average (years ago) 12 13
House/condo renter moved in on average (years ago) 1 3
Housing units lacking complete kitchen facilities 1.2% 2.5%
Housing units lacking complete plumbing facilities 0.9% 0.4%
Housing units in structures
Housing units in structures DallasRiverside
One, detached 41.8% 63.1%
One, attached 4.3% 5.6%
Two 1.5% 1.1%
3 or 4 4.9% 3.7%
5 to 9 7.9% 6.8%
10 to 19 12.1% 7.0%
20 to 49 8.1% 4.6%
50 or more 18.4% 6.4%
Mobile homes 1.0% 1.8%
Median real estate property taxes paid for housing units
Type Dallas Riverside
With mortgages $5,874 (1.8%) $3,530 (0.7%)
With no mortgages $3,198 (1.6%) $2,330 (0.5%)
Marital status
Type Dallas Riverside
Divorced 9.8% 8.4%
Never married 42.5% 44.1%
Now married 41.2% 41.9%
Separated 2.5% 1.9%
Widowed 4% 3.7%
Class of workers - percentage
Class of Workers DallasRiverside
Employee of private company 72.9% 69.3%
Private not-for-profit wage and salary workers 6.8% 6.6%
Self-employed workers in own not incorporated business 6.7% 5.3%
Local government workers 5.4% 9.4%
Self-employed in own incorporated business 3.8% 2.9%
State government workers 2.7% 5.4%
Federal government workers 1.7% 1.1%
Unpaid family workers 0.1% 0.1%
Class of workers - absolute values
Class of Workers DallasRiverside
Employee of private company 472,969 107,406
Federal government workers 10,908 1,699
Local government workers 34,824 14,564
Private not-for-profit wage and salary workers 43,818 10,183
Self-employed in own incorporated business 24,443 4,467
Self-employed workers in own not incorporated business 43,703 8,164
State government workers 17,325 8,293
Unpaid family workers 754 199

Industries and Occupations

Dallas is a major center for the oil and gas industry, IT and data management, and transportation logistics. Finance and corporate governance are also prominent, thanks to the presence of many Fortune 500 companies. In Riverside, the major industries are education, health services, and government, with the City of Riverside, Riverside Unified School District, and UC Riverside being the top employers.
Most common male industries
Industry DallasRiverside
Construction 16.8% 19.2%
Professional, scientific, and technical services 10.4% 3.0%
Retail trade 10.1% 11.7%
Manufacturing 9.4% 10.0%
Transportation and warehousing 8.3% 12.4%
Finance and insurance 5.9% 1.3%
Administrative and support and waste management services 5.6% 4.9%
Health care and social assistance 5.4% 5.4%
Accommodation and food services 5.3% 3.7%
Other services, except public administration 4.8% 5.6%
Educational services 3.9% 8.8%
Wholesale trade 3.7% 2.3%
Real estate and rental and leasing 3.2% 1.4%
Information 2.1% 2.6%
Arts, entertainment, and recreation 1.8% 1.7%
Public administration 1.7% 4.2%
Utilities 0.8% 0.8%
Mining, quarrying, and oil and gas extraction 0.4% 0.2%
Agriculture, forestry, fishing and hunting 0.2% 0.7%
Most common female industries
Industry DallasRiverside
Health care and social assistance 19.2% 20.1%
Retail trade 11.7% 13.1%
Educational services 11.2% 16.1%
Professional, scientific, and technical services 8.8% 3.0%
Finance and insurance 8.5% 3.2%
Accommodation and food services 7.8% 8.8%
Other services, except public administration 5.7% 4.6%
Manufacturing 5.6% 7.0%
Administrative and support and waste management services 5.5% 2.3%
Public administration 3.2% 4.9%
Transportation and warehousing 3.1% 6.7%
Real estate and rental and leasing 2.7% 1.8%
Wholesale trade 1.9% 2.1%
Information 1.7% 1.3%
Construction 1.3% 2.2%
Arts, entertainment, and recreation 1.1% 1.7%
Management of companies and enterprises 0.3% 0.1%
Agriculture, forestry, fishing and hunting 0.3% 0.5%
Utilities 0.3% 0.5%
Mining, quarrying, and oil and gas extraction 0.1% 0.0%
Most common male occupations
Occupation DallasRiverside
Construction and extraction occupations 13.0% 15.1%
Management occupations 11.2% 7.1%
Sales and related occupations 8.2% 8.0%
Business and financial operations occupations 7.6% 1.9%
Production occupations 6.6% 8.3%
Transportation occupations 6.5% 6.8%
Material moving occupations 6.5% 8.8%
Office and administrative support occupations 5.1% 6.3%
Installation, maintenance, and repair occupations 4.8% 6.1%
Building and grounds cleaning and maintenance occupations 4.4% 3.5%
Computer and mathematical occupations 4.1% 3.3%
Food preparation and serving related occupations 4.1% 4.1%
Architecture and engineering occupations 2.7% 2.0%
Arts, design, entertainment, sports, and media occupations 2.5% 2.1%
Health diagnosing and treating practitioners and other technical occupations 2.4% 1.2%
Educational instruction, and library occupations 2.3% 4.9%
Legal occupations 1.7% 0.1%
Personal care and service occupations 1.3% 0.8%
Firefighting and prevention, and other protective service workers including supervisors 1.3% 3.3%
Healthcare support occupations 1.0% 1.7%
Most common female occupations
Occupation DallasRiverside
Office and administrative support occupations 15.9% 22.8%
Sales and related occupations 10.5% 9.2%
Management occupations 10.0% 7.1%
Business and financial operations occupations 9.4% 4.1%
Educational instruction, and library occupations 8.0% 9.6%
Food preparation and serving related occupations 5.6% 6.2%
Healthcare support occupations 5.6% 6.2%
Health diagnosing and treating practitioners and other technical occupations 5.2% 5.1%
Production occupations 4.1% 4.7%
Material moving occupations 4.0% 6.0%
Building and grounds cleaning and maintenance occupations 3.7% 3.1%
Arts, design, entertainment, sports, and media occupations 2.9% 1.9%
Community and social service occupations 2.7% 3.5%
Personal care and service occupations 2.5% 2.6%
Legal occupations 2.3% 1.0%
Computer and mathematical occupations 1.6% 0.7%
Health technologists and technicians 1.4% 2.3%
Transportation occupations 1.1% 0.9%
Life, physical, and social science occupations 0.9% 1.2%
Food environment data per 10,000 residents
Food environment statistics DallasRiverside
Number of convenience stores (no gas) 2.8 1.5
Number of convenience stores (with gas) 1.2 0.4
Number of full-service restaurants 6.7 5.5
Number of grocery stores 1.6 1.6
Number of supercenters and club stores 0.1 0.1
Food environment - absolute values
Food environment statistics DallasRiverside
Number of convenience stores (no gas) 673 311
Number of convenience stores (with gas) 275 91
Number of full-service restaurants 1,603 1,125
Number of grocery stores 392 330
Number of supercenters and club stores 25 11
Obesity and diabetes
Food environment statistics rate DallasRiverside
Adult diabetes rate 8.8% 7.7%
Adult obesity rate 27.1% 24.5%
Low-income preschool obesity rate 17.0% 15.2%

Health Care

Healthcare in Dallas is top-notch with nationally ranked hospitals such as UT Southwestern Medical Center and Baylor University Medical Center. Riverside also boasts quality healthcare facilities, including the Riverside University Health System and Kaiser Permanente Riverside Medical Center.
Health (county statistics)
Type Dallas Riverside
General health status score of residents in this county from 1 (poor) to 5 (excellent) 3.4 3.4
Average weight of females (lbs) 171 lbs 161.6 lbs
Average weight of males (lbs) 194.3 lbs 193.1 lbs
Residents visited a dentist within the past year 61.7% 63.8%
Residents exercised in the past month 71.4% 70.4%
Adult residents drank alcohol in the past 30 days 69.3% 50%
Residents smoked 100+ cigarettes in their lives 39.8% 38.7%

Fatal vehicle accidents per 100,000 residents
Type Total count per 100,000Drunk per 100,000Fatal count per 100,000Pedestrian count per 100,000Person count per 100,000Vehicle count per 100,000
Year DallasRiversideDallasRiversideDallasRiversideDallasRiversideDallasRiversideDallasRiverside
2021 16.0 11.0 0.0 0.0 17.6 11.0 5.3 4.7 38.8 20.5 27.9 15.1
2020 15.4 11.4 4.4 3.8 17.0 12.1 5.9 2.9 33.7 22.9 24.8 17.5
2019 12.3 10.3 3.7 2.1 13.2 10.3 5.4 3.9 29.4 26.4 21.1 17.6
2018 14.2 7.0 4.2 3.0 14.8 8.2 5.0 1.2 33.6 16.4 24.1 12.2
2017 13.1 7.4 4.3 3.4 14.2 8.0 4.2 2.5 30.1 15.6 21.7 9.8
2016 13.1 7.7 3.9 3.1 14.1 8.7 4.5 1.2 32.9 18.9 21.4 13.9
2015 11.8 8.4 3.7 2.8 13.3 9.1 4.5 1.6 28.0 19.1 18.2 13.4
2014 10.8 9.7 3.2 2.8 11.6 10.0 4.5 4.1 24.4 24.7 16.6 15.3
2013 10.0 9.2 3.7 5.4 11.1 10.1 3.3 2.2 24.4 22.4 15.9 17.4
2012 10.0 5.7 3.4 2.2 10.6 6.1 3.5 2.6 24.0 13.7 15.6 10.5
2011 8.2 6.8 2.5 3.5 8.4 7.4 2.5 1.9 18.1 14.8 12.8 8.7
2010 9.1 6.9 4.3 1.6 9.9 6.9 2.2 1.6 22.0 13.5 14.4 8.6
2009 7.4 9.7 3.2 4.0 7.8 9.7 2.4 1.7 19.9 25.2 10.6 15.1
2008 8.8 8.2 4.1 4.8 9.5 9.2 2.8 3.4 24.3 21.1 14.5 17.1
2007 11.1 10.3 5.8 5.9 12.0 11.0 3.6 1.7 29.9 29.3 17.5 16.2
2006 11.1 11.8 4.8 5.2 11.7 12.5 2.8 2.8 30.1 31.2 18.0 18.7
2005 11.3 10.9 5.0 6.3 11.9 13.3 4.5 2.8 31.1 34.3 18.1 18.6
2004 13.9 10.2 6.5 3.2 14.6 10.5 5.8 3.5 43.0 29.8 24.0 14.7
2003 11.6 11.1 4.6 6.4 12.8 11.8 3.4 2.5 34.8 33.7 18.9 17.5
2002 12.4 14.3 4.7 7.0 13.7 16.1 3.7 2.2 33.4 43.3 18.7 22.7
2001 13.1 10.5 4.5 3.4 14.2 12.4 4.3 2.3 32.3 31.9 20.0 15.0
2000 12.5 9.8 4.0 2.4 14.1 9.8 4.0 2.7 35.4 27.4 20.8 14.1
1999 14.2 11.3 5.9 4.1 15.5 12.4 4.7 4.9 43.1 30.1 23.2 18.8
1998 15.0 13.1 4.5 5.0 15.3 16.2 5.3 3.5 42.6 34.3 23.0 20.8
1997 14.4 11.4 5.0 3.9 16.1 12.2 5.4 2.4 43.2 37.7 22.1 17.7
1996 14.4 9.9 4.2 4.4 16.4 11.9 4.9 2.8 43.9 24.6 23.1 14.7
1995 16.1 14.0 5.2 2.8 18.1 14.8 5.5 6.4 51.1 40.8 24.2 20.8
1994 12.5 16.1 6.0 4.8 13.1 19.8 5.0 4.4 35.5 47.6 18.4 23.4
1993 14.1 8.2 7.3 1.6 15.3 8.6 3.8 2.0 41.8 19.7 22.5 11.5
1992 13.2 8.3 6.5 0.8 15.1 8.3 4.5 2.1 34.8 28.7 19.3 14.6
1991 15.5 13.2 5.7 4.3 16.5 14.9 6.3 2.1 42.8 45.5 22.2 22.1
1990 15.5 15.1 7.5 6.9 16.9 18.2 0.0 0.0 43.4 50.2 22.8 27.3
1989 16.0 18.1 5.9 8.1 17.5 19.9 0.0 0.0 42.7 55.7 24.3 28.5
1988 15.2 17.2 6.4 7.0 16.6 18.1 0.0 0.0 40.8 50.6 22.9 26.9
1987 16.6 17.6 6.0 9.1 17.8 18.6 0.0 0.0 41.5 50.5 23.5 28.1
1986 17.9 14.2 8.7 5.9 19.0 16.7 0.0 0.0 49.0 30.4 27.4 19.1
1985 19.0 14.1 3.9 6.5 20.3 16.6 0.0 0.0 48.4 43.3 28.0 19.6
1984 19.1 17.1 2.6 10.4 21.3 19.7 0.0 0.0 45.1 36.8 27.1 21.8
1983 16.7 11.7 2.8 6.9 18.0 11.7 0.0 0.0 36.1 32.0 22.7 18.7
1982 19.2 14.3 3.6 7.7 20.2 17.1 0.0 0.0 44.9 34.1 25.7 20.4
1981 25.1 18.7 4.6 13.6 28.3 21.6 0.0 0.0 61.1 46.5 34.3 26.1
1980 21.0 15.2 2.7 8.2 23.0 18.2 0.0 0.0 46.8 35.2 26.5 23.4
1979 21.9 16.1 3.0 9.0 23.1 16.1 0.0 0.0 46.0 37.0 29.5 27.5
1978 19.0 16.4 1.8 8.5 20.7 18.8 0.0 0.0 44.6 31.6 25.7 21.9
1977 16.6 14.2 2.4 4.3 17.6 17.3 0.0 0.0 40.4 40.3 20.4 21.7
1976 16.0 13.3 0.3 5.1 17.5 13.9 0.0 0.0 42.5 35.4 22.4 18.9
1975 16.1 13.5 0.3 5.2 17.6 14.2 0.0 0.0 42.8 36.1 22.5 19.3

Fatal vehicle accidents
Type Total countDrunkFatal countPedestrian countPerson countVehicle count
Year DallasRiversideDallasRiversideDallasRiversideDallasRiversideDallasRiversideDallasRiverside
1975 141 21 3 8 154 22 0 0 374 56 197 30
1976 141 21 3 8 154 22 0 0 374 56 197 30
1977 147 23 21 7 156 28 0 0 358 65 181 35
1978 170 27 16 14 185 31 0 0 398 52 229 36
1979 197 27 27 15 208 27 0 0 413 62 265 46
1980 190 26 24 14 208 31 0 0 423 60 240 40
1981 230 33 42 24 259 38 0 0 559 82 314 46
1982 178 26 33 14 187 31 0 0 415 62 238 37
1983 156 22 26 13 168 22 0 0 338 60 212 35
1984 181 33 25 20 201 38 0 0 426 71 256 42
1985 182 28 37 13 194 33 0 0 463 86 268 39
1986 173 29 84 12 184 34 0 0 473 62 265 39
1987 162 37 59 19 174 39 0 0 405 106 229 59
1988 150 37 63 15 164 39 0 0 402 109 226 58
1989 159 40 59 18 174 44 0 0 426 123 242 63
1990 157 35 76 16 171 42 0 0 439 116 231 63
1991 159 31 58 10 169 35 64 5 438 107 227 52
1992 136 20 67 2 156 20 46 5 358 69 199 35
1993 146 20 76 4 158 21 39 5 433 48 233 28
1994 130 40 62 12 136 49 52 11 368 118 191 58
1995 167 35 54 7 188 37 57 16 532 102 252 52
1996 151 25 44 11 172 30 51 7 460 62 242 37
1997 152 29 53 10 170 31 57 6 458 96 234 45
1998 161 34 48 13 164 42 57 9 457 89 246 54
1999 153 30 63 11 167 33 51 13 464 80 250 50
2000 149 25 47 6 167 25 48 7 421 70 247 36
2001 157 28 54 9 170 33 52 6 387 85 240 40
2002 150 39 57 19 165 44 45 6 404 118 226 62
2003 142 31 56 18 156 33 42 7 424 94 230 49
2004 172 29 80 9 180 30 71 10 531 85 296 42
2005 141 31 62 18 148 38 56 8 388 98 226 53
2006 139 34 60 15 147 36 35 8 378 90 226 54
2007 141 30 73 17 152 32 46 5 379 85 221 47
2008 113 24 53 14 121 27 36 10 311 62 185 50
2009 96 29 41 12 101 29 31 5 258 75 138 45
2010 109 21 51 5 118 21 26 5 264 41 172 26
2011 100 21 31 11 103 23 30 6 221 46 157 27
2012 124 18 42 7 131 19 43 8 298 43 194 33
2013 126 29 46 17 140 32 42 7 307 71 200 55
2014 138 31 41 9 149 32 58 13 312 79 213 49
2015 154 27 48 9 173 29 59 5 364 61 237 43
2016 174 25 52 10 186 28 60 4 436 61 283 45
2017 176 24 58 11 190 26 57 8 404 51 291 32
2018 190 23 56 10 198 27 67 4 451 54 324 40
2019 165 34 50 7 177 34 72 13 395 87 283 58
2020 201 36 57 12 221 38 77 9 439 72 323 55
2021 206 35 0 0 227 35 68 15 500 65 360 48
Police full-time law enforcement employees
Year DallasRiverside
2021 3,761 520
2020 3,646 522
2019 3,624 512
2018 3,581 522
2017 3,658 496
2016 3,829 503
2015 4,040 515
2014 4,086 520
2013 4,028 520
2012 0 520
2011 4,052 511
2010 4,241 512
2009 4,141 537
2008 4,196 554
2007 3,816 576
2006 3,610 565
2005 3,518 541
2004 3,436 549
2003 3,510 522
Police full-time law enforcement employees (per 1,000 residents)
Year DallasRiverside
2021 2.8 1.6
2020 2.7 1.6
2019 2.7 1.5
2018 2.6 1.6
2017 2.7 1.5
2016 2.9 1.5
2015 3.1 1.6
2014 3.2 1.6
2013 3.2 1.6
2012 0.0 1.7
2011 3.3 1.7
2010 3.5 1.7
2009 3.2 1.8
2008 3.3 1.9
2007 3.1 1.9
2006 2.9 1.9
2005 2.9 1.9
2004 2.8 1.9
2003 2.9 1.9
Local government: full-time employees
Job DallasRiverside
Airports 2,287 6
Financial administration 342 56
Firefighters 1,955 225
Fire - other 100 12
Health 517 0
Judicial and legal 372 38
Local libraries 316 53
Natural resources 157 0
Other and unallocable 697 164
Other government administration 502 141
Parks and recreation 906 67
Police - other 544 142
Police protection - officers 2,958 364
Sewerage 197 106
Solid waste management 471 53
Streets and highways 575 63
Totals for government 14,655 2,133
Water supply 1,268 156
Welfare 250 39
Local government: part-time employees
Job DallasRiverside
Airports 2 0
Judicial and legal 2 0
Local libraries 43 9
Other and unallocable 10 2
Other government administration 2 8
Parks and recreation 202 173
Police - other 0 21
Sewerage 1 0
Solid waste management 0 3
Streets and highways 2 0
Totals for government 264 241
Water supply 0 2
Place of birth - Foreign born
Residents DallasRiverside
All residents 23.3% 22.7%
American Indian / Alaska Native residents 51.1% 26.1%
Asian residents 68.3% 53.1%
Black or African American residents 9.1% 13.7%
Native Hawaiian / Pacific Islander residents 18.3% 19.5%
Other race residents 47.9% 34.0%
Two or more races residents 32.3% 17.1%
White residents 8.4% 5.1%
White alone, not Hispanic / Latino residents 5.1% 5.1%
Place of birth - Native, outside of US
Residents DallasRiverside
All residents 1.5% 1.0%
American Indian / Alaska Native residents 2.6% 0.0%
Asian residents 1.8% 3.0%
Black or African American residents 0.5% 0.2%
Native Hawaiian / Pacific Islander residents 17.5% 9.3%
Other race residents 1.8% 0.9%
Two or more races residents 2.1% 1.7%
White residents 1.7% 1.1%
White alone, not Hispanic / Latino residents 1.1% 1.1%
Place of birth - Born in state of residence
Residents DallasRiverside
All residents 54.8% 65.7%
American Indian / Alaska Native residents 39.1% 66.9%
Asian residents 20.0% 38.3%
Black or African American residents 68.1% 64.4%
Native Hawaiian / Pacific Islander residents 19.7% 54.3%
Other race residents 44.7% 62.8%
Two or more races residents 53.2% 75.5%
White residents 55.5% 71.9%
White alone, not Hispanic / Latino residents 53.7% 67.6%
Place of birth - Born in other state
Residents DallasRiverside
All residents 20.4% 10.5%
American Indian / Alaska Native residents 7.2% 7.0%
Asian residents 9.9% 5.6%
Black or African American residents 22.3% 21.8%
Native Hawaiian / Pacific Islander residents 44.5% 16.9%
Other race residents 5.6% 2.3%
Two or more races residents 12.4% 5.7%
White residents 34.4% 22.0%
White alone, not Hispanic / Latino residents 40.0% 26.3%
English speakers (speaking English at home)
Type Dallas Riverside
Born in the United States residents 89.5% 88.2%
Foreign born residents 8.9% 8%
Native, born elsewhere residents 50.7% 52.4%
Total residents 57.6% 53.5%
Mechanisms of homicide
Mechanism DallasRiverside
Homicides from 2000 to 2006 1,824 730
Cut / Pierce 117 88
Firearm 1,343 489
Suffocation 36 26
Mechanisms of homicide per 1,000,000 residents
Mechanism DallasRiverside
Homicides from 2000 to 2006 113.8 59.0
Cut / Pierce 7.3 7.1
Firearm 83.8 39.5
Suffocation 2.2 2.1
Mechanisms of suicide per 1,000,000 residents
Mechanism DallasRiverside
Suicides from 2000 to 2006 91.8 96.6
Cut / Pierce 1.6 2.0
Fall 2.6 0
Firearm 50.4 49.5
Poisoning 18.7 14.9
Suffocation 15.9 24.7

Infrastructure

Dallas boasts robust infrastructure, with expansive highways, modern public buildings, and a rapidly developing downtown area. The Dallas/Fort Worth International Airport is one of the busiest in the world. Riverside has solid infrastructure as well but on a smaller scale commensurate with its size. Its three major freeways are complimented by a growing metropolitan area.
Infrastructure
Type Dallas Riverside
Hospitals 74 20
TV stations 25 5
Bank branches located here 394 61
Bank institutions located here 80 18
Main business address for public companies 122 2
Drinking water stations with no reported violations in the past 8 2
Drinking water stations with reported violations in the past 9 0

Schools

School facilities
Type Dallas Riverside
Private elementary/middle schools 50 10
Private high schools 26 8
Public elementary/middle schools 271 54
Public high schools 81 24
Colleges/Universities 44 10
HMDA - Conventional home purchase loans - Applications denied
Year DallasRiverside
1999 5,030 794
2000 3,390 375
2001 2,626 310
2002 2,657 405
2003 3,617 1,399
2004 5,460 1,892
2005 7,445 2,728
2006 7,397 3,235
2007 5,056 1,568
2008 2,200 544
2009 1,121 285

Culture and Food

Dallas has a vibrant culture steeped in southern charm. Its culinary scene is renowned, with specialties like Texas BBQ and Tex-Mex cuisine. Riverside also has a diverse cultural scene with a California twist. Its food scene includes offerings from various global cuisines and the famous California-style pizza.

Sports Teams

Sports fans will find plenty to cheer about in Dallas, home to the Dallas Cowboys (NFL), the Mavericks (NBA), and the Stars (NHL). Riverside does not host any major professional sports teams, but sports fans can find plenty of collegiate sports action at the University of California, Riverside.
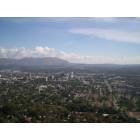