Dallas, Texas, and Toledo, Ohio present contrasting lifestyles in multiple aspects. Whether you are considering moving or just visiting, these cities offer different experiences. Dallas offers an urban feel and warm climate with many economic opportunities, while Toledo offers a smaller-city vibe, lower overall cost of living, and a critical position in the manufacturing industry.
Distance between
Dallas, TX and
Toledo, OH : 948.5 miles
Dallas's population is larger by 380%. Its population has grown by 99,877 people (8.4%) since 2000. The population of Toledo has decreased by 45,111 people (14.4%) during that time.
Dallas has a higher crime rate compared to Toledo, driven primarily by property crimes. However, the occurrence of crime tends to be localized in particular neighborhoods, so choosing the right area to reside can mitigate risk. Conversely, Toledo has made significant strides in decreasing its overall crime rate in recent years.
City-data.com crime index counts serious crimes and violent crime more heavily. It adjusts for the number of visitors and daily workers commuting into cities. (higher means more crime, U.S. average = 301.1)
City-data.com crime index counts serious crimes and violent crime more heavily. It adjusts for the number of visitors and daily workers commuting into cities. (higher means more crime, U.S. average = 301.1)
Sex Offenders
According to our data, there are 4,297 registered sex offenders living in Dallas and 850 registered sex offenders living in . The ratio of residents to sex offenders in Dallas is 307 to 1; the ratio in Toledo is 328 to 1. The number of registered sex offenders compared to the number of residents in Dallas is near to than in Toledo.
Cost of Living
The overall cost of living in Dallas is about average for a major U.S. city, slightly higher than the national average. This is mainly driven up by housing prices, which are higher, particularly in the most desirable neighborhoods. On contrary, Toledo offers a significantly lower cost of living, with housing being exceptionally affordable.
Income Tax
In this aspect, Dallas stands out as Texas has no state income tax. On the other hand, Toledo residents pay both city and state income taxes.
Property Tax
The property tax rates in Dallas are quite high, with a rate of approximately 2.09%. In contrast, Toledo's property tax rate is about 1.48% which is below the Ohio state average.
Sales Tax
The combined city and state sales tax in Dallas is higher than in Toledo. The rate in Dallas is 8.25%, while in Toledo it's 7.25%.
Income
Type
Dallas
Toledo
Estimated median household income
$57,995
$44,150
Estimated per capita income
$38,479
$25,641
Cost of living index (U.S. average is 100)
96.1
91.8
If you make $50,000 in Toledo, you will have to make $52,342 in Dallas to maintain the same standard of living.
Geographical Conditions
Dallas is located in North Texas, characterized by flat terrain with many parks. Toledo is in northwest Ohio, near Lake Erie and has a mix of urban, suburban, and rural regions surrounding the city. It also benefits from its proximity to the beautiful Maumee River.
Dallas offers a broad range of public, charter, and private schools, including some nationally recognized names like the School for the Talented & Gifted. In the higher education sector, Dallas is home to Southern Methodist University and the University of Texas at Dallas. Toledo boasts a strong public school system and is home to the University of Toledo, which offers a variety of undergraduate and graduate programs.
Dallas has a strong economy, driven by sectors such as technology, healthcare, and finance. Unemployment rates in Dallas are below the national average. Toledo is an important hub in the Great Lakes region for manufacturing and healthcare. Although its economy is smaller than Dallas, it is diverse with a particular strength in auto manufacturing.
Biggest Employers
The biggest employers in Dallas include American Airlines, Texas Health Systems, and AT&T. In Toledo, the largest employers are healthcare providers, like ProMedica Health System, and auto manufacturers, like Fiat Chrysler.
There were 2,245 building permits issued in Dallas in 2012 (1436 more than in 2011) compared to 23 building permits issued in Toledo in 2012 (10 less than in 2011).
In Dallas (Dallas County), 57.3% voted for Democrats and 41.8% for Republicans in 2012 Presidential Election. In Toledo (Lucas County), 65.2% voted for Democrats and 33.4% for Republicans.
Elections
Type
Democrats
Republicans
Other
Year
Dallas
Toledo
Dallas
Toledo
Dallas
Toledo
2020
65.1%
57.5%
33.4%
40.8%
1.4%
1.7%
2016
60.8%
55.9%
34.7%
38.2%
4.5%
5.9%
2012
57.3%
65.2%
41.8%
33.4%
1.0%
1.4%
2008
57.4%
65.1%
42.0%
33.6%
0.6%
1.4%
2004
49.0%
60.4%
50.4%
39.6%
0.5%
0.0%
2000
45.0%
57.9%
52.7%
39.2%
2.4%
2.8%
1996
46.0%
57.7%
46.8%
32.0%
7.2%
10.3%
Breakdown of population affiliated with a religious congregation
Type
Adherents
Congregations
Religion
Dallas
Toledo
Dallas
Toledo
CATHOLIC CHURCH
18.9%
20.9%
2.4%
9.4%
SOUTHERN BAPTIST CONVENTION
11.0%
0.3%
31.1%
3.5%
MUSLIM ESTIMATE
3.6%
0.4%
1.1%
0.8%
EPISCOPAL CHURCH
1.0%
0.5%
1.5%
2.2%
SEVENTH DAY ADVENTIST CHURCH
0.5%
0.2%
1.7%
0.5%
EVANGELICAL LUTHERAN CHURCH IN AMERICA
0.3%
4.1%
0.9%
9.1%
LUTHERAN CHURCH
0.3%
0.7%
0.7%
2.7%
AMERICAN BAPTIST CHURCHES IN THE USA
0.1%
0.5%
0.2%
3.2%
Weather
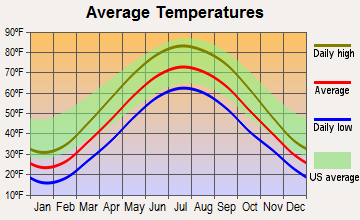
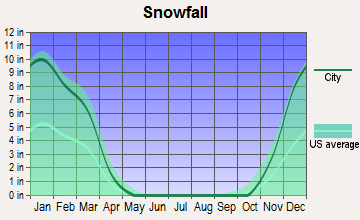
Weather in Dallas is characterized by hot, humid summers and mild winters. Extreme heat can occasionally present challenges during the summer months. On the other hand, Toledo experiences a full four-season climate, with cold, snowy winters, warm, humid summers, and beautiful springs and autumns.
Weather and climate
Type
Dallas
Toledo
Temperature - Average
66.6°F
49.2°F
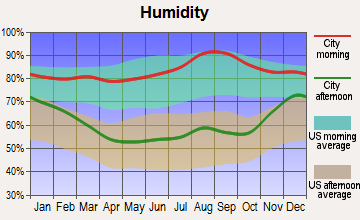
Humidity - Average morning or afternoon humidity
71.3%
76.9%
Humidity - Differences between morning and afternoon humidity
34%
37%
Humidity - Maximum monthly morning or afternoon humidity
82%
89%
Humidity - Minimum monthly morning or afternoon humidity
48%
52%
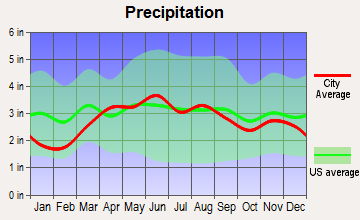
Precipitation - Yearly average
37.3 in
33.3 in
Snowfall - Yearly average
4.2 in
75.3 in
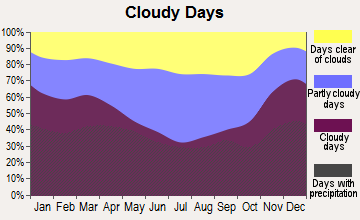
Clouds - Number of days clear of clouds
22.8%
12.3%
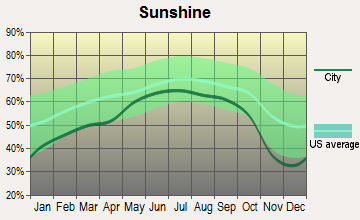
Sunshine amount - Average
66.6%
55.1%
Sunshine amount - Differences during a year
20%
36%
Sunshine amount - Maximum monthly
74%
65%
Sunshine amount - Minimum monthly
54%
29%
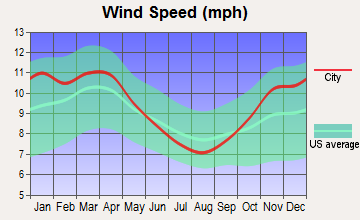
Wind speed - Average
10.3 mph
9.4 mph
Average climate in Dallas, Texas
Average climate in Toledo, Ohio
Air pollution
Type
AQI
NO2
OZONE
PB
PM10
PM25
SO2
Year
Dallas
Toledo
Dallas
Dallas
Toledo
Dallas
Toledo
Dallas
Dallas
Toledo
2018
86
47
5.7
N/A
28.7
30.1
N/A
N/A
N/A
N/A
9.7
N/A
0.4
0.7
2017
84
45
5.5
N/A
28.6
29.0
N/A
N/A
N/A
N/A
9.1
N/A
0.3
0.4
2016
81
50
6.1
N/A
27.2
29.9
N/A
N/A
N/A
N/A
8.4
N/A
0.2
0.5
2015
85
45
6.5
N/A
26.7
28.7
N/A
N/A
N/A
N/A
8.9
N/A
0.3
0.9
2014
83
50
6.3
N/A
27.6
28.8
N/A
N/A
N/A
N/A
9.9
N/A
0.3
1.7
2013
97
40
7.3
N/A
28.8
25.2
N/A
N/A
N/A
N/A
13.0
N/A
0.2
1.0
2012
116
84
8.6
N/A
31.0
30.6
N/A
N/A
23.5
N/A
12.0
N/A
0.3
N/A
2011
98
65
9.4
N/A
30.9
25.7
N/A
N/A
21.0
N/A
11.9
N/A
0.6
N/A
2010
79
69
9.4
N/A
28.3
27.2
N/A
N/A
24.6
N/A
N/A
N/A
0.7
N/A
2009
88
64
9.2
N/A
28.8
25.4
N/A
N/A
21.4
N/A
N/A
N/A
0.5
N/A
2008
88
68
9.8
N/A
29.2
26.8
0.121
N/A
21.6
N/A
N/A
N/A
0.5
N/A
2007
94
86
11.0
N/A
25.7
25.9
0.070
N/A
24.2
N/A
N/A
N/A
0.3
3.8
2006
107
70
10.8
N/A
30.6
24.7
0.106
N/A
22.8
N/A
N/A
N/A
0.7
3.7
2005
108
84
13.0
N/A
29.7
27.8
0.142
N/A
21.6
N/A
11.0
N/A
0.9
5.1
2004
96
67
12.3
N/A
26.0
23.6
0.099
N/A
19.2
N/A
N/A
N/A
0.8
5.6
2003
102
77
13.6
N/A
27.1
26.0
0.121
N/A
18.5
N/A
N/A
N/A
1.0
6.5
2002
100
85
14.0
N/A
25.2
27.5
0.080
N/A
23.5
N/A
N/A
N/A
0.4
5.7
2001
100
76
14.3
N/A
26.0
26.9
0.069
N/A
23.4
N/A
N/A
N/A
1.0
5.3
2000
109
64
14.5
N/A
27.0
24.0
0.092
N/A
23.4
N/A
N/A
N/A
1.1
4.2
Natural disasters
Type
Dallas
Toledo
Tornado activity compared to U.S. average
254.7%
144.4%
Earthquake activity compared to U.S. average
567%
67.7%
Natural disasters compared to U.S. average
21%
13%
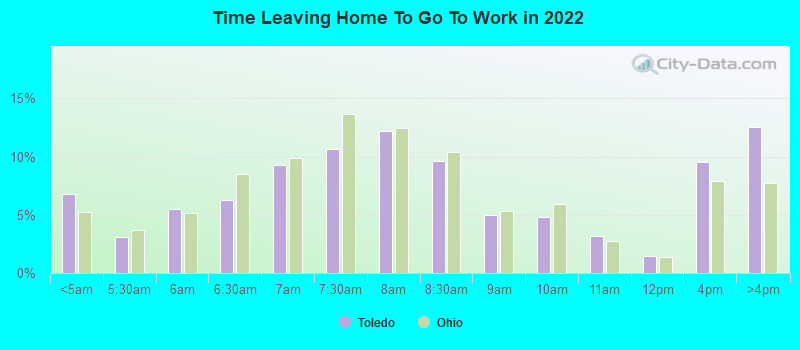
Transportation
Dallas boasts a robust public transit system that includes light rails and buses operated by DART. Additionally, the city has extensive highways and toll roads. Toledo is more car-dependent, with a less advanced public transit system. However, traffic and commute times in Toledo remain low due to the city's smaller size.
Transport
Type
Dallas
Toledo
Amtrak stations
1
1
Amtrak stations nearby
1
1
FAA registered aircraft
2
102
FAA registered aircraft manufacturers and dealers
56
7
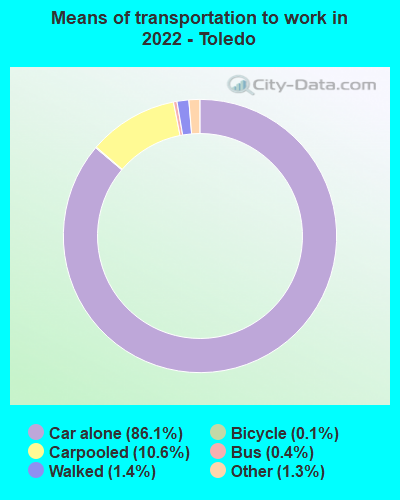
Means of transportation to work
Type
Dallas
Toledo
Bicycle
0.3%
0.2%
Bus
1.4%
1.1%
Carpooled
10.9%
9.2%
Car alone
83.9%
85.7%
Railroad
0.2%
0%
Subway
0.2%
0%
Taxicab
0.1%
0.2%
Walked
1.6%
2.2%
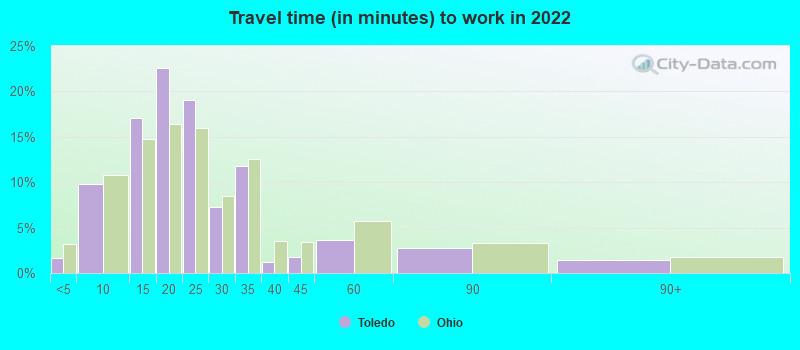
Average travel time to work
Type
Dallas
Toledo
Average
31.5 min
22.9 min
Other means
26.5 min
20.4 min
Public transportation
46 min
37.9 min
Private vehicle occupancy
Type
Dallas
Toledo
Average
1.2
1.1
Drove alone
86.8%
88.6%
In 2 person carpool
9%
9.9%
In 3 person carpool
2.6%
0.6%
In 4 person carpool
0.9%
0.6%
In 5-6 person carpool
0.5%
0.2%
In 7+ person carpool
0.2%
0.1%
How many people usually rode to work in the car, truck or van.
Real Estate
Real estate in Dallas is higher on average compared to Toledo, with the latter offering more affordable options. The housing market in Dallas also tends to be more competitive.
Neighborhoods
Dallas is notable for its vibrant, diverse neighborhoods, such as the Arts District and Uptown, which offer an urban lifestyle. Toledo's Old West End neighborhood is known for its Victorian houses and quiet, tree-lined streets.
Houses and residents
Type
Dallas
Toledo
Houses
591,773
133,129
Average household size (people)
2.6
2.3
Median year apartment built
1987
1967
Median year house/condo built
1969
1953
Length of stay in the house since moving in
13.9 years
15.4 years
Houses occupied
536,008 (90.6%)
120,895 (90.8%)
Houses occupied by owners
229,518 (42.8%)
67,831 (56.1%)
Houses occupied by renters
306,490 (57.2%)
53,064 (43.9%)
Median rent asked for vacant for-rent units
$1,403
$666.64
Median monthly housing costs
$1,225
$752
Median price asked for vacant for-sale houses and condos
$574,934
$77,176
Estimated median house or condo value
$267,600
$100,100
Median numbers of rooms
4.6
5.7
Median number of rooms in apartments
3.7
4.5
Median number of rooms in houses and condos
6.1
6.4
Median house price - detached houses
$410,272
$114,880
Median house price - in 2-unit structures
$255,160
$106,468
Median house price - in 3-to-4-unit structures
$230,927
$56,240
Median house price - in 5 or more unit structures
$444,589
$108,374
Median house price - mobile homes
$91,039
$141,902
Median house price - Townhouses or other attached units
$350,045
$127,839
Median house price - All housing units
$402,215
$114,763
Median house age
40
65
Renting percentage
55.9%
44.5%
Housing density (houses/condos per square mile)
1,727.6
1,651.3
House value disparities
41.3%
38.9%
Household income disparities
48.2%
45.1%
Median household income for houses/condes with a mortgage
$103,798
$70,155
Median household income for apartments without a mortgage
$61,909
$46,019
Housing units without a mortgage
1,309 (1%)
1,756 (4.5%)
Housing units with both a second mortgage and home equity loan
3,320 (2.6%)
2,444 (6.2%)
Housing units with a mortgage
124,846 (99%)
37,635 (95.5%)
Housing units with a home equity loan
204 (0.2%)
70 (0.2%)
Housing units with a second mortgage
5,351 (4.2%)
3,377 (8.6%)
House/condo owner moved in on average (years ago)
12
15
House/condo renter moved in on average (years ago)
1
3
Housing units lacking complete kitchen facilities
1.2%
4.1%
Housing units lacking complete plumbing facilities
0.9%
4.3%
Housing units in structures
Housing units in structures
Dallas
Toledo
One, detached
41.8%
66.3%
One, attached
4.3%
3.4%
Two
1.5%
5.0%
3 or 4
4.9%
4.7%
5 to 9
7.9%
5.2%
10 to 19
12.1%
4.9%
20 to 49
8.1%
3.1%
50 or more
18.4%
5.4%
Mobile homes
1.0%
2.0%
Median real estate property taxes paid for housing units
Self-employed workers in own not incorporated business
43,703
5,059
State government workers
17,325
3,238
Unpaid family workers
754
91
Industries and Occupations
The main industries driving Dallas's economy are finance, IT, defense, and telecommunications. In contrast, manufacturing plays an important role in Toledo's economy, as it's a critical point in the auto parts manufacturing supply chain.
Dallas is one of the top cities for healthcare in the country, with nationally ranked hospitals like University of Texas Southwestern Medical Center. Toledo, although smaller, hosts a strong healthcare sector. The ProMedica Toledo Hospital is notably recognized and caters to most healthcare needs.
Health (county statistics)
Type
Dallas
Toledo
General health status score of residents in this county from 1 (poor) to 5 (excellent)
Dallas, being a larger and wealthier city, has more developed infrastructure than Toledo. The city boasts a robust network of highways and public transportation systems and an international airport. Toledo has a decent infrastructure system but lacks the extensive network of public transportation found in Dallas. However, it does benefit from its location near several major freight rail lines and highways.
Infrastructure
Type
Dallas
Toledo
Hospitals
74
18
TV stations
25
12
Arenas or stadiums
2
2
Bank branches located here
394
77
Bank institutions located here
80
11
Main business address for public companies
122
9
Drinking water stations with no reported violations in the past
8
10
Drinking water stations with reported violations in the past
HMDA - Conventional home purchase loans - Applications denied
Year
Dallas
Toledo
1999
5,030
1,192
2000
3,390
1,302
2001
2,626
1,034
2002
2,657
719
2003
3,617
841
2004
5,460
1,086
2005
7,445
1,399
2006
7,397
1,229
2007
5,056
767
2008
2,200
408
2009
1,121
149
Culture and Food
Dallas offers a vibrant, diverse food scene, with Mexican and BBQ standing out. For culture, Dallas's rich arts scene includes the Dallas Museum of Art and Dallas Symphony Orchestra. As for Toledo, it is known for its Polish and German cuisines. It has a robust arts scene as well, with highlights being the Toledo Museum of Art and its Glass Pavilion.
Sports Teams
Dallas is a major sports city, being home to the Dallas Cowboys (NFL), Dallas Mavericks (NBA), and Texas Rangers (MLB). Toledo, while smaller, does host the highly successful Toledo Mud Hens minor league baseball team and Toledo Walleye minor league hockey team.


 Dallas, TX
 Toledo, OH