Denver, CO and East Seattle, WA are two unique and diverse cities, each with its own personalities and characteristics. A comparison of these two cities touches on several factors such as crime, cost of living, economy, educational aspects, the work scene, healthcare, and more. This detailed guide will help both prospective residents and tourists make an informed choice about the potential benefits and downsides of these cities.
Denver's crime rate is higher than the national average, with property crimes being more prevalent. However, East Seattle maintains a comparatively lower crime rate than the national average, making it a safer choice. Both cities implement various safety measures and police enforcement, but the impact varies.
Cost of Living
The cost of living in Denver is slightly lower than East Seattle. Seattle's higher cost is due to more expensive housing, utility costs, and overall consumer prices. These expenses can make a notable difference for those considering relocation.
Property Tax
Denver residents can expect lower property taxes compared to those in East Seattle, which could make homeownership more feasible for some.
Sales Tax
Both Colorado and Washington do not have a state income tax which is a major consideration for new residents. However, Washington has one of the highest sales taxes in the country, while Colorado's is significantly lower.
Income
Type
Denver
East Seattle
Estimated median household income
$81,630
$135,835
Estimated per capita income
$52,690
$77,151
Cost of living index (U.S. average is 100)
111.3
128.6
If you make $50,000 in Denver, you will have to make $57,772 in East Seattle to maintain the same standard of living.
Geographical Conditions
Denver's unique location at the foot of the Rocky Mountains offers many recreational activities and stunning scenery. East Seattle, on the other hand, boasts beautiful bodies of water, mountain views, and lush green landscapes.
Geographical information
Type
Denver
East Seattle
Land area
153.4 sq. miles
217.1 sq. miles
Population density
4,639.5 people per sq. mile
2,361.6 people per sq. mile
Relative area comparison
Denver, CO East Seattle, WA
Education
Both Denver and East Seattle are served by public and private schools with traditionally strong reputations. However, East Seattle has a slightly higher education index, due in part to being home to top-tier universities, such as the University of Washington.
Denver, nicknamed the "Mile-High City," has a thriving economy featuring sectors like technology, healthcare, and tourism. Whereas East Seattle has a strong job market fueled by the tech industry, with giants such as Microsoft and Amazon situated nearby.
Biggest Employers
Denver's largest employers include the government sector, HealthONE Corporation, CenturyLink, and United Airlines. In contrast, in East Seattle, Microsoft, Amazon, and the University of Washington reign as the biggest employers.
In Denver (Denver County), 73.9% voted for Democrats and 24.3% for Republicans in 2012 Presidential Election. In East Seattle (King County), 69.0% voted for Democrats and 28.5% for Republicans.
Elections
Type
Democrats
Republicans
Other
Year
Denver
East Seattle
Denver
East Seattle
Denver
East Seattle
2020
80.1%
75.1%
18.3%
22.3%
1.6%
2.6%
2016
74.2%
70.0%
19.0%
21.1%
6.8%
8.9%
2012
73.9%
69.0%
24.3%
28.5%
1.7%
2.5%
2008
75.8%
70.2%
23.2%
28.1%
1.0%
1.7%
2004
69.7%
65.1%
29.3%
33.8%
0.9%
1.1%
2000
62.0%
60.3%
30.9%
34.5%
7.0%
5.2%
1996
61.8%
56.4%
30.0%
31.4%
8.2%
12.2%
Breakdown of population affiliated with a religious congregation
Type
Adherents
Congregations
Religion
Denver
East Seattle
Denver
East Seattle
CATHOLIC CHURCH
26.6%
14.4%
8.7%
4.9%
AMERICAN BAPTIST CHURCHES IN THE USA
2.1%
0.6%
4.3%
2.9%
EPISCOPAL CHURCH
1.1%
0.8%
3.2%
2.4%
SALVATION ARMY
1.1%
0.1%
0.7%
0.3%
SOUTHERN BAPTIST CONVENTION
0.9%
0.3%
6.8%
3.8%
SEVENTH DAY ADVENTIST CHURCH
0.7%
0.6%
3.0%
2.3%
MUSLIM ESTIMATE
0.5%
0.6%
0.9%
1.4%
EVANGELICAL LUTHERAN CHURCH IN AMERICA
0.4%
1.3%
2.7%
4.7%
LUTHERAN CHURCH
0.3%
0.5%
2.3%
2.0%
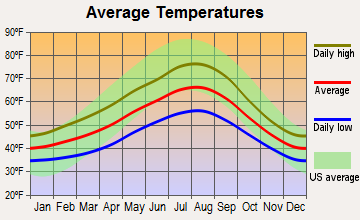
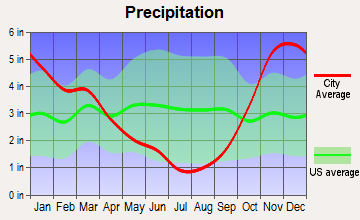
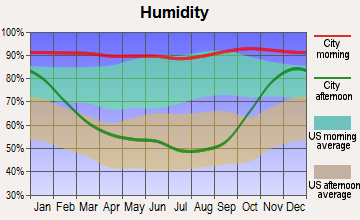
Weather
Denver, located in Colorado, is popular for its 300 days of sunshine annually, whereas East Seattle experiences a more temperate maritime climate with mild, wet winters, and dry summers. Depending on individual preference, Denver might be the best option for those who enjoy the sun more year-round.
Weather and climate
Type
Denver
East Seattle
Temperature - Average
49.5°F
52.5°F
Humidity - Average morning or afternoon humidity
50.6%
78.5%
Humidity - Differences between morning and afternoon humidity
20%
38%
Humidity - Maximum monthly morning or afternoon humidity
55%
86%
Humidity - Minimum monthly morning or afternoon humidity
35%
48%
Precipitation - Yearly average
17 in
36.8 in
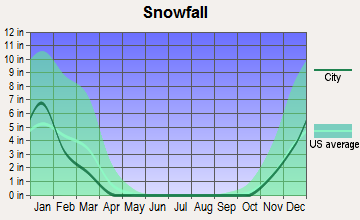
Snowfall - Yearly average
114 in
21.4 in
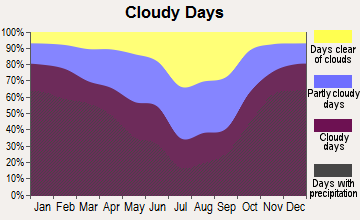
Clouds - Number of days clear of clouds
19.2%
11.7%
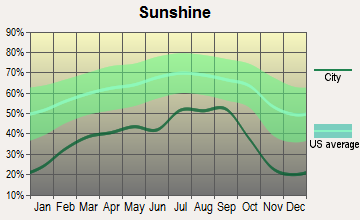
Sunshine amount - Average
75.6%
49.4%
Sunshine amount - Differences during a year
10%
44%
Sunshine amount - Maximum monthly
74%
64%
Sunshine amount - Minimum monthly
64%
20%
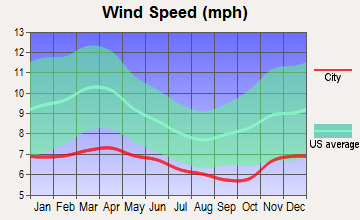
Wind speed - Average
8.6 mph
8.6 mph
Average climate in Denver, Colorado
Average climate in East Seattle, Washington
Air pollution
Type
AQI
CO
NO2
OZONE
PB
PM10
PM25
SO2
Year
Denver
East Seattle
Denver
East Seattle
Denver
East Seattle
Denver
East Seattle
Denver
East Seattle
Denver
East Seattle
Denver
East Seattle
Denver
East Seattle
2018
100
85
0.50
0.21
25.4
10.6
27.9
21.0
N/A
N/A
29.2
N/A
8.6
5.1
0.7
0.7
2017
95
100
0.49
0.23
25.9
11.1
27.6
21.2
N/A
N/A
22.0
N/A
8.4
4.6
0.8
0.3
2016
90
67
0.53
0.22
27.7
11.9
27.2
20.2
N/A
N/A
22.6
N/A
8.7
3.8
1.0
0.6
2015
101
88
0.53
0.23
27.8
10.8
25.2
19.4
N/A
N/A
21.0
N/A
10.4
5.6
1.0
0.8
2014
94
75
0.53
0.24
25.4
11.5
24.6
19.5
N/A
N/A
25.1
N/A
10.1
5.7
1.3
N/A
2013
85
81
0.45
0.24
21.9
N/A
24.0
17.2
N/A
N/A
24.4
N/A
N/A
5.9
1.5
0.8
2012
91
83
0.33
0.23
18.9
N/A
26.2
19.3
N/A
N/A
24.9
N/A
N/A
5.2
1.4
1.0
2011
91
73
0.34
0.24
18.1
N/A
25.8
18.6
N/A
N/A
23.7
N/A
N/A
5.2
1.6
1.1
2010
82
73
0.43
0.24
16.3
N/A
23.6
18.0
N/A
N/A
26.4
N/A
N/A
4.4
1.0
1.1
2009
79
94
0.41
0.27
14.1
N/A
23.1
18.3
0.005
N/A
22.2
N/A
N/A
6.0
1.3
1.4
2008
85
80
0.43
0.30
17.3
N/A
26.0
17.8
0.008
N/A
25.2
N/A
N/A
5.4
1.6
1.3
2007
96
85
0.37
0.30
20.6
N/A
21.9
17.7
0.007
N/A
30.2
19.0
N/A
6.4
1.2
1.5
2006
89
102
0.51
N/A
19.0
N/A
22.1
18.4
0.008
N/A
28.0
21.1
N/A
7.2
1.4
N/A
2005
86
104
0.57
0.80
21.3
18.3
20.9
N/A
0.068
N/A
30.9
22.9
N/A
7.6
1.5
3.5
2004
82
110
0.60
0.81
21.2
17.9
19.2
N/A
0.012
N/A
28.6
N/A
N/A
8.3
1.8
3.0
2003
106
100
0.60
0.85
21.2
18.5
20.8
N/A
0.015
N/A
32.6
N/A
N/A
8.3
1.9
2.4
2002
86
90
0.65
1.07
19.2
19.3
20.4
N/A
0.014
N/A
35.7
N/A
N/A
10.7
2.5
2.7
2001
95
91
0.86
1.08
23.6
20.5
18.6
N/A
0.012
0.004
32.6
N/A
N/A
11.1
2.6
3.7
2000
93
99
0.81
1.21
13.4
20.9
19.2
N/A
0.013
N/A
12.2
N/A
N/A
12.1
2.1
3.2
Natural disasters
Type
Denver
East Seattle
Tornado activity compared to U.S. average
129.5%
5.5%
Earthquake activity compared to U.S. average
811.7%
1,403%
Natural disasters compared to U.S. average
10%
30%
Transportation
Denver's Regional Transportation District (RTD) offers buses, light rails, and trains, providing extensive coverage of the city. East Seattle also has a well-developed public transit system, with buses, light rail, and ferries operated by King County Metro and Sound Transit.
Transport
Type
Denver
East Seattle
Amtrak stations
2
0
Amtrak stations nearby
2
3
FAA registered aircraft
602
0
FAA registered aircraft manufacturers and dealers
28
0
Means of transportation to work
Type
Denver
East Seattle
Bicycle
1.5%
0.3%
Bus
2.6%
5%
Carpooled
8.8%
11%
Car alone
81.1%
76.3%
Motorcycle
0.1%
0.1%
Railroad
1.2%
0%
Streetcar
0.2%
0%
Taxicab
0.1%
0%
Walked
2.8%
1.7%
Average travel time to work
Type
Denver
East Seattle
Average
29.4 min
25 min
Real Estate
While the real estate market is strong in both cities, East Seattle typically commands higher property prices due to its proximity to large tech employers. Denver, while growing, is more affordable in terms of buying property.
Neighborhoods
Both cities offer diverse, vibrant neighborhoods each with its own charm. Denver's Capitol Hill is known for its buzzing nightlife while East Seattle's Bellevue is known for its serene parks and outdoor activities.
Houses and residents
Type
Denver
East Seattle
Houses
351,829
199,933
Average household size (people)
2.2
2.5
Houses occupied
326,634 (92.8%)
191,630 (95.8%)
Houses occupied by owners
164,429 (50.3%)
128,209 (66.9%)
Houses occupied by renters
162,205 (49.7%)
63,421 (33.1%)
Median rent asked for vacant for-rent units
$1,674
$2,281
Median price asked for vacant for-sale houses and condos
$970,375
$820,468
Estimated median house or condo value
$541,500
$877,325
Median number of rooms in apartments
3.5
3.5
Median number of rooms in houses and condos
6.4
7.8
Housing density (houses/condos per square mile)
2,294.3
920.9
Household income disparities
44%
34.9%
Housing units without a mortgage
2,112 (1.7%)
22,582 (20.8%)
Housing units with both a second mortgage and home equity loan
9,615 (7.6%)
352 (0.3%)
Housing units with a mortgage
123,690 (98.3%)
85,751 (79.2%)
Housing units with a home equity loan
273 (0.2%)
11,674 (10.8%)
Housing units with a second mortgage
12,819 (10.2%)
9,796 (9%)
Housing units lacking complete kitchen facilities
1.3%
0.8%
Housing units lacking complete plumbing facilities
Self-employed workers in own not incorporated business
24,661
16,907
State government workers
15,204
10,270
Unpaid family workers
763
584
Industries and Occupations
Denver has a broad mix of industries, including Aerospace and Defense, Technology, and Health. East Seattle is known for its thriving tech industry, housing some of the biggest names in technology, with professionals often engaging in highly skilled occupations.
Denver has a strong healthcare system, with nationally recognized hospitals. East Seattle similarly offers top-tier health care, with strong networks of hospitals, including the University of Washington Medicine.
Health (county statistics)
Type
Denver
East Seattle
General health status score of residents in this county from 1 (poor) to 5 (excellent)
Denver boasts a robust infrastructure including a comprehensive public transit system, international airport, highways and bike lanes. East Seattle, in contrast, has seen significant investments in infrastructure over the past several years with improvements in public transit and development of tech-infrastructure.
Infrastructure
Type
Denver
East Seattle
TV stations
17
16
Schools
School facilities
Type
Denver
East Seattle
Private elementary/middle schools
36
1
Private high schools
21
1
Public elementary/middle schools
151
2
Public high schools
58
2
Colleges/Universities
31
0
Culture and Food
Both cities have a rich cultural scene. Denver is known for its craft beer industry, Western history, and art scene. East Seattle is known for its diverse food scene, arts, music festivals, and strong Asian influences.
Sports Teams
Both Denver and East Seattle are home to NFL and MLB teams. Denver has the Broncos (NFL), Nuggets (NBA), and Rockies (MLB), while East Seattle is home to the Seahawks (NFL), Mariners (MLB), and Sounders (MLS).

 Denver, CO
 East Seattle, WA